. 2024 Jul 25;187(15):4113-4127.e13.
doi: 10.1016/j.cell.2024.05.023. Epub 2024 Jun 13.

An atlas of human vector-borne microbe interactions reveals pathogenicity mechanisms

Affiliations

An atlas of human vector-borne microbe interactions reveals pathogenicity mechanisms

Thomas M Hart et al. Cell. .

Abstract

Vector-borne diseases are a leading cause of death worldwide and pose a substantial unmet medical need. Pathogens binding to host extracellular proteins (the "exoproteome") represents a crucial interface in the etiology of vector-borne disease. Here, we used bacterial selection to elucidate host-microbe interactions in high throughput (BASEHIT)-a technique enabling interrogation of microbial interactions with 3,324 human exoproteins-to profile the interactomes of 82 human-pathogen samples, including 30 strains of arthropod-borne pathogens and 8 strains of related non-vector-borne pathogens. The resulting atlas revealed 1,303 putative interactions, including hundreds of pairings with potential roles in pathogenesis, including cell invasion, tissue colonization, immune evasion, and host sensing. Subsequent functional investigations uncovered that Lyme disease spirochetes recognize epidermal growth factor as an environmental cue of transcriptional regulation and that conserved interactions between intracellular pathogens and thioredoxins facilitate cell invasion. In summary, this interactome atlas provides molecular-level insights into microbial pathogenesis and reveals potential host-directed targets for next-generation therapeutics.

Keywords: Lyme disease; arthropod-borne disease; host sensing; host-pathogen interactions; infectious disease; mechanisms of pathogenicity; protein disulfide isomerase; systems biology; thioredoxin; vector-borne disease.


Conflict of interest statement

Declaration of interests N.W.P. and A.M.R. are inventors of a patent describing the BASEHIT technique.

Figures
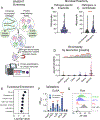
Figure 1.
Figure 1.. Atlas of pathogen: host exoprotein interactions.
(A) A diagram of the BASEHIT method illustrates how individual biotinylated pathogen samples were applied to a yeast display library consisting of 3,324 unique human extracellular proteins or protein epitopes. Pathogen-yeast complexes were selected by magnetic isolation using streptavidin-coated magnetic beads. Pathogen-enriched clones were identified by next generation sequencing of clone-specific barcode sequences. (B, C) The number of hits for each pathogen and commensal sample are shown with a violin plot showing the mean and quartiles. Hits are defined as human proteins with normalized enrichment scores above (B) a pathogen-specific threshold or (C) a global threshold of 5 in at least 2 of 3 replicates. Pathogens bound to significantly more human exoproteins than commensals (Mann-Whitney test, p-value < 0.0001). Commensal screens detailed in . (D) Samples of the same species tend to have more similar sets of human protein interacting partners, with significantly higher Jaccard similarity than other groupings (Kruskal-Wallis test with a Dunn’s multiple comparisons; p-values < 0.0001). There were no pairings of samples within the same family that were not of the same genus or species (E) Clusters of Gene Ontology (GO) biological processes (BP) and molecular functions (MF) enriched among the pathogen-binding human proteins are shown. Significantly enriched GO Terms were clustered based on similarity of protein makeup (κ > 0.5) and functional annotation. Clusters are plotted to the average -Log10(p-value) of each included GO Term. (F) ELISA validations of Borrelia binding proteins. B. burgdorferi B31 lysate was coated on microtiter wells in and probed with 0.2 (light blue) or 2 μg (dark blue) 6xHis-tagged IL28a, IL29, B- and T-Lymphocyte Attenuator (BTLA), Leukocyte Associated Immunoglobulin Like Receptor 1 (LAIR1), or the irrelevant 6xHis-tagged protein NeSt1 (gray), and stained with anti-His-HRP antibodies. Binding was determined by colorimetric analysis with TMB substrate. Values represent the geometric mean ± geometric standard deviation of three replicates, and significance was determined by a Kruskal-Wallis test with a Dunn’s multiple comparisons test (** = p-value < 0.005, **** = p-value < 0.0001). (G) Flow cytometric validations of B. burgdorferi N40 binding proteins were conducted by incubating B. burgdorferi N40 grown to 107 spirochetes/ml with 2 μg 6xHis-tagged LGALS3, LECT2, and AXL, as well as the positive control PGLYRP1 or negative control no protein (Ab alone) followed by staining with anti-His-AF-488 antibodies. Data shown are representative of at least 2 independent experiments.
Figure 2.
Figure 2.. Analysis of exoprotein hits and enriched GO biological pathways by Leptospira.
(A) Leptospira interrogans and biflexa were grown at 30°C, then maintained at 30°C (traditional culture conditions) or exposed to 37°C + 120 mM NaCl (to simulate host environment temperature and osmolality) for 4 hours. (B) The number of hits per sample for untreated or NaCl-treated L. interrogans and biflexa strains are shown, and samples of the same strain are paired by lines. As expected, host-adapted Leptospira bound to significantly more samples than untreated (*, one-tailed Wilcoxon test p-value = 0.03). (C) GO BPs significantly enriched by untreated or NaCl-treated Leptospira were determined by DAVID and plotted against -Log10(p-value) (EASE; p-value < 0.05). A Venn diagram listing the Leptospira-binding proteins in the top two pathways enriched by NaCl-binding Leptospira is shown to the right. (D) Flow cytometric and (E) ELISA validations of Leptospira-vasopressin (“AVP”) binding. (D) 107 spirochetes were incubated with 0 (“Ab only”), 10 or 200 nM of vasopressin (AVP), followed by an anti-vasopressin antibody and a PE-conjugated secondary antibody. (E) ELISA plates (n=2) were coated with 1, 10, or 100 ng vasopressin, or with 100 ng BSA per well, followed by 108 biotinylated host-adapted (tan) or untreated (blue) L. interrogans serovar Copenhageni L1–130. Binding was determined by HRP-conjugated streptavidin, and the lowest background reactivity between the Leptospira and BSA was subtracted from all samples.
Figure 3.
Figure 3.. Impact of EGF on B. burgdorferi gene expression.
(A) GO BPs significantly enriched by the temperature shifted Borrelia were determined by EASE with DAVID, and are plotted against the temperature treatment. Colors correspond with the --Log10(p-value) per the legend to the right, with significance indicated by the dotted line. (B) Flow cytometric validations were conducted by incubating B. burgdorferi B31 temperature-shifted to 33°C or 37°C with no protein or antibody (negative control; “Unstained”) secondary antibody alone (negative control; “Ab only”), 0.25 nM Fc-tagged EGF (light blue), or 1 nM of Fc-tagged EGF (dark blue, red). Binding was determined by an Alexa Fluor 488-conjugated anti-Fc antibody. (C) PCA plot of B. burgdorferi treated with Fc-tagged EGF or the Fc tag alone at 33°C and 37°C shows treatment specific clustering of gene expression profiles. Individual samples are colored according to the legend at right, and colored ovals illustrate sample groupings. (D) A hierarchical clustering heatmap illustrates B. burgdorferi samples and genes differentially expressed by B. burgdorferi treated with EGF-Fc or the Fc tag alone at 37°C. Colors correspond with the Z-score per the legend below. Differentially expressed genes (DEGs) were identified by DESeq2 on Partek flow with default conditions, with a fold change threshold of ±2 (EGF/Fc) and p-values < 0.05. Below, gene set enrichment analyses comparing genes up or downregulated by EGF treatment at 37°C uncovered that EGF treatment significantly upregulated B. burgdorferi genes expressed by spirochetes in dialysis membrane chambers (“DMC”) and downregulated genes expressed by spirochetes in feeding nymphs ( “Nymph”) . Open circles indicate no significant enrichment, while closed circles indicate significance (p < 0.05).
Figure 4.
Figure 4.. Comparison of intracellular and extracellular pathogen protein binding characteristics.
(A) Hits from screens with extracellular (orange) and intracellular (blue) pathogens are depicted. (B) The number of hits for each extracellular intracellular pathogen sample are shown with a violin plot showing the mean and quartiles. Hits are defined as human proteins with normalized enrichment scores above pathogen-specific thresholds in at least 2 of 3 replicates. Extracellular pathogens bound to significantly more hits-per-sample than intracellular (Two-tailed Mann-Whitney test, p-value = 0.0004). (C) Gene ontology annotated biological pathways or cellular components that are significantly enriched among human proteins binding to extracellular or intracellular pathogens are plotted against their -Log10(p-value). Significant enrichment (beyond the solid vertical line at 1.3) is indicated by solid circles, while empty circles indicate no significant enrichment. Significance was determined by DAVID (EASE p-value < 0.05, κ > 0.5). (D) An illustration highlights that extracellular and intracellular pathogens hits enriched extracellular and intracellular cell components. Numbers correspond with those shown in (C). (E) A global network analysis illustrating proteins (gray and green circles) interacting with at least two extracellular or intracellular samples are shown. Proteins shown to bind to at least 10 samples are highlighted in green, and the inset details the proteins making up a cluster of 9 such proteins displaying a strong bias for intracellular pathogen binding. Protein disulfide isomerases (PDI) are highlighted in yellow (F) The percentage of overall hits per sample that are PDIs or Thioredoxins (TXN) are shown for intracellular and extracellular pathogens. As expected, intracellular pathogens bound significantly more of these proteins than extracellular pathogens (Mann-Whitney test, p-value < 0.0001).
Figure 5.
Figure 5.. Bacitracin inhibition of intracellular pathogen cell invasion.
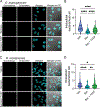
(A,C) Cells were first treated with water (“Vehicle”) or bacitracin, then washed and incubated with O. tsutsugamushi or R. montanensis in the presence of water or a reducing agent, tris(2-carboxyethyl)phosphine (“TCEP”). Extracellular bacteria were then labeled with membrane impermeable Alexafluor-488 tagged antibodies, cells were permeabilized, then all bacteria (intracellular and extracellular) were labeled with Alexa Fluor-594 conjugated antibodies. Shown are representative images of (A) HeLa cells seeded with O. tsutsugamushi and (C) Vero76 cells seeded with R. montanensis. The intracellular bacteria per cell are shown as a composite of 4 experiments with 100 cells counted per experiment in (B) O. tsutsugamushi and (D) R. montanensis per cell were counted, and counts were compared across treatments (water: Blue, “Veh”, Bacitracin: Teal, “Bac”, and Bacitracin + TCEP: Green, “Bac + TCEP”). Comparisons were made between groups by Kruskal-Wallis test with a Dunn’s multiple comparisons test (**** = p-values <0.0001, ** = 0.0019, * = 0.0399.)

References

    1. Tomlin and Piccinini, 2018, A complex interplay between the extracellular matrix and the innate immune response to microbial pathogens. Immunology, 155(2): p. 186–201. 10.1111/imm.12972 - DOI - PMC - PubMed
    1. Kline, et al. , 2009, Bacterial adhesins in host-microbe interactions. Cell Host Microbe, 5(6): p. 580–92. 10.1016/j.chom.2009.05.011 - DOI - PubMed
    1. Ribet and Cossart, 2015, How bacterial pathogens colonize their hosts and invade deeper tissues. Microbes Infect, 17(3): p. 173–83. 10.1016/j.micinf.2015.01.004 - DOI - PubMed
    1. Pizarro-Cerda and Cossart, 2006, Bacterial adhesion and entry into host cells. Cell, 124(4): p. 715–27. 10.1016/j.cell.2006.02.012 - DOI - PubMed
    1. Dunkelberger and Song, 2010, Complement and its role in innate and adaptive immune responses. Cell Res, 20(1): p. 34–50. 10.1038/cr.2009.139 - DOI - PubMed

LinkOut - more resources