Review
. 2024 Sep;11(1):125-146.
doi: 10.1146/annurev-virology-100422-012608. Epub 2024 Aug 30.

Studying Retroviral Life Cycles Using Visible Viruses and Live Cell Imaging

Affiliations
Review

Studying Retroviral Life Cycles Using Visible Viruses and Live Cell Imaging

Jorge F Guerrero et al. Annu Rev Virol. 2024 Sep.

Abstract

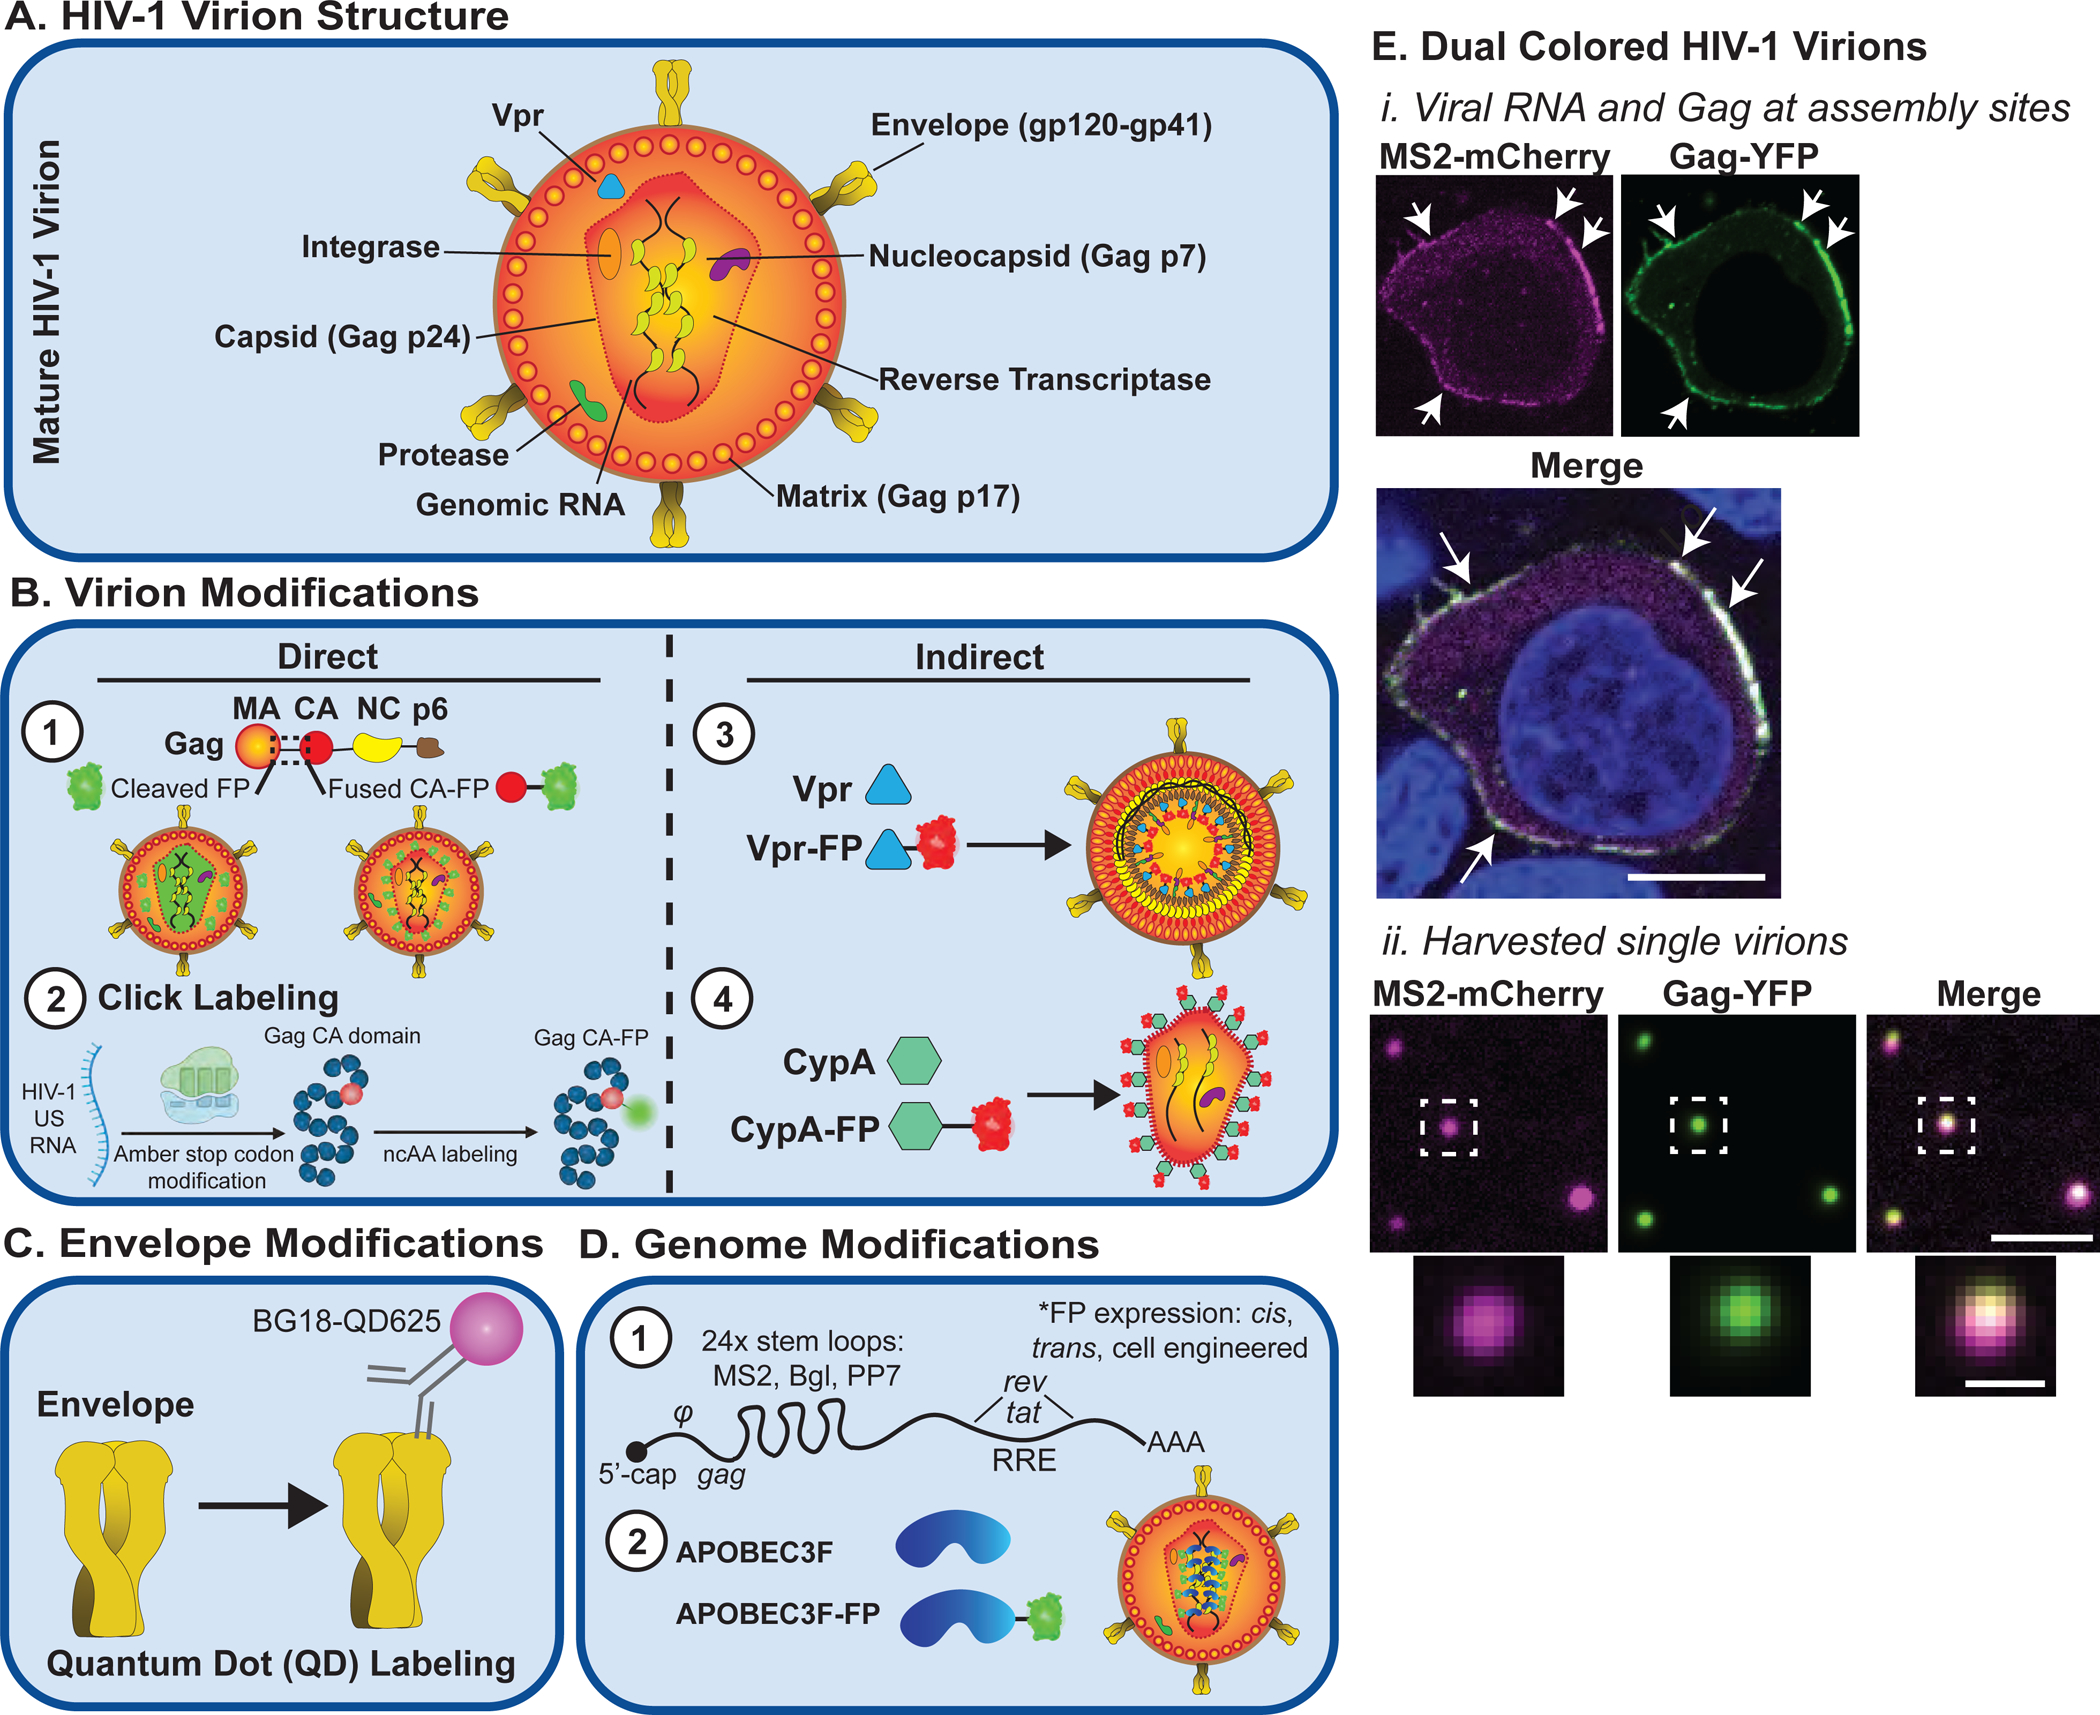
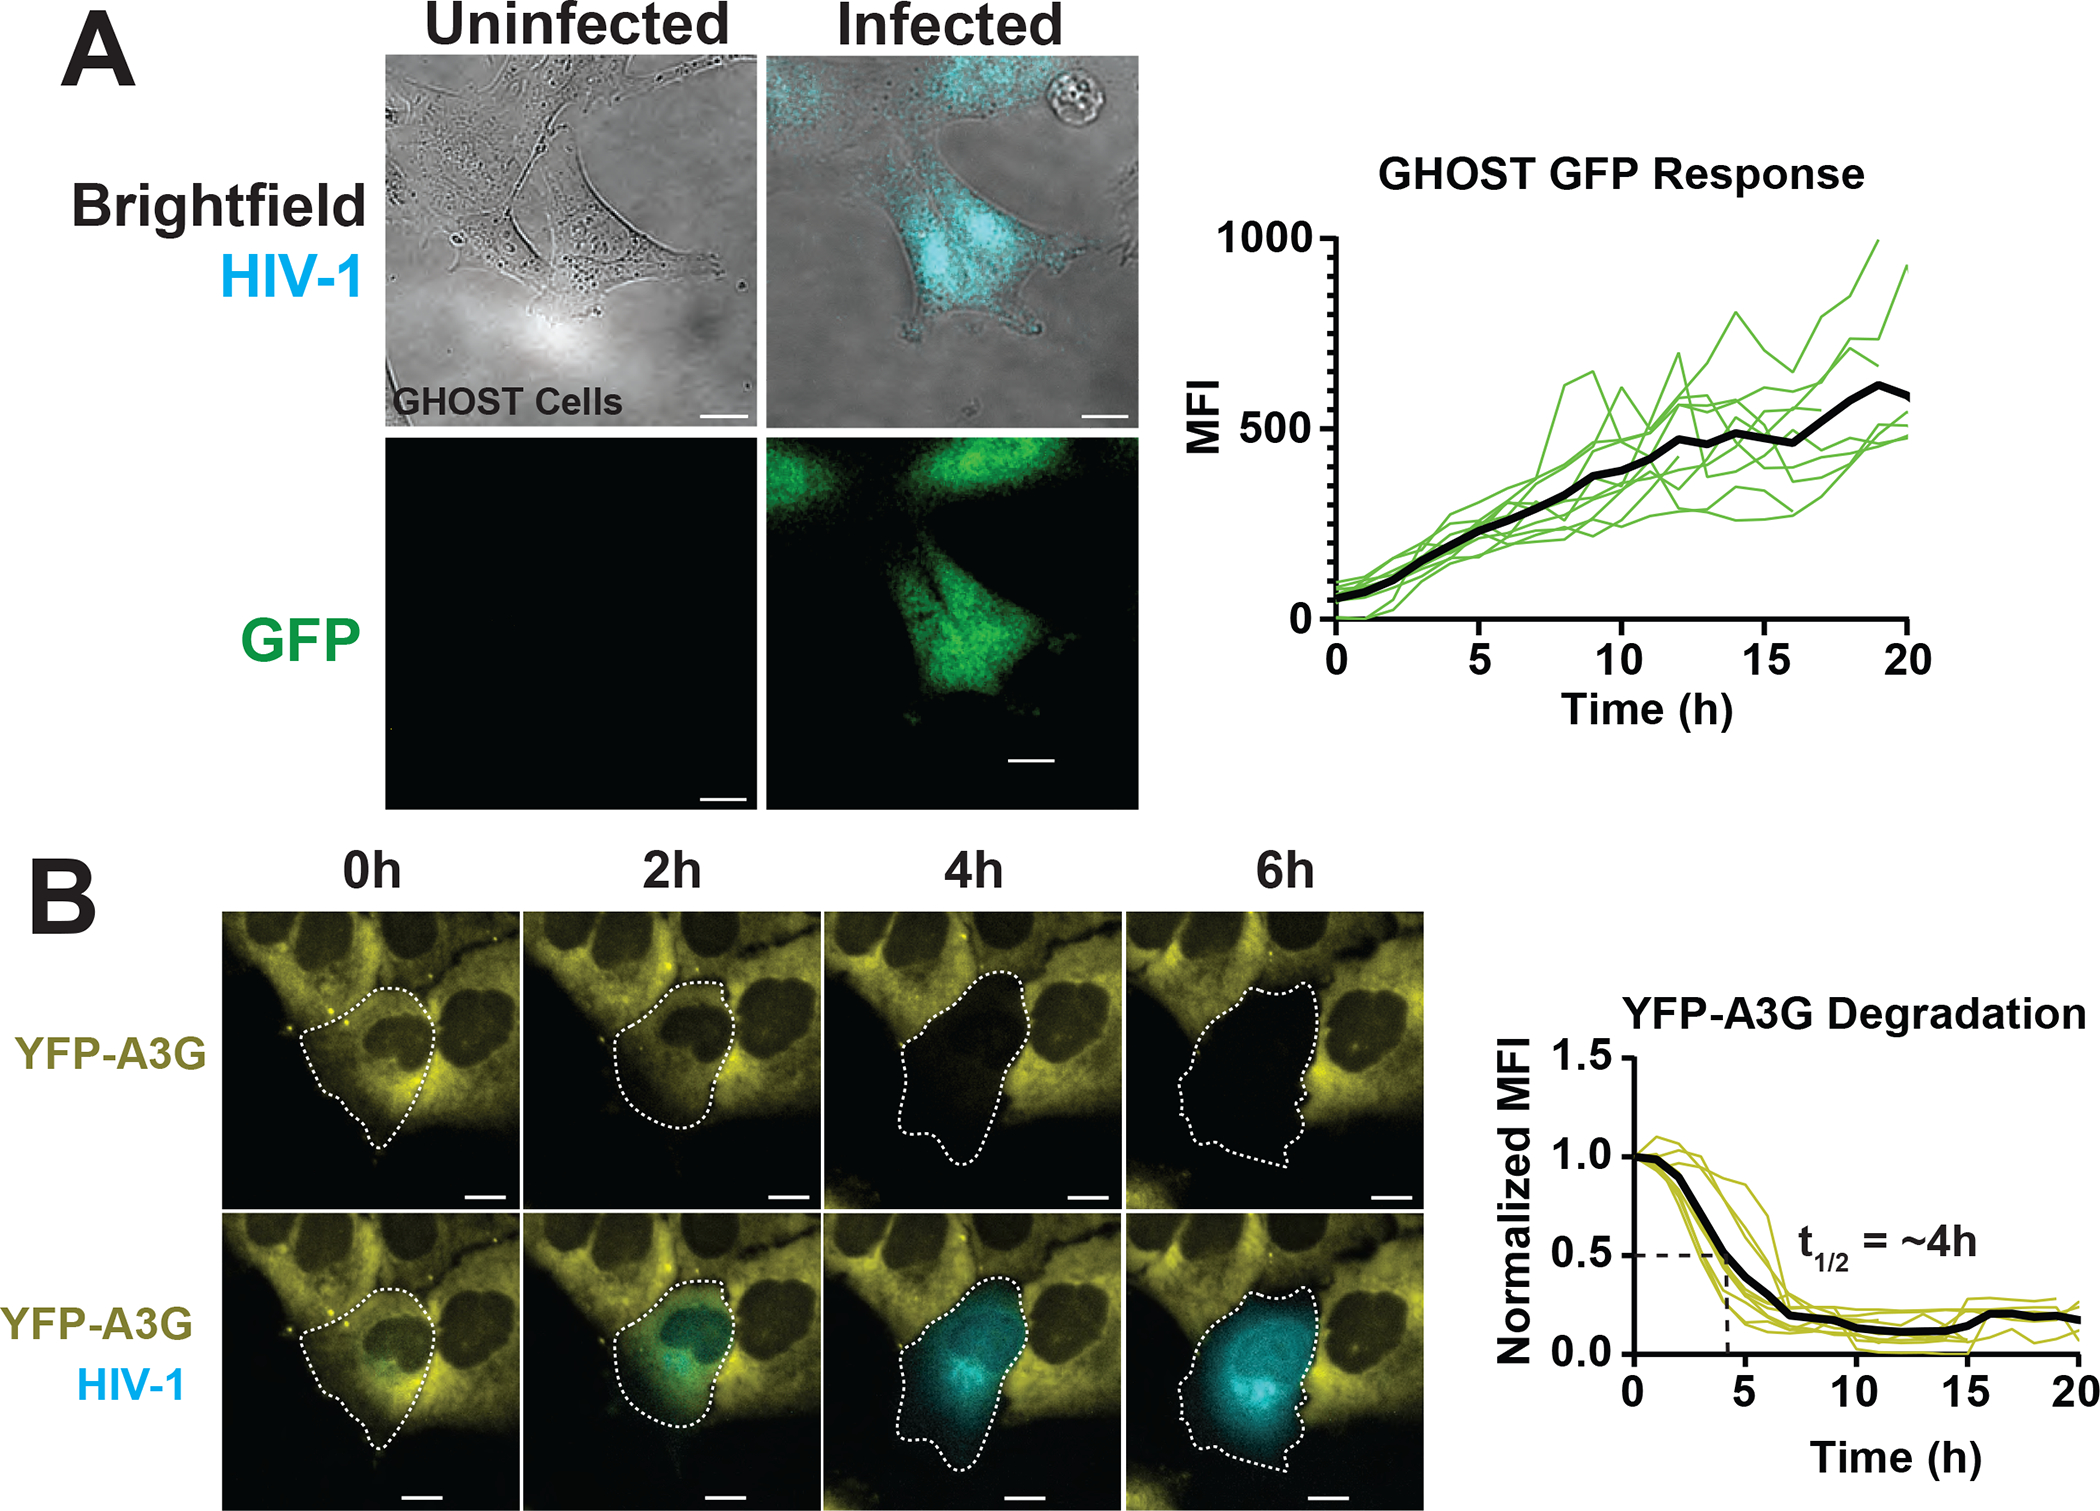
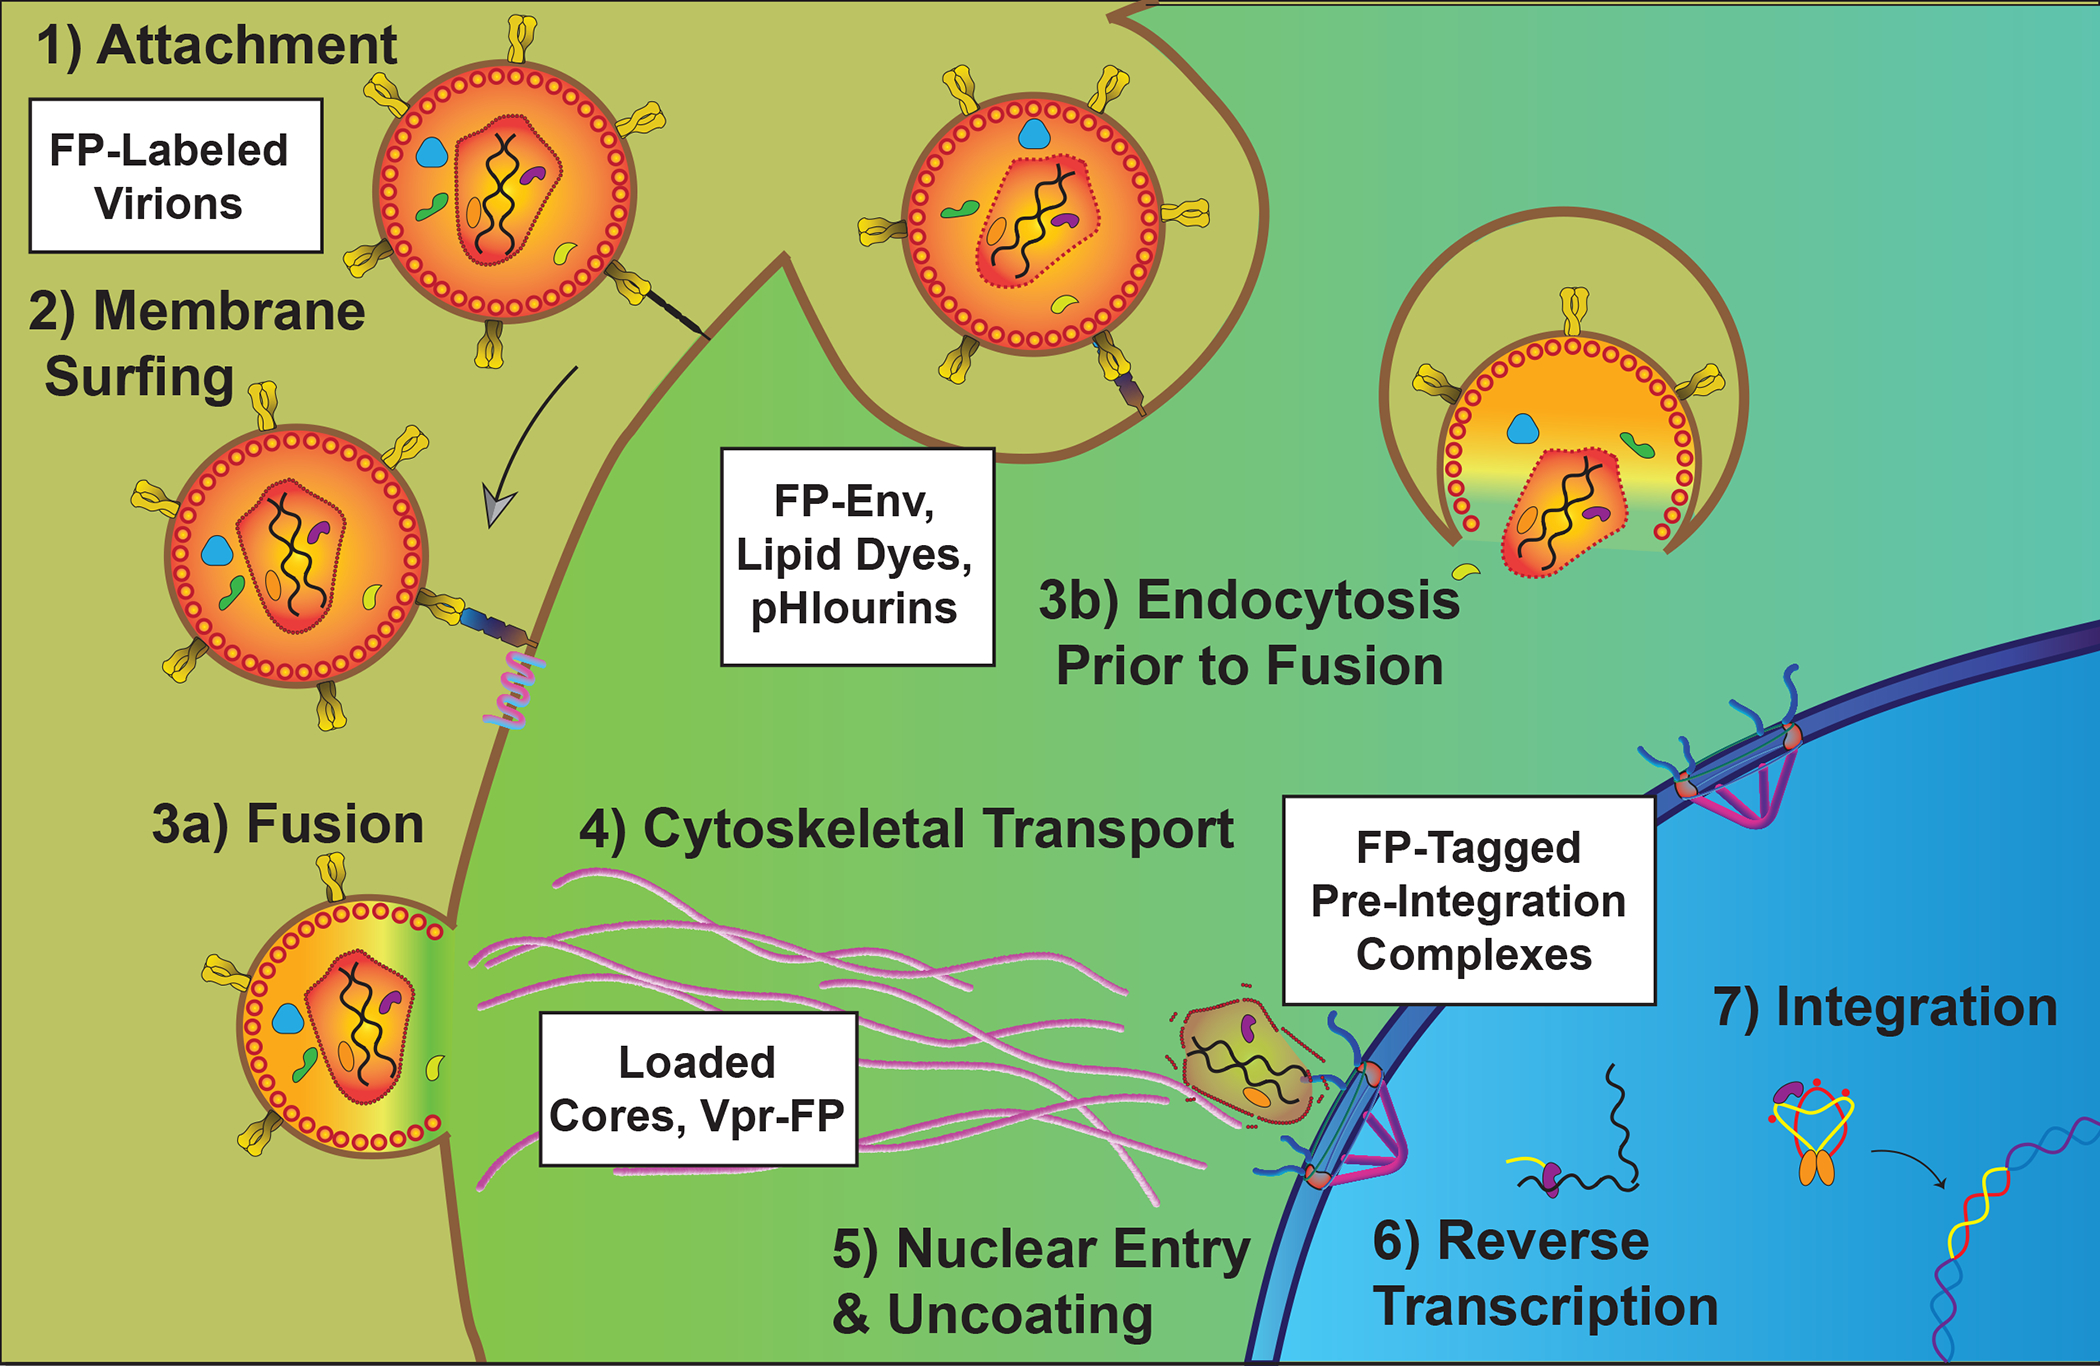
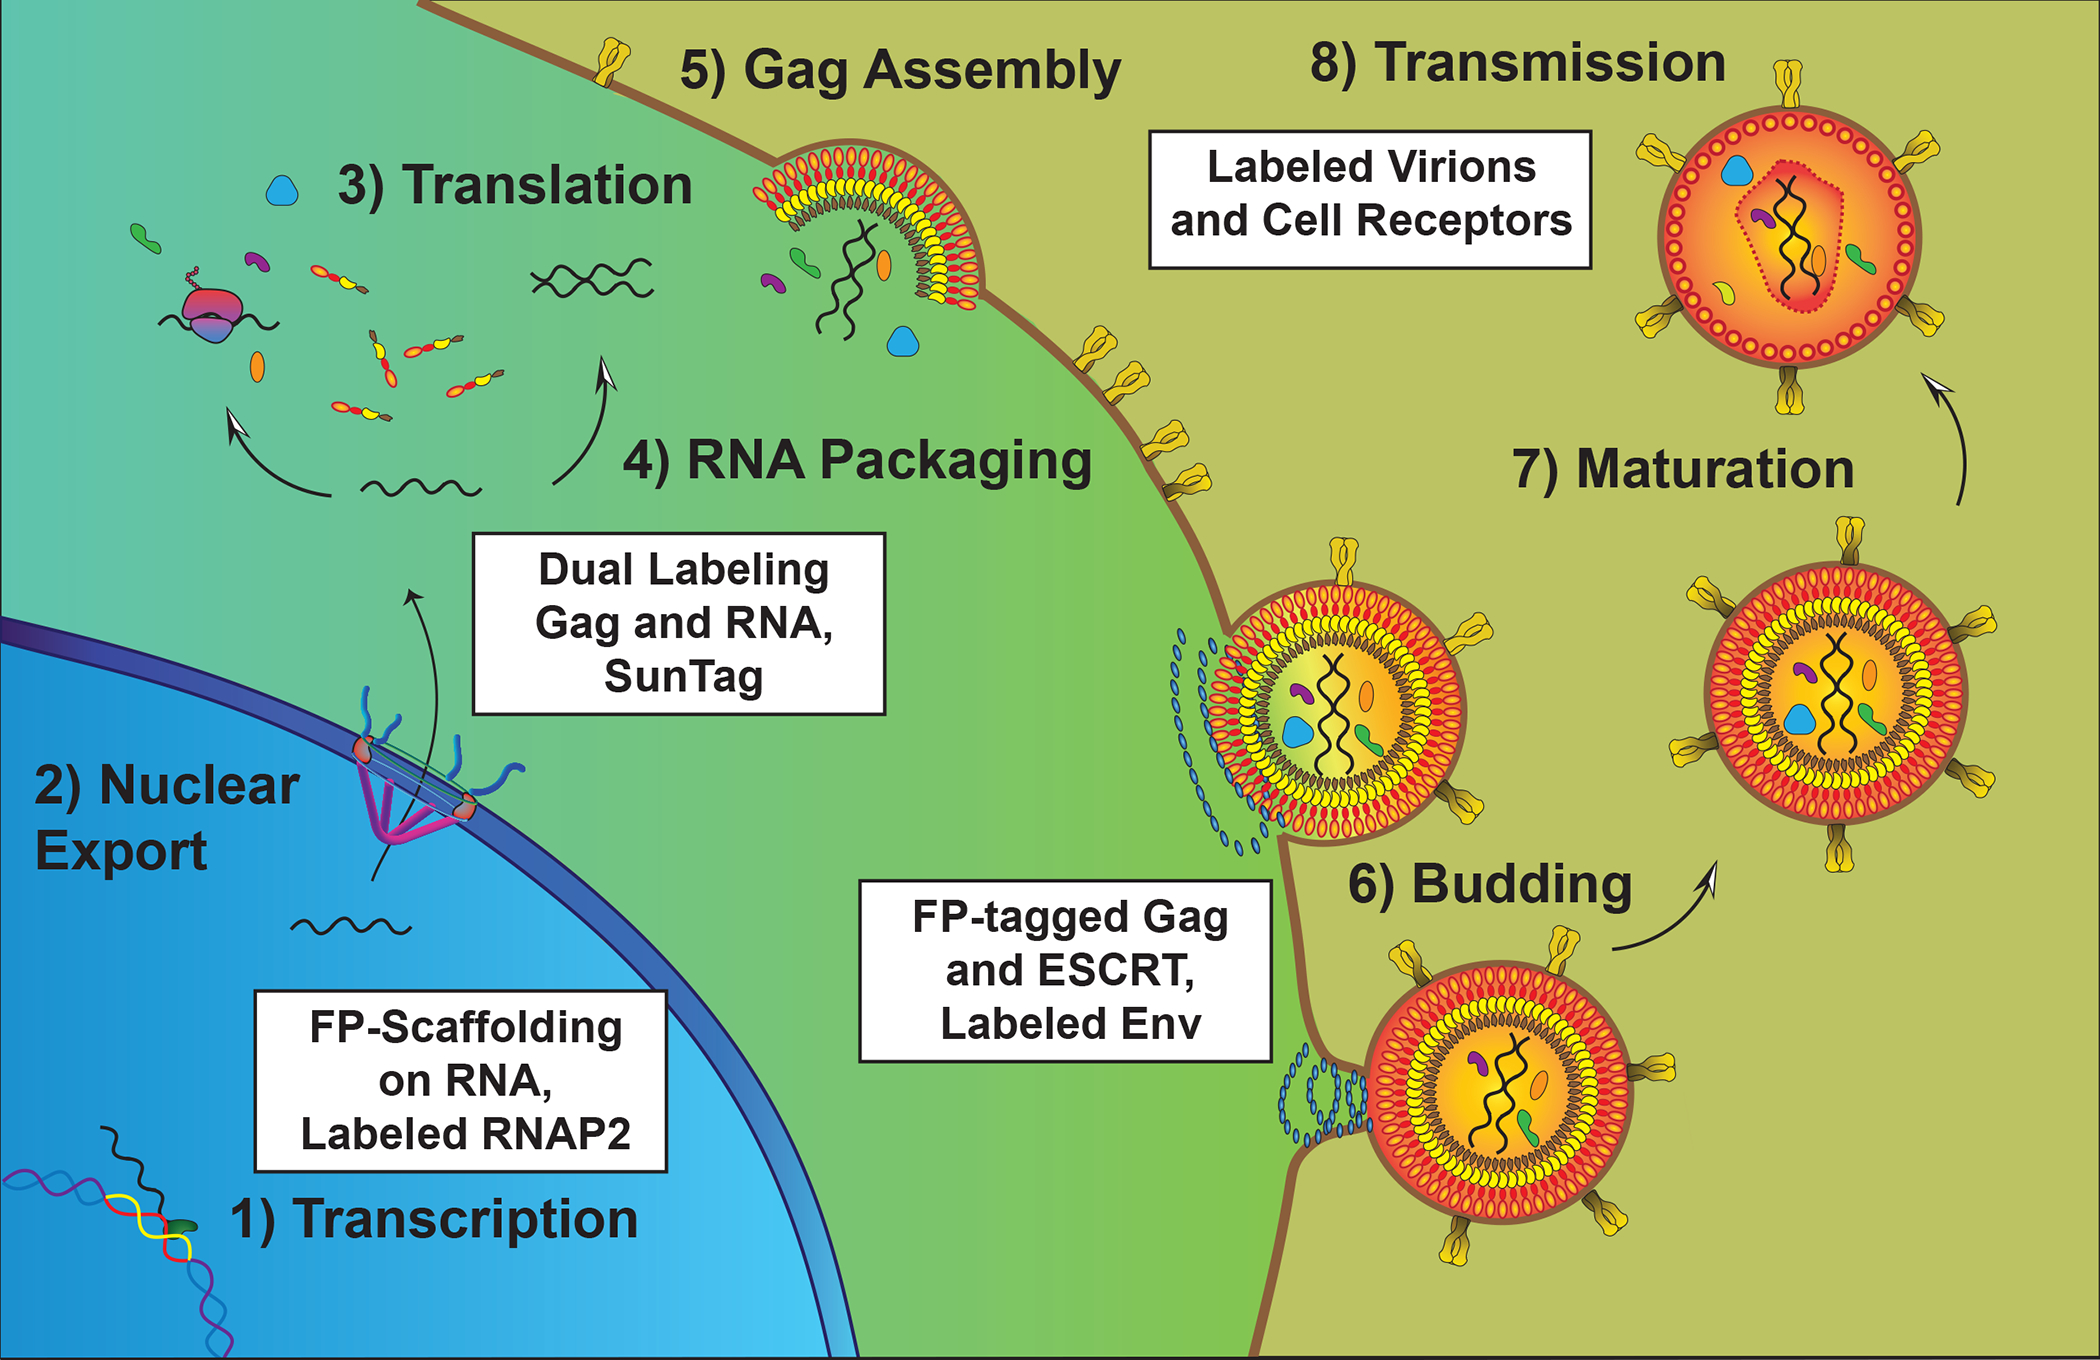
Viruses exploit key host cell factors to accomplish each individual stage of the viral replication cycle. To understand viral pathogenesis and speed the development of new antiviral strategies, high-resolution visualization of virus-host interactions is needed to define where and when these events occur within cells. Here, we review state-of-the-art live cell imaging techniques for tracking individual stages of viral life cycles, focusing predominantly on retroviruses and especially human immunodeficiency virus type 1, which is most extensively studied. We describe how visible viruses can be engineered for live cell imaging and how nonmodified viruses can, in some instances, be tracked and studied indirectly using cell biosensor systems. We summarize the ways in which live cell imaging has been used to dissect the retroviral life cycle. Finally, we discuss select challenges for the future including the need for better labeling strategies, increased resolution, and multivariate systems that will allow for the study of full viral replication cycles.

Keywords: fluorescence microscopy; live cell imaging; time-lapse imaging; virus replication.


Figures

Figure 1.
Figure 1.
Examples of engineered visible HIV-1 virions. A. HIV-1 virion structure. B. HIV-1 capsid modifications using direct or indirect labeling of Gag. Direct labeling of HIV-1 Gag using (1) fluorescent protein (FP) fusions or (2) click labeling, or indirect labeling using (3) Vpr-FP or (4) CypA-FP. C. HIV-1 Envelope has been successfully tracked using antibodies covalently linked to bright fluorescent dyes such as BG18-QD625 quantum dots. D. (1) HIV-1 RNA genomes modified with RNA stem loops for tracking using stem loop-binding proteins, or (2) direct interaction of nonmodified viral genomes with an FP fused to host RNA-binding protein APOBEC3F. E. Example of two-color HIV-1 virions generated after co-expression of MS2-mCherry-tagged viral RNA genomes and Gag-YFP (i) assembling at the plasma membrane of a HeLa cell or (ii.) visualized after harvesting single virus particles from cell supernatants; cell scale bar = 5 μm, virion scale bar =2.5 μm, inset = 0.5 μm.
Figure 2.
Figure 2.
Summary of select cell-based FP-based HIV-1 biosensor strategies. A. Direct detection of HIV- 1 infection using GHOST (HIV-1 LTR-responsive GFP expression), with single cell changes to mean fluorescence intensity shown for a 20h time course (bold line is average for n=10). B. Indirect detection of HIV-1 using YFP-APOBEC3G downregulated by HIV-1 Vif. Graphs show single cell changes to relative mean fluorescence intensity shown for a 20h time course (bold line is average for n=10). The t1/2 measure represents time to 50% single cell signal decay. Size bars = 20μm.
Figure 3.
Figure 3.
Tracking HIV-1 during entry and the pre-integration stages. HIV-1 first binds to cell surface moieties (Stage 1) and then receptor proteins CD4 and a chemokine co-receptor (Stage 2) prior to undergoing fusion at the plasma membrane or in endosomes (Stage 3). Various labeling methods including lipid dyes and FP-labelled Envelope glycoproteins have been used to study these stages using live cell imaging. Released capsids are trafficked to the nucleus in association with the cytoskeleton (Stage 4), enter the nucleus (Stage 5) during or after reverse transcription (Stage 6) to form the viral pre-integration complex (PIC) and integration of the DNA provirus into the cell’s genome (Stage 7). Established and emerging techniques for tracking HIV-1’s post-entry stages include direct capsid labeling using Gag-FP fusions or chemical probes, indirect capsid labeling using FP-tagged proxies (e.g., based on Vpr or Cyclophilin A), or detecting viral nucleic acids using FP-labeled host proteins or FP-scaffolding.
Figure 4.
Figure 4.
Tracking HIV-1 during the post-integration stages. HIV-1 transcription is driven by host RNAP2 in the nucleus (Stage 1) with viral RNAs (spliced, partially spliced, and unspliced) exported from the nucleus to the cytoplasm through nuclear pores. In the cytoplasm, viral unspliced (US) RNA is either translated to generate Gag and Gag-Pol proteins (Stage 3) or transported by Gag to the plasma membrane for genome packaging (Stage 4). Gag and Gag-Pol multimerization at the plasma membrane driving virion assembly (Stage 5), recruiting Envelope glycoproteins that stud the viral membrane and host ESCRT proteins that mediate membrane scission at the end of the budding stage (Stage 6). After or during budding, the viral protease is activated and cleaves Gag and Gag-Pol into protein subunits including Capsid (CA) that forms the infectious, conical core; a process called maturation (Stage 7). Virions can then be transmitted among cells and tissues to spread infection (Stage 8).

Similar articles

Cited by

References

    1. Bernal JD, Fankuchen I. 1937. Structure Types of Protein Crystals from Virus-infected Plants. Nature. 139(3526):923–24
    1. Brenner S, Horne RW. 1959. A negative staining method for high resolution electron microscopy of viruses. Biochim Biophys Acta. 34:103–10 - PubMed
    1. Lowy RJ, Sarkar DP, Chen Y, Blumenthal R. 1990. Observation of single influenza virus-cell fusion and measurement by fluorescence video microscopy. Proc Natl Acad Sci U S A. 87(5):1850–54 - PMC - PubMed
    1. Georgi A, Mottola-Hartshorn C, Warner A, Fields B, Chen LB. 1990. Detection of individual fluorescently labeled reovirions in living cells. Proc Natl Acad Sci U S A. 87(17):6579–83 - PMC - PubMed
    1. Arnheiter H, Dubois-Dalcq M, Lazzarini RA. 1984. Direct visualization of protein transport and processing in the living cell by microinjection of specific antibodies. Cell. 39(1):99–109 - PubMed

LinkOut - more resources