

Assessing fairness in machine learning models: A study of racial bias using matched counterparts in mortality prediction for patients with chronic diseases
- PMID: 38876453
- PMCID: PMC11272432
- DOI: 10.1016/j.jbi.2024.104677
Assessing fairness in machine learning models: A study of racial bias using matched counterparts in mortality prediction for patients with chronic diseases
Abstract
Objective: Existing approaches to fairness evaluation often overlook systematic differences in the social determinants of health, like demographics and socioeconomics, among comparison groups, potentially leading to inaccurate or even contradictory conclusions. This study aims to evaluate racial disparities in predicting mortality among patients with chronic diseases using a fairness detection method that considers systematic differences.
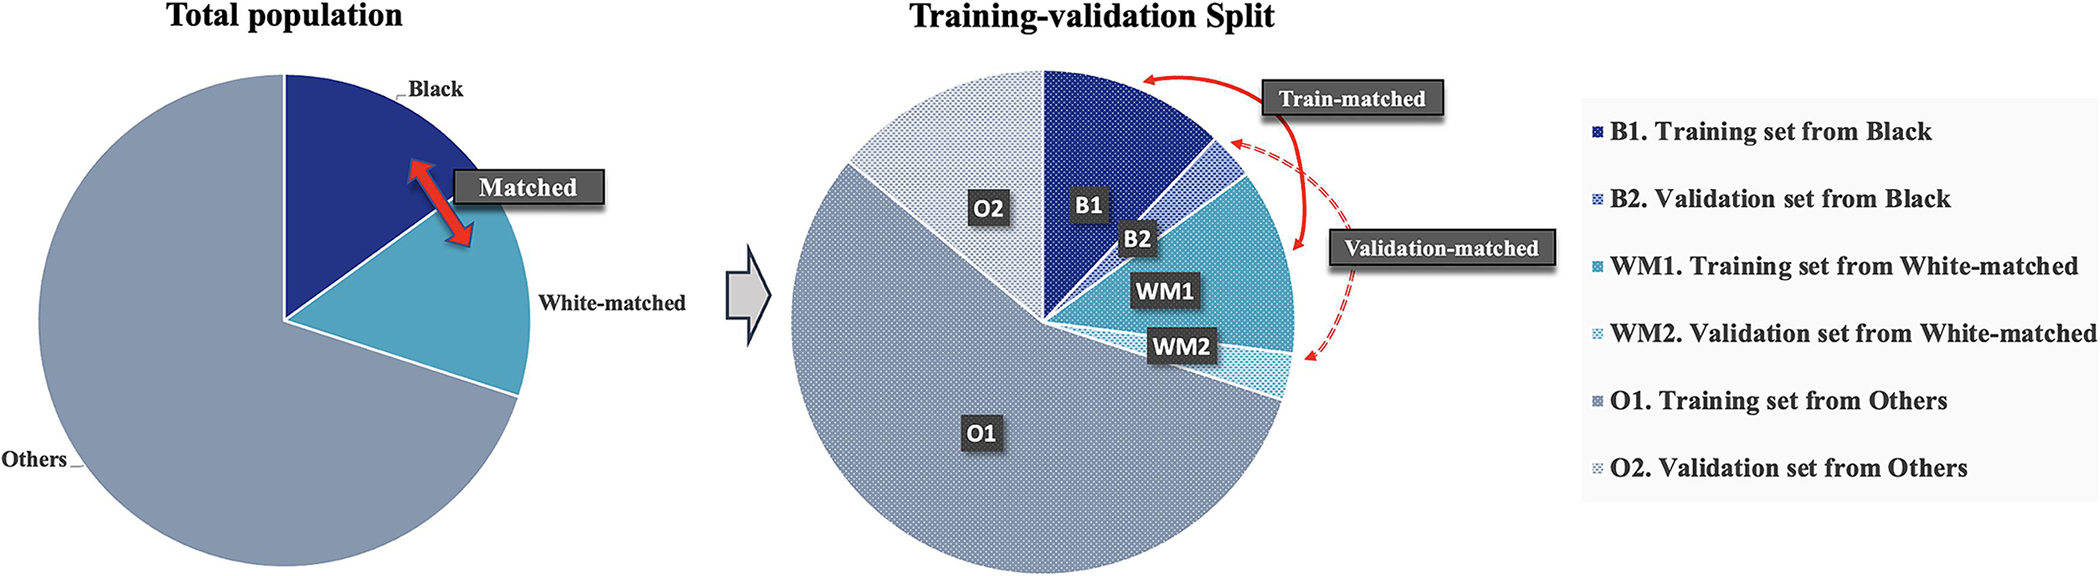
Methods: We created five datasets from Mass General Brigham's electronic health records (EHR), each focusing on a different chronic condition: congestive heart failure (CHF), chronic kidney disease (CKD), chronic obstructive pulmonary disease (COPD), chronic liver disease (CLD), and dementia. For each dataset, we developed separate machine learning models to predict 1-year mortality and examined racial disparities by comparing prediction performances between Black and White individuals. We compared racial fairness evaluation between the overall Black and White individuals versus their counterparts who were Black and matched White individuals identified by propensity score matching, where the systematic differences were mitigated.
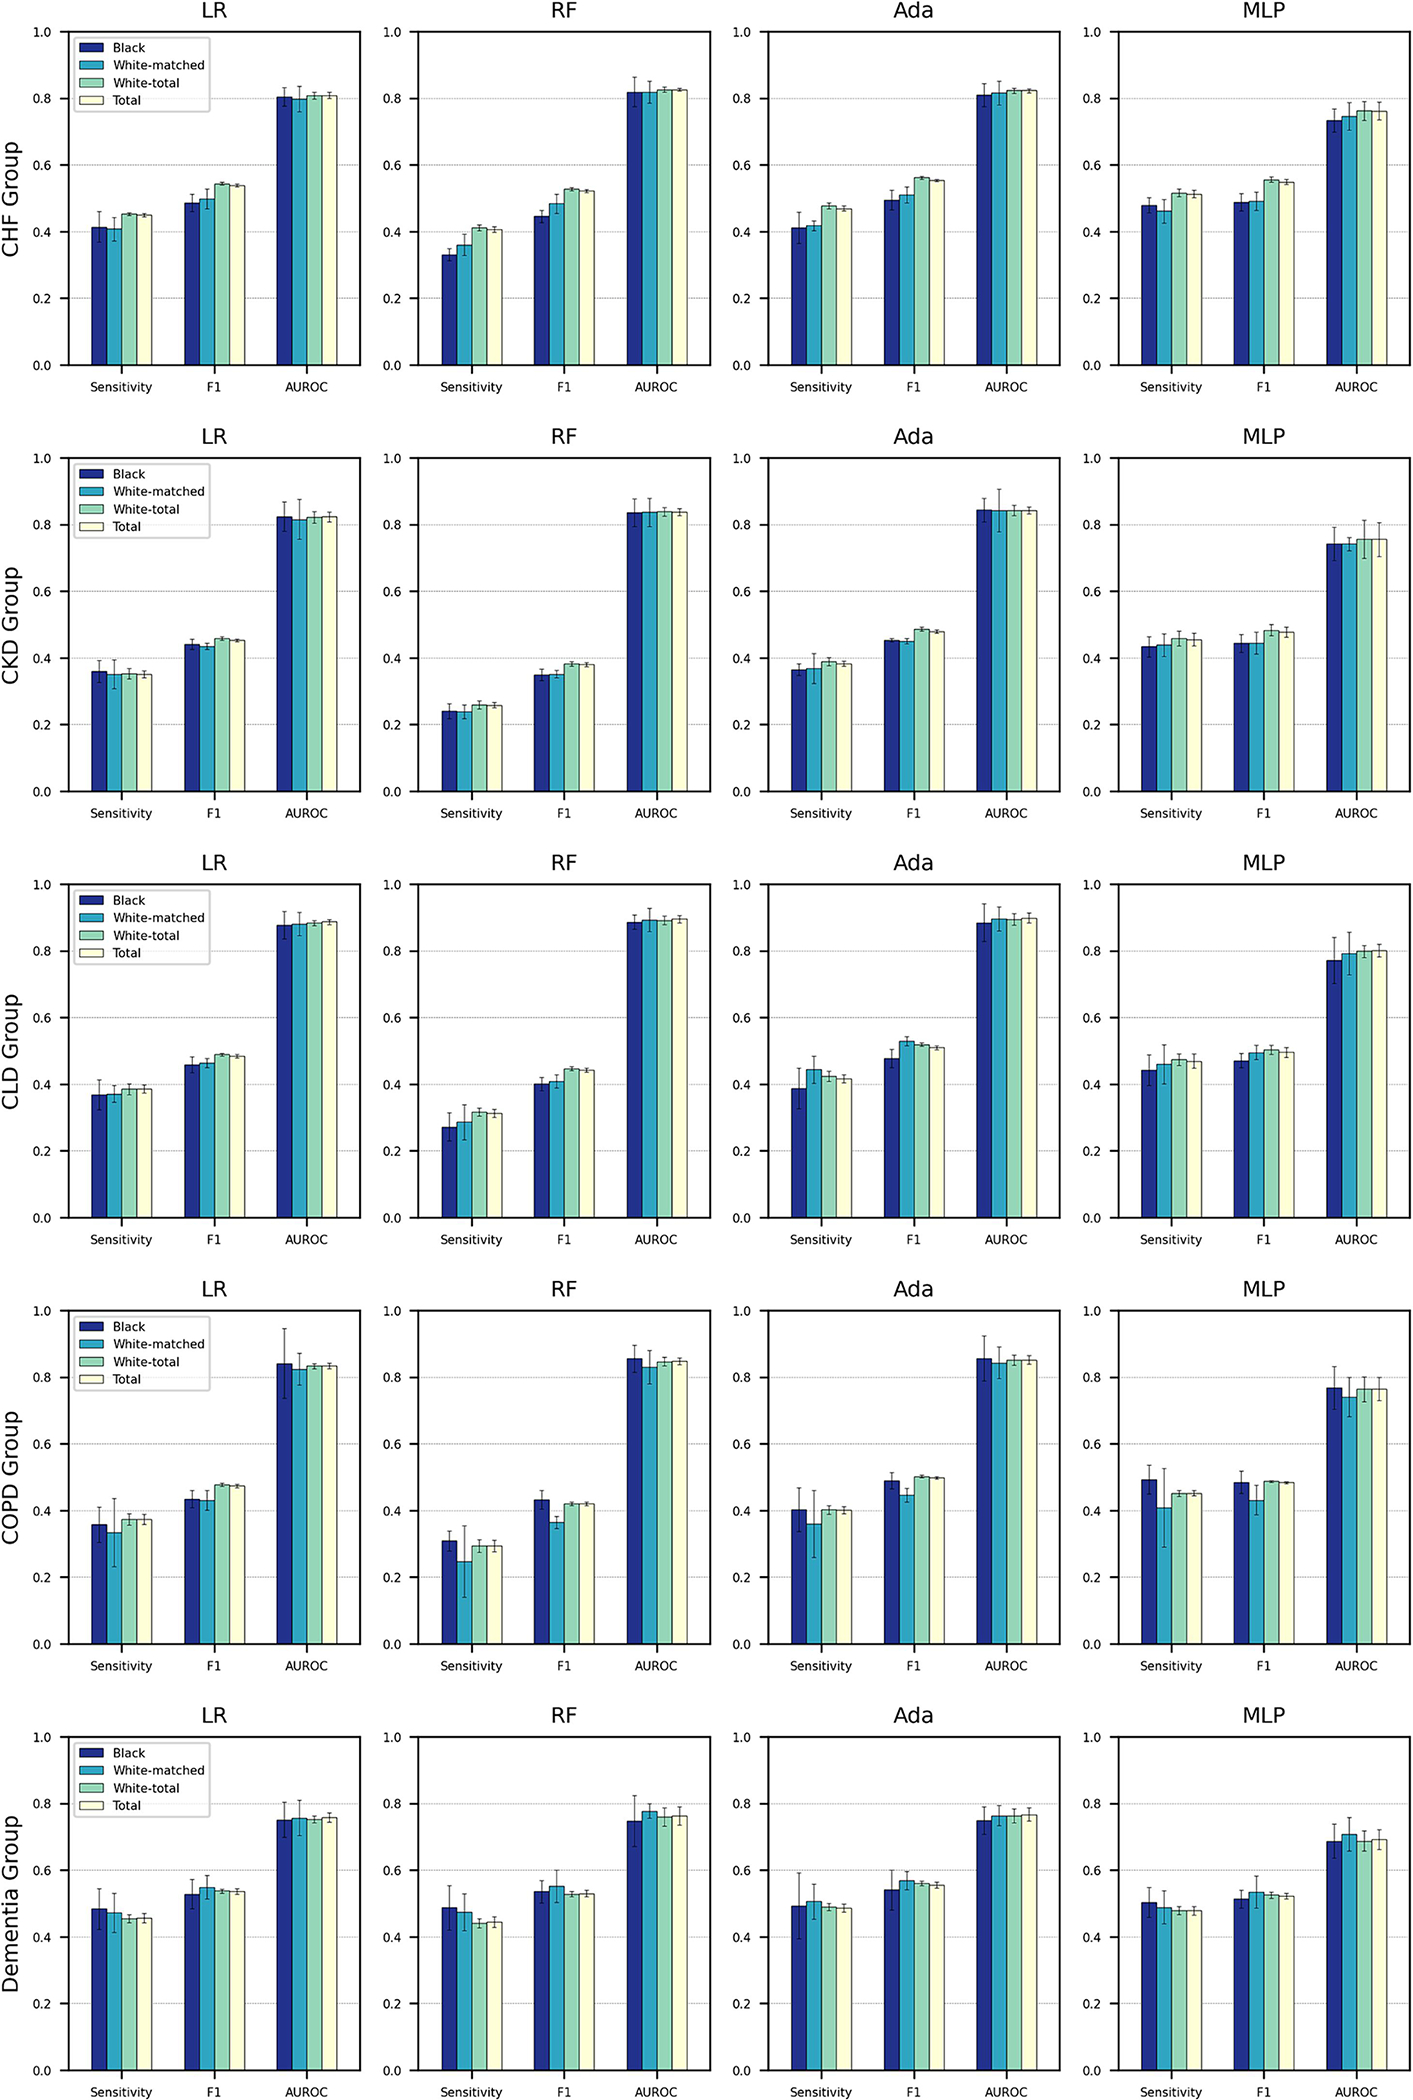
Results: We identified significant differences between Black and White individuals in age, gender, marital status, education level, smoking status, health insurance type, body mass index, and Charlson comorbidity index (p-value < 0.001). When examining matched Black and White subpopulations identified through propensity score matching, significant differences between particular covariates existed. We observed weaker significance levels in the CHF cohort for insurance type (p = 0.043), in the CKD cohort for insurance type (p = 0.005) and education level (p = 0.016), and in the dementia cohort for body mass index (p = 0.041); with no significant differences for other covariates. When examining mortality prediction models across the five study cohorts, we conducted a comparison of fairness evaluations before and after mitigating systematic differences. We revealed significant differences in the CHF cohort with p-values of 0.021 and 0.001 in terms of F1 measure and Sensitivity for the AdaBoost model, and p-values of 0.014 and 0.003 in terms of F1 measure and Sensitivity for the MLP model, respectively.
Discussion and conclusion: This study contributes to research on fairness assessment by focusing on the examination of systematic disparities and underscores the potential for revealing racial bias in machine learning models used in clinical settings.
Keywords: Chronic Disease; Electronic Health Records; Fairness Analysis; Machine Learning; Mortality Prediction; Racism.
Copyright © 2024 Elsevier Inc. All rights reserved.
Conflict of interest statement
Declaration of competing interest The authors declare that they have no known competing financial interests or personal relationships that could have appeared to influence the work reported in this paper. Declaration of generative AI and AI-assisted technologies in the writing process Statement: During the preparation of this work the author(s) used ChatGPT in order to improve writing. After using this tool/service, the author(s) reviewed and edited the content as needed and take(s) full responsibility for the content of the publication.
Figures

Similar articles
-
Comparison of Two Modern Survival Prediction Tools, SORG-MLA and METSSS, in Patients With Symptomatic Long-bone Metastases Who Underwent Local Treatment With Surgery Followed by Radiotherapy and With Radiotherapy Alone.Clin Orthop Relat Res. 2024 Dec 1;482(12):2193-2208. doi: 10.1097/CORR.0000000000003185. Epub 2024 Jul 23. Clin Orthop Relat Res. 2024. PMID: 39051924
-
A Responsible Framework for Assessing, Selecting, and Explaining Machine Learning Models in Cardiovascular Disease Outcomes Among People With Type 2 Diabetes: Methodology and Validation Study.JMIR Med Inform. 2025 Jun 27;13:e66200. doi: 10.2196/66200. JMIR Med Inform. 2025. PMID: 40577645 Free PMC article.
-
Hospital-level variation in racial disparities in low-risk nulliparous cesarean delivery rates.Am J Obstet Gynecol MFM. 2023 Dec;5(12):101145. doi: 10.1016/j.ajogmf.2023.101145. Epub 2023 Aug 28. Am J Obstet Gynecol MFM. 2023. PMID: 37648109 Free PMC article.
-
Inhaled steroids and risk of pneumonia for chronic obstructive pulmonary disease.Cochrane Database Syst Rev. 2014 Mar 10;2014(3):CD010115. doi: 10.1002/14651858.CD010115.pub2. Cochrane Database Syst Rev. 2014. PMID: 24615270 Free PMC article.
-
Computer and mobile technology interventions for self-management in chronic obstructive pulmonary disease.Cochrane Database Syst Rev. 2017 May 23;5(5):CD011425. doi: 10.1002/14651858.CD011425.pub2. Cochrane Database Syst Rev. 2017. PMID: 28535331 Free PMC article.
Cited by
-
Towards machine learning fairness in classifying multicategory causes of deaths in colorectal or lung cancer patients.bioRxiv [Preprint]. 2025 Feb 19:2025.02.14.638368. doi: 10.1101/2025.02.14.638368. bioRxiv. 2025. Update in: Brief Bioinform. 2025 Jul 2;26(4):bbaf398. doi: 10.1093/bib/bbaf398. PMID: 40027644 Free PMC article. Updated. Preprint.
-
Electronic Health Record Phenotyping of Pediatric Suicide-Related Emergency Department Visits.JAMA Netw Open. 2024 Oct 1;7(10):e2442091. doi: 10.1001/jamanetworkopen.2024.42091. JAMA Netw Open. 2024. PMID: 39470636 Free PMC article.
-
Towards machine learning fairness in classifying multicategory causes of deaths in colorectal or lung cancer patients.Brief Bioinform. 2025 Jul 2;26(4):bbaf398. doi: 10.1093/bib/bbaf398. Brief Bioinform. 2025. PMID: 40794953 Free PMC article.
-
Biases in Artificial Intelligence Application in Pain Medicine.J Pain Res. 2025 Feb 28;18:1021-1033. doi: 10.2147/JPR.S495934. eCollection 2025. J Pain Res. 2025. PMID: 40041672 Free PMC article. Review.
References
-
- Fiscella K, Sanders MR. Racial and ethnic disparities in the quality of health care. Annual review of public health. 2016;37:375–94. - PubMed
-
- Flores G, Research CoP. Racial and ethnic disparities in the health and health care of children. Pediatrics. 2010;125(4):e979–e1020. - PubMed
-
- National Academies of Sciences E, Medicine. Communities in action: Pathways to health equity. 2017. - PubMed
-
- Siddiqi AA, Wang S, Quinn K, Nguyen QC, Christy AD. Racial disparities in access to care under conditions of universal coverage. American journal of preventive medicine. 2016;50(2):220–5. - PubMed
-
- Wheeler SM, Bryant AS. Racial and ethnic disparities in health and health care. Obstetrics and Gynecology Clinics. 2017;44(1):1–11. - PubMed
Publication types
MeSH terms
Grants and funding
LinkOut - more resources
Full Text Sources
Medical
