. 2024 Jun 14;15(1):5095.
doi: 10.1038/s41467-024-49192-2.

Scanless two-photon voltage imaging

Affiliations

Scanless two-photon voltage imaging

Ruth R Sims et al. Nat Commun. .

Abstract

Two-photon voltage imaging has long been heralded as a transformative approach capable of answering many long-standing questions in modern neuroscience. However, exploiting its full potential requires the development of novel imaging approaches well suited to the photophysical properties of genetically encoded voltage indicators. We demonstrate that parallel excitation approaches developed for scanless two-photon photostimulation enable high-SNR two-photon voltage imaging. We use whole-cell patch-clamp electrophysiology to perform a thorough characterization of scanless two-photon voltage imaging using three parallel illumination approaches and lasers with different repetition rates and wavelengths. We demonstrate voltage recordings of high-frequency spike trains and sub-threshold depolarizations from neurons expressing the soma-targeted genetically encoded voltage indicator JEDI-2P-Kv. Using a low repetition-rate laser, we perform multi-cell recordings from up to fifteen targets simultaneously. We co-express JEDI-2P-Kv and the channelrhodopsin ChroME-ST and capitalize on their overlapping two-photon absorption spectra to simultaneously evoke and image action potentials using a single laser source. We also demonstrate in vivo scanless two-photon imaging of multiple cells simultaneously up to 250 µm deep in the barrel cortex of head-fixed, anaesthetised mice.


Conflict of interest statement

The authors declare no competing interests.

Figures

Fig. 1
Fig. 1. Characterisation of the optical setup developed for scanless two-photon voltage imaging.
a Schematic diagram of a typical optical setup used to perform scanless 2P voltage imaging (refer also to Supplementary Fig. 1). High repetition rate (920 or 940 nm) sources delivering nJ pulses at 80 MHz and fixed wavelength (1030 nm) low repetition rate sources delivering µJ pulses (at variable repetition rates) were used for scanless 2P voltage imaging. The black arrows indicate an adjustable mirror used to direct light from either ultrafast source into the microscope. The light sculpting paths were designed to generate Temporally Focused (TF), Generalised Phase Contrast (GPC), Gaussian and holographic (CGH) spots with lateral FWHM (Full Width Half Maximum) diameters between 12 and 17 µm. The essential concepts of each light sculpting approach are depicted in the inset below the schematic. Diffraction gratings were positioned in conjugate image planes for temporal focusing, as indicated by the white dashed lines. Temporal focusing was used to maintain axial resolution in spite of the extended lateral spot size. 2P excited fluorescence was collected using a widefield detection axis equipped with an sCMOS camera capable of kilohertz acquisition rates. Patch-clamp electrophysiology apparatus was installed on each microscope (“Methods” section). OL objective lens, DM dichroic mirror, TL tube lens, sCMOS scientific complementary metal–oxide–semiconductor, SLM spatial light modulator, PCF phase contrast filter. b Lateral (XY) and axial (Z) cross-sections of representative 2P excited fluorescence generated in a thin spin-coated rhodamine layer with 12 µm TF-GPC, TF-Gaussian and TF-CGH spots, as indicated. Scale bars represent 10 µm. c Lateral and axial profiles of 2P excited fluorescence generated with each excitation modality, and the corresponding system response. Exc. refers to the average excitation axial profile for all modalities and PSF to the effective Point Spread Function of scanless 2P microscopy, as measured using 1 µm fluorescence microspheres excited at 940 nm with TF-GPC. Source data are provided as a Source Data file.
Fig. 2
Fig. 2. In vitro electrophysiological characterisation of scanless two-photon voltage imaging in cultured CHO cells.
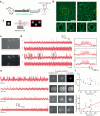
a (i) Schematic representation of the protocol used to prepare JEDI-2P-Kv expressing CHO cells (“Methods” section). (ii) Scanless 2P voltage imaging was performed using temporally focused (TF) GPC (Generalized Phase Contrast), Gaussian or holographic (CGH) spots. (iii) Transmitted light image of a patched CHO cell (left) and representative confocal image of a different JEDI-2P-Kv expressing CHO cell (right) (n = 41 cells, 19 independent transfections). Scale bars represent 10 µm. b Data from protocol 1 (“Methods” section, Supplementary Table 5) used to assess the performance of each illumination modality (100 Hz acquisition rate, power density 0.88 mW µm−2). The electrophysiological (ephys) command voltage is plotted in black with relevant holding potentials indicated. The red bar represents the illumination epoch. (ii–iv) Average fluorescence responses acquired using each modality. Results from single trials from independent cells are also plotted in grey. Responses are reported as (-%∆F/F0 (n = 9 (Gauss), 15 (CGH), 17 (GPC) cells; from 2 (Gauss, CGH) or 3 (GPC) independent transfections). c Representative imaging data acquired during scanless 2P voltage imaging experiments on JEDI-2P-Kv expressing CHO cells at 100 Hz, (i) and 1 kHz, (ii) (power densities 0.88 and 1.11 mW µm−2 respectively). Left: single frames, middle: temporal average of all frames, right: corresponding pixel weights (all normalised) used to generate the final fluorescence traces (“Methods”). (d-e) Violin plots (shaded) summarising the performance: -%∆F/F0 (d) and SNR (e), of each scanless 2P voltage imaging modality at different illumination power densities (0.66–1.55 mW µm−2, n = 8 (Gauss), 13 (CGH), 12 (GPC) cells, 2 independent transfections per modality). Results presented in d and e were acquired using protocol 2 (“Methods” section, Supplementary Table 5). In every case, a coloured point represents a single measurement from an individual cell, a black cross is located at the population mean and the coloured bars (adjacent) depict the interquartile range. f (i) Electrophysiological command voltage for protocol 3 (“Methods” section and Supplementary Table 5) plotted in black with relevant holding potentials indicated. The red bar represents the illumination epoch. (ii–iv) Corresponding scanless 2P imaging data acquired using each parallel illumination modality. Results from single trials from independent cells are also plotted in grey (power density: 1.33 mW µm−2, n = 8 (Gauss), 11 (CGH, GPC) cells, 2 independent transfections per modality). Source data are provided as a Source Data file.
Fig. 3
Fig. 3. Scanless two-photon voltage imaging of neural activity in hippocampal organotypic slices.
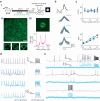
a (i) Schematic representation of the protocol used to prepare JEDI-2P-Kv expressing hippocampal organotypic slices (see “Methods” section and Supplementary Table 1). (ii) Upper: confocal image of a representative organotypic slice bulk-infected with JEDI-2P-Kv. Scale bar represents 50 µm. Lower: confocal images of single representative JEDI-2P-Kv expressing neurons in the dentate gyrus (n = 29 slices from 16 independent slice cultures). (iii) Upper: representative image acquired with 2P-TF-GPC (1 kHz acquisition rate, average temporal projection), Lower: line-profile through the image (indicated by the magenta dashed line). b Electrically induced and recorded APs (upper, black) and optically recorded (lower) were resolved in single trials (plotted in grey) using 2P voltage imaging at different acquisition rates. The average traces from different acquisition rates (500 Hz, 750 Hz and 1 kHz, power density: 1.1 mW µm−2) are plotted in different shades of blue. c −%∆F/F0 and SNR plotted as a function of power density in different shades of blue for different acquisition rates. Error bars represent the standard error of measurements across all cells (n = 4−6 neurons, refer to Table 1 in “Methods” section for precise values of n). Individual points represent the average value over 50 evoked APs for each individual cell. d Representative fluorescence responses recorded from an individual cell whilst 25 and 125 Hz spike trains were evoked and recorded electrically (labelled). Imaging data was acquired at three different rates (500 Hz, 750 Hz and 1 kHz, power density: 1.11 mW µm−2). Data from different acquisition rates is plotted in different shades of blue, and corresponding electrophysiological whole-cell patch-clamp recordings are plotted in grey (n = 2–5 neurons from 3 different slices, from 1 slice culture). e Simultaneous current-clamp (upper, black) and fluorescence recordings (lower, blue) of spontaneous activity in neurons in the dentate gyrus of hippocampal organotypic slices over a continuous 30 s recording period. Inset: zoomed in portion of the electrophysiological and fluorescence traces. The dashed light grey lines indicate the correspondence between APs in the electrophysiological and fluorescence traces (average spike train rate: 17 Hz, power density: 1.33 mW µm−2, 1 kHz acquisition rate). Source data are provided as a Source Data file.
Fig. 4
Fig. 4. Scanless two-photon voltage imaging of sub-threshold depolarisations in hippocampal organotypic slices.
Recording sub-threshold depolarisations in JEDI-2P-Kv expressing hippocampal organotypic slices using 2P-TF-GPC. a Command voltage steps used to change the membrane potential of patched neurons. b Average fluorescence traces recorded from neurons after 50 trials for different magnitudes of sub-threshold depolarisations ranging between 0 and 2.5 mV. Traces were recorded at an acquisition rate of 1 kHz and 1.1 mW µm−2. c Average -%∆F/F0 and (d) SNR of the fluorescence response to different sub-threshold changes of membrane potential plotted as a function of number of repeats. The 95% confidence interval is also plotted (shaded region). Sub-threshold depolarisations <2.5 mV cannot be reliably resolved in single trials using 2P-TF-GPC and JEDI-2P-Kv, however after 25 trials depolarisations greater than or equal to 1 mV can be resolved. Data was acquired from n = 6 neurons, from 2 slices from 1 slice culture (Refer to Supplementary Fig. 1 and Supplementary Tables 1 and 2). Source data are provided as a Source Data file.
Fig. 5
Fig. 5. Multi-target scanless two-photon voltage imaging using low repetition rate sources at 1030 nm.
a (i) Schematic representation of the protocol used to prepare JEDI-2P-Kv expressing hippocampal organotypic slices (see “Methods” section, Supplementary Table 2). (ii) Multiple cells were illuminated simultaneously by multiplexing a temporally focused (TF) Gaussian beam with a Spatial Light Modulator (SLM, “Methods”, Supplementary Table 2). All experiments were performed using 17 µm TF-Gaussian spots at 1030 nm (laser E, 500 kHz repetition rate, power densities: 0.03–0.06 mW µm−2). Data was acquired for 30 s at an acquisition rate of 500 Hz with camera A. b Simultaneous current-clamp (upper, black) and fluorescence recordings (lower, yellow) of electrically evoked activity in neurons from hippocampal organotypic slices (protocol 5, “Methods” and Supplementary Table 5). c Average (temporal) projection of data acquired during a representative multi-target scanless 2P voltage imaging experiment (grey lookup-table). The spot positions have been overlayed (yellow lookup-table) and numbered 1-16. The scale bar represents 20 µm. The patched neuron (cell 10) is indicated by the yellow box. Inset: single frame and average temporal projection of a zoomed portion of the dataset containing the patched cell. d Simultaneous current-clamp (upper, black) and fluorescence recordings (lower, yellow) of electrically evoked activity in neurons from hippocampal organotypic slices. Data acquired by illuminating the same patched cell plus fifteen randomly distributed positions (1 + 15) as shown in c. The number to the left of each trace indicates the index of the targeted cell as labelled in c. e (i) Precision, (ii) recall and (iii) F1 score of action potential detection plotted as a function of SNR threshold. The 95% confidence intervals are also plotted (shaded region). Refer to the “Methods” section for definitions of these terms. Simultaneously acquired whole-cell patch-clamp electrophysiology traces were used as ground-truth datasets. Of 380 electrically evoked action potentials, 96% were detected. The SNR threshold of 5, used throughout this manuscript, is indicated by the black dashed line (n = 15 neurons, from 3 different slices from 2 independent slice cultures). Source data are provided as a Source Data file.
Fig. 6
Fig. 6. Scanless two-photon voltage imaging in vivo.
a (i) Schematic representation of the protocol used to prepare mice expressing JEDI-2P-Kv for in vivo scanless 2P voltage imaging (see “Methods” section). (ii) Several neurons were illuminated simultaneously by generating multiple holographic spots using holography (CGH) (“Methods” section, Supplementary Table 1). All experiments were performed using 17 µm TF-CGH spots at 1030 nm (laser F, 500 kHz repetition rate, power densities: 0.02–0.07 mW µm−2). Data was acquired for 30 s at an acquisition rate of 500 Hz with camera A. b Upper: representative images of JEDI-2P-Kv expression in L2/3 of the barrel cortex at different scales (n = 4 mice). Yellow dashed box indicates the zoomed in region, shown on the right panel. Scale bars from left to right represent 50 µm and 15 µm respectively. Lower: confocal images of single representative JEDI-2P-Kv expressing neurons in L2/3 of the barrel cortex, taken from multiple mice (n = 4 mice). c Single frame and average (temporal) projection of data acquired during a representative in vivo multi-target scanless 2P voltage imaging experiment (power density: 0.02 mW µm−2, depth: 52 µm below the dura). Scale bar represents 20 µm. d Fluorescence traces from the cells identified in b, as numbered. Responses are reported as the fluorescence change (∆F), expressed as a percentage of the baseline fluorescence F0 (−%∆F/F0). Inset: zoomed in portion of the bursts of APs which have an average firing rate of 50 Hz. e Left: fluorescence traces from cells acquired from different experiments at different depths below the dura (80–240 µm, as indicated). Right: single frames, temporal projections and correlation images (see “Methods” section) are also provided for reference. f Characterisation of the -%∆F/F0 and correlation FWHM (see “Methods” section), plotted as a function of target depth below the cortical surface. Individual points (black) represent the average value for a single (responsive) target during a single experiment (n = 43 fields of view (30 independent) from 7 mice). A linear, least-squares, fit to the experimental data is displayed in red. Source data are provided as a Source Data file.
Fig. 7
Fig. 7. Fluorescence recordings of photo-evoked action potentials in hippocampal organotypic slices co-expressing JEDI-2P-Kv and ChroME-ST, using 2P-TF-CGH.
a Schematic overview of the experimental protocol. JEDI-2P-Kv expressing organotypic hippocampal slices were prepared as described (for more details, refer to Fig. 3 and “Methods” section). At p18, slices were transduced with AAV9.CaMKII.ChroME-ST.P2A.H2B.BFP. Experiments were performed between p21 and p28 using a 940 nm, 250 kHz repetition rate laser source. b Cross-sections of hippocampal organotypic slices co-expressing the genetically encoded voltage indicator JEDI-2P-Kv and the soma-targeted channelrhodopsin ChroME-ST in the dentate gyrus (n = 4 slices from 2 independent slice cultures). Channelrhodopsin-expressing cells were identified according to their nuclear-localised fluorescence (see “Methods” section). Scale bar represents 50 μm. c Simultaneous optical and electrophysiological recordings demonstrating that APs can be evoked and imaged using a single excitation spot (12 µm diameter, power density 0.02 mW µm−2 (2.5 mW per cell), 15 ms strobed illumination at 5 Hz). The red bar represents the illumination epoch. Asterisks indicate detected APs. d Zoom on simultaneous optical and electrophysiological recordings of one AP. e Probability of evoking and recording APs as a function of power density. AP probability is calculated as the number of APs evoked and detected at each power (power density: 0.01–0.09 mW μm−2). Data is plotted as mean ± SEM of recordings obtained for 33 repetitions. Probabilities greater than 100 % indicate that more than one action potential was detected in a given trial. f Simultaneous optogenetic activation of ChroME-ST and voltage imaging of JEDI-2P-Kv. 10 cells were targeted simultaneously using 2P-TF-CGH and imaged at 500 Hz. Here we show an example trace from one cell when the 10 cells were targeted sequentially (upper panel) or simultaneously (lower panel). In both the sequential and multi-cell acquisitions, APs were only evoked/recorded in the cells co-expressing JEDI-2P-Kv and ChroME-ST. All data was acquired using laser C (940 nm, 250 kHz repetition rate) and camera A. Source data are provided as a Source Data file.

Update of

Similar articles

Cited by

References

    1. Scanziani M, Hausser M. Electrophysiology in the age of light. Nature. 2009;461:930–939. doi: 10.1038/nature08540. - DOI - PubMed
    1. Emiliani V, et al. Optogenetics for light control of biological systems. Nat. Rev. Methods Prim. 2022;2:55. doi: 10.1038/s43586-022-00136-4. - DOI - PMC - PubMed
    1. Abdelfattah A, et al. Neurophotonic tools for microscopic measurements and manipulation: status report. Neurophotonics. 2022;9:1–86. doi: 10.1117/1.NPh.9.S1.013001. - DOI - PMC - PubMed
    1. Clapham DE. Calcium signaling. Cell. 2007;131:1047–1058. doi: 10.1016/j.cell.2007.11.028. - DOI - PubMed
    1. Grienberger C, Konnerth A. Imaging calcium in neurons. Neuron. 2012;73:862–885. doi: 10.1016/j.neuron.2012.02.011. - DOI - PubMed