. 2024 Jun 14;15(1):5081.
doi: 10.1038/s41467-024-49377-9.

Hydrogen peroxide is required for light-induced stomatal opening across different plant species

Affiliations

Hydrogen peroxide is required for light-induced stomatal opening across different plant species

Wen Shi et al. Nat Commun. .

Abstract

Stomatal movement is vital for plants to exchange gases and adaption to terrestrial habitats, which is regulated by environmental and phytohormonal signals. Here, we demonstrate that hydrogen peroxide (H2O2) is required for light-induced stomatal opening. H2O2 accumulates specifically in guard cells even when plants are under unstressed conditions. Reducing H2O2 content through chemical treatments or genetic manipulations results in impaired stomatal opening in response to light. This phenomenon is observed across different plant species, including lycopodium, fern, and monocotyledonous wheat. Additionally, we show that H2O2 induces the nuclear localization of KIN10 protein, the catalytic subunit of plant energy sensor SnRK1. The nuclear-localized KIN10 interacts with and phosphorylates the bZIP transcription factor bZIP30, leading to the formation of a heterodimer between bZIP30 and BRASSINAZOLE-RESISTANT1 (BZR1), the master regulator of brassinosteroid signaling. This heterodimer complex activates the expression of amylase, which enables guard cell starch degradation and promotes stomatal opening. Overall, these findings suggest that H2O2 plays a critical role in light-induced stomatal opening across different plant species.


Conflict of interest statement

The authors declare no competing interests.

Figures

Fig. 1
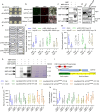
Fig. 1. Specific accumulation of H2O2 in guard cells under normal conditions is required for light-induced stomatal opening in Arabidopsis.
af Measurement of H2O2 in the epidermal cells on rosette leaves of 4-weeks-old Col-0 plants using H2DCFDA staining (a, b), BES-H2O2-Ac staining (c, d) and HyPer fluorescent (e, f). Col-0 or pHyPer transgenic line were grown on 1/2 MS medium under a 12 h light/12 h dark photoperiod with a light intensity of 100 μM m–2 s–1 for 28 days. The intensities of H2DCFDA, BES-H2O2-Ac, and HyPer fluorescent signals were analyzed using at least 100 guard cells from 10 different plants with ImageJ software. “PC” in confocal images represents pavement cell, “GC” represents guard cell. gl Measurement of H2O2 content using BES-H2O2-Ac staining (g, h) quantification of stomatal apertures (i, j) and starch granules (k, l) in guard cells, qRT-PCR analysis of the expression of BAM1 (m) on rosette leaves of Col-0, cat2, p35S::CAT2-myc, rbohD rbohF plants. Plants were grown on 1/2 MS medium under a 12 h light/12 h dark photoperiod with the 100 μM m–2 s–1 light intensity for 28 days. BES-H2O2-Ac signaling intensities, starch granules area, and the ratio of stomatal aperture width to length in at least 100 guard cells from at least 4 different plants were analyzed using ImageJ software. EoN means the end of night, and Light 1 h means the white light illumination for 1 hour after the end of night. The solid lines of violin plots represent the median; the dashed lines represent the first or third quartile. Error bars of (m) indicate standard deviation (S.D.). Scale bars in the pictures of stomata represent 20 μm. Asterisk and Different letters above the bars indicate statistically significant differences between samples. One-way ANOVA analysis followed by uncorrected Fisher’s LSD multiple comparisons test (p < 0.05) were applied for H2O2 measurement of different plants; Two-way ANOVA analysis followed by Tukey’s multiple comparisons test (p < 0.05) was applied for quantification of stomatal apertures and starch granules; Student’s t test was applied for cell type H2O2 content measurement (****p < 0.0001) and gene expression analysis (p < 0.05).
Fig. 2
Fig. 2. KIN10 plays a crucial role for H2O2 mediated promotion of light-induced stomatal opening.
ac Quantification of stomatal apertures (a, b) and guard cell starch granules (c) in the rosette leaves of Col-0, kin10, and p35S::KIN10-myc plants. df Quantification of stomatal apertures (d, e) and guard cell starch granules (f) in rosette leaves of Col-0, kin10, cat2, and kin10 cat2 plants. All plants were grown on 1/2 MS medium under a 12 h light/12 h dark photoperiod with a 100 μM m–2 s–1 light intensity for 28 days. The starch granules area and the ratio of stomatal aperture width to length from more than 100 guard cells of at least 4 different plants were measured using ImageJ software. Scale bars in the pictures of stomatal images represent 20 μm. EoN means the end of night, and Light 1 h means the white light illumination for 1 hour after the end of night. The solid lines of violin plots represent median, the dashed lines represent first or third quartile. Different letters above the bars indicate statistically significant differences between samples (Two-way ANOVA analysis followed by Tukey’s multiple comparisons test, p < 0.05).
Fig. 3
Fig. 3. KIN10 interacts with and phosphorylates bZIP30.
ad Y2H (a) ratiometric BiFc (b), In vitro pull-down (c), and CoIP (d) assays show the interaction between KIN10 and bZIP30. BD-KIN10 was used as the bait for Y2H. Co-transforming BD-KIN10 with an empty-AD vector serves as the negative control. Scale bars in confocal images of ratiometric BiFc represent 20 μm. In pull-down assay, recombinant MBP and MBP-KIN10 proteins were incubated with GST-bZIP30 bound to glutathione agarose beads. Immunoblot assay was performed with anti-MBP antibody to detect the proteins bound to GST-bZIP30. Protein extract from 10-day-old seedlings of pbZIP30::bZIP30-YFP and Col-0 plants were used for CoIP assay. bZIP30-YFP was precipitated using GFP-Trap agarose beads. The immunoblots were probed with anti-GFP and anti-KIN10 antibodies. eg Quantification of stomatal apertures (e, f) and guard cell starch granules (g) in the rosette leaves of Col-0, bzip30, p35S::KIN10-myc and bzip30 p35S::KIN10-myc plants. Seedlings of these plants were grown on 1/2 MS medium under a 12 h light/12 h dark photoperiod with a 100 μM m–2 s–1 light intensity for 28 days. h KIN10 phosphorylates bZIP30 in vitro. Left: gel image with ATP-γ-p32-labeled proteins. Right: gel image stained with coomassie brilliant blue. i Schematic representation of the bZIP30 protein indicating the phosphorylation sites by KIN10. The residues marked in red color indicates the residues phosphorylated by KIN10. j, k Quantification of guard cell starch granules (j) and stomatal apertures (k) in the cotyledons of Col-0, bzip30, and different bZIP30-complemented transgenic plants. Seedlings of these plants were grown under the same conditions for 10 days. The starch granules area and the ratio of stomatal aperture width to length from more than 100 guard cells in at least 12 different plants were measured using ImageJ software. EoN means the end of night, and Light 1 h means the white light illumination for 1 hour after the end of night. The solid lines of violin plots represent the median; the dashed lines represent the first or third quartile. Different letters above the bars indicate statistically significant differences between samples (Two-way ANOVA analysis followed by Tukey’s multiple comparisons test, p < 0.05).
Fig. 4
Fig. 4. bZIP30 induces BAM1 and AMY3 expression.
a, b qRT-PCR analysis of the expression of BAM1 and AMY3 in Col-0, kin10 and bzip30 plants. Plants were grown on 1/2 MS medium under a 12 h light/12 h dark photoperiod with a 100 μM m–2 s–1 light intensity for 28 days. Error bars indicate standard deviation (S.D.). Asterisks between bars indicate statistically significant difference between samples (Two-way ANOVA analysis followed by uncorrected Fisher’s LSD multiple comparisons test, *p < 0.05, **p < 0.01, ***p < 0.001, and ****p < 0.0001). c Quantitative ChIP-PCR showed the direct binding of bZIP30 to BAM1 promoter. Seedlings of p35S::YFP and pbZIP30::bZIP30-YFP were used to performed ChIP assays. The levels of bZIP30 binding were calculated as the ratio between pbZIP30::bZIP30-YFP and p35S::YFP, and then normalized to that of control gene PP2A. Error bars indicate S.D. Asterisks between bars indicate statistically significant differences between samples (Two-way ANOVA analysis followed by uncorrected Fisher’s LSD multiple comparisons test, p < 0.05). d Transient assays showed that the expression of BAM1 was induced by KIN10-YFP, bZIP30-YFP and bZIP30S18/T22D-YFP, but not by bZIP30S18/T22A-YFP. The promoter of BAM1 and fused to the luciferase reporter gene were co-transfected with KIN10-YFP, bZIP30-YFP, bZIP30S18/T22A-YFP or bZIP30S18/T22D-YFP into Arabidopsis mesophyll protoplasts. The luciferase activities were normalized with Renilla luciferase. Error bars represent S.D. Different letters above the bars indicate statistically significant differences between samples (One-way ANOVA analysis followed by uncorrected Fisher’s LSD multiple comparisons test, p < 0.05). e, f rBiFC confocal images showed that KIN10-dependent phosphorylation promotes the homodimerization of bZIP30 but not the interaction of bZIP30 with phospho-mutated bZIP30 in plants. The construct of p35S::bZIP30-nYFP-p35S::RFP-p35S::bZIP30-cYFP or p35S::bZIP30-nYFP-p35S::RFP-p35S:: bZIP30S18/T22A-cYFP is co-transferred with or without p35S::KIN10-CFP in tobacco leaves. The fluorescent signals of YFP (BiFC) and RFP (reference) in the nucleus of tobacco epidermal cells were determined using ImageJ software. At least 50 interaction signals in different epidermal cells were analyzed. The solid lines of violin plots represent median, the dashed lines represent first or third quartile. Different letters above the bars indicated statistically significant differences between the samples (Two-way ANOVA analysis followed by Tukey’s multiple comparisons test, p < 0.05. Scale bar, 10 μm).
Fig. 5
Fig. 5. The KIN10-bZIP30 module integrates BR and H2O2 signals to promote light-induced stomatal opening.
a, b Quantification of guard cell starch granules (a) and stomatal apertures (b) in Col-0, kin10, and bzip30 plants with or without BL treatment. Seedlings were grown on 1/2 MS medium under a 12 h light/12 h dark photoperiod with a 100 μM m–2 s–1 light intensity for 10 days, transferred to the medium with or without 100 nM BL to grow for 2 h before EoN. The starch granules area and stomatal aperture from more than 100 guard cells in at least 12 different plants were measured. EoN means the end of night, and Light 1 h means the white light illumination for 1 hour after EoN. c, d rBiFC confocal images showed that H2O2 enhanced the interaction between BZR1 and bZIP30, which is required for both BZR1 oxidation and bZIP30 phosphorylation. The construct of p35S::BZR1-nYFP-p35S::RFP-p35S::bZIP30-cYFP, p35S::BZR1C63S-nYFP-p35S::RFP-p35S::bZIP30-cYFP, and p35S::BZR1-nYFP-p35S::RFP-p35S::bZIP30S18/T22A-cYFP is transferred in tobacco leaves, and treated with or without 1 mM H2O2 for 3 h before observation. The ratio of fluorescent signals of YFP (BiFC) and RFP (reference) was calculated. At least 50 interaction signals in different epidermal cells were analyzed. Scale bars represents 10 μm. eh In vitro pull-down assays showed that H2O2 enhances the interaction between BZR1 and bZIP30. Recombinant MBP, MBP-BZR1 and MBP-BZR1C63S proteins were incubated with GST-bZIP30 bound to glutathione agarose beads (e, f). Recombinant MBP, MBP-bZIP30, and MBP-bZIP30S18/T22A proteins were incubated with GST-BZR1 bound to glutathione agarose beads (g, h). All these incubations were performed with or without 1 mM H2O2 for 3 hours. Immunoblot assay was performed with anti-MBP antibody to detect the proteins bound to GST-bZIP30 or GST-BZR1. Error bars represent the standard deviation. The solid lines of violin plots represent median, the dashed lines represent the first or third quartile. Different letters above the bars indicate statistically significant differences between samples. Two-way ANOVA analysis followed by Tukey’s multiple comparisons test (p < 0.05) was applied for a, b, and d. One-way ANOVA analysis followed by Uncorrected Fisher’s LSD multiple comparisons test (p < 0.05) was applied for f and h.
Fig. 6
Fig. 6. H2O2 is required for light-induced stomatal opening across different plant species.
a Staining of H2O2 in the epidermal cells of Arabidopsis thaliana (dicotyledonous), Triticum aestivum (monocotyledonous), Marsilea quadrifolia (ferns) and Selaginella doederleinii (lycophytes) using H2DCFDA. The stomata and surrounded subsidiary cells in abaxial epidermis of leaves in different plant species are highlighted by blue and green color, respectively. Scale bars in confocal images for H2O2 staining represent 20 μm. be Quantification of stomatal apertures in the leaves of Triticum aestivum (b, d) and Marsilea quadrifolia (c, e) with or without KI or DDC treatment. The leaves of Triticum aestivum and Marsilea quadrifolia were pre-incubated in the presence or absence of 1 mM KI or 1 mM DDC in the dark for 2 h before illumination with white light (100 µmol m–2 s–1) and for 3 h and 1 h, respectively. The width of stomata of at least 50 guard cells from 8 different plants were measured using ImageJ software. The solid lines of violin plots represent median, the dashed lines represent first or third quartile. Different letters above the bars indicate statistically significant differences between samples (Two-way ANOVA analysis followed by Tukey’s multiple comparisons test, p < 0.05). f A proposed working model for the promoting effects of H2O2 for light-induced stomatal opening. H2O2 enrichment in guard cells of plant grown under normal growth conditions promotes the localization of KIN10 in nucleus, in which it interacts with and phosphorylates bZIP30 transcription factor. BR induces the dephosphorylation and nuclear localization of BZR1. Guard cell enriched H2O2 induces the oxidation of BZR1 at cysteine 63. The phosphorylated bZIP30 by KIN10 and oxidation-modified BZR1 by H2O2 are more likely to form a heterodimer to induce BAM1 and AMY3 expression, thereby promoting guard cell starch degradation and stomatal opening.

Similar articles

Cited by

References

    1. Clark JW, et al. The origin and evolution of stomata. Curr. Biol. 2022;32:539–553. doi: 10.1016/j.cub.2022.04.040. - DOI - PubMed
    1. Sussmilch FC, Schultz J, Hedrich R, Roelfsema MRG. Acquiring control: the evolution of stomatal signalling pathways. Trends Plant Sci. 2019;24:342–351. doi: 10.1016/j.tplants.2019.01.002. - DOI - PubMed
    1. Lawson T, Matthews J. Guard cell metabolism and stomatal function. Annu. Rev. Plant Biol. 2020;71:273–302. doi: 10.1146/annurev-arplant-050718-100251. - DOI - PubMed
    1. Shimazaki K, Doi M, Assmann SM, Kinoshita T. Light regulation of stomatal movement. Annu. Rev. Plant Biol. 2007;58:219–247. doi: 10.1146/annurev.arplant.57.032905.105434. - DOI - PubMed
    1. Assmann SM, Simoncini L, Schroeder JI. Blue light activates electrogenic ion pumping in guard cell protoplasts of Vicia faba. Nature. 1985;318:285–287. doi: 10.1038/318285a0. - DOI

MeSH terms