. 2024 Jun 14;15(1):5111.
doi: 10.1038/s41467-024-49408-5.

Cardiac myosin binding protein-C phosphorylation as a function of multiple protein kinase and phosphatase activities

Affiliations

Cardiac myosin binding protein-C phosphorylation as a function of multiple protein kinase and phosphatase activities

Thomas Kampourakis et al. Nat Commun. .

Abstract

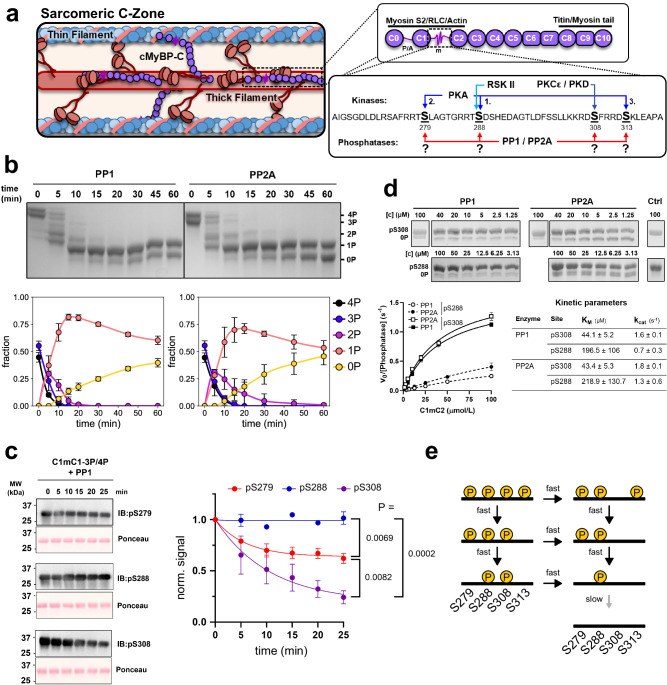
Phosphorylation of cardiac myosin binding protein-C (cMyBP-C) is a determinant of cardiac myofilament function. Although cMyBP-C phosphorylation by various protein kinases has been extensively studied, the influence of protein phosphatases on cMyBP-C's multiple phosphorylation sites has remained largely obscure. Here we provide a detailed biochemical characterization of cMyBP-C dephosphorylation by protein phosphatases 1 and 2 A (PP1 and PP2A), and develop an integrated kinetic model for cMyBP-C phosphorylation using data for both PP1, PP2A and various protein kinases known to phosphorylate cMyBP-C. We find strong site-specificity and a hierarchical mechanism for both phosphatases, proceeding in the opposite direction of sequential phosphorylation by potein kinase A. The model is consistent with published data from human patients and predicts complex non-linear cMyBP-C phosphorylation patterns that are validated experimentally. Our results suggest non-redundant roles for PP1 and PP2A under both physiological and heart failure conditions, and emphasize the importance of phosphatases for cMyBP-C regulation.


Conflict of interest statement

The authors declare no competing interests.

Figures

Fig. 1
Fig. 1. cMyBP-C dephosphorylation by PP1 and PP2A.
a left and top right: cMyBP-C is located in the C-zone of the sarcomere. It is composed of eight Ig-, three FnIII-domains, a P/A linker region between C0 and C1, and the semi-structured m-motif between domains C1 and C2, which features multiple phosphorylation sites. The C-terminus is integrated into the thick filament, whereas the N-terminus can bind both to the thin filament, stabilizing the ON-state, and to the thick filament, stabilizing its OFF-state. The phosphorylation states of the m-motif between cMyBP-C C1 and C2 regulate these interactions in a site-specific manner. Bottom right: cMyBP-C can be phosphorylated by multiple kinases, including PKA, CaMKII (not shown), PKCε, and PKD, in a site-specific manner. While both PP1 and PP2A have been reported to dephosphorylate cMyBP-C, the reaction mechanism, site-specificity, and kinetics of these reactions are unknown. b 20 μmol/L 3P/4P-C1mC2 (~50% pS279, pS288, pS308, and ~50% pS279, pS288, pS308, pS313) were dephoshorylated by 100 nmol/L PP1 or PP2A for 60 min. Samples were taken at different time points and analyzed by PhosTagTM -SDS-PAGE. Mean ± SD from n = 3 experiments. c left: Immunoblot analysis of 3P/4P-C1mC2 dephosphorylation by PP1 (10 μM 3P/4P-C1mC2, 50 nmol/L PP1) using pS279-, pS288- and pS308-cMyBP-C specific antibodies. Right: quantified mean ± SEM from n = 3 experiments analyzed via 1-way ANOVA followed by Tukey’s multiple comparison test. d Michaelis–Menten kinetics for dephosphorylation of pS288- and pS308-C1mC2 by PP1 and PP2A. After the addition of phosphatase (100 nmol/L), reactions were quenched after 2 min (pS308) or 10 min (pS288), and the amount of dephosphorylated product quantified via PhosTagTM -SDS-PAGE. Datapoints are mean ± SEM from n = 3 experiments. See Methods for details. e Proposed reaction scheme for dephosphorylation of cMyBP-C by PP1 and PP2A. pS279, pS288, and pS313 sites are dephosphorylated sequentially in the reverse order in which they are added by PKA, whereas pS308 can independently be dephosphorylated at any point.
Fig. 2
Fig. 2. A quantitative model for cMyBP-C phosphostate regulation.
a New nomenclature for cMyBP-C-phosphorylation sites. *Phosphorylation in humans not confirmed. b Reaction scheme of proposed cMyBP-C-phosphorylation state model integrating the activities of multiple kinases and phosphatases. c Experimental dephosphorylation time course data and model fits showing good agreement for 3P/4P-cMyBP-C dephosphorylation and systematic discrepancies for 2P-cMyBP-C dephosphorylation (here: αδ). Thin lines are model fits (n = 14 parameter sets), dots are the experimental data (mean ± SD from n = 3 (left)/n = 2 (right)). d Hypothetical mechanisms based on allosteric activation of phosphatases (model 3) or structural transitions (model 4) in cMyBP-C to explain the abrupt decline in 1P dephosphorylation rate after 2P-cMyBP-C depletion. e Top four panels: improved model fits the same experimental data as in c following implementation of the allostery (n = 24 parameter sets) or structural transition (n = 25 parameter sets) hypotheses into the model. Bottom panel: model statistics of model 1 (Michaelis-Menten–kinetics only), 3, and 4 for PP1 data. Model performance according to the Akaike information criterion (Krude-Wallis, 1-way ANOVA and Mann-Whitney U tests corrected for multiple comparisons with the Benjamini-Hochberg procedure with a false discovery rate of 0.05). f Top: binding of unphosphorylated (n = 3) and thiophosphorylated (n = 4) C1mC2 to PP1 as measured by Microscale Thermophoresis (mean ± SEM). Inset: Kd values compared via Welch’s t-test. Bottom: pNPP dephosphorylation kinetics of PP1 in the absence or presence of unphosphorylated or thiophosphorylated C1mC2 (n = 3, mean ± SEM). g Peak SYPRO-signal at 600 nm of different phospho-forms of C1mC2 normalized to the average signal across each replicate (n = 4). Comparisons to the signal of the unphosphorylated C1mC2 were performed using an unpaired t-test and corrected for multiple comparisons with the Benjamini-Hochberg procedure with a false discovery rate of 0.05.
Fig. 3
Fig. 3. cMyBP-C phosphorylation in presence of kinases and phosphatases.
a Predicted steady-state cMyBP-C phosphorylation response to increasing PKA concentrations and at different concentrations of PP1 (each slice corresponds to a different, fixed phosphatase concentration). 0P: yellow, 1P: orange, 2P: pink, 3P: purple. Mean ± SD of simulations for n = 35 parameter sets. b left: experimental steady-state C1mC2 phosphorylation levels in the presence of 0.5 μmol/L PP1 and increasing concentrations of PKA analyzed by PhosTagTM-SDS-PAGE. Right: Means ± SD for n = 3 repeats. The dashed line indicates the average fit of lumped 3P + 4P data using the Hill-equations. Inset: fitted Hill-coefficients. c Predicted steady-state cMyBP-C phosphorylation levels determined like in A but in the presence of additional 100 nmol/L RSK2 (left) or PKC (right). d Predicted steady-state cMyBP-C phosphorylation levels determined like in A but with PP2A and in the presence of additional 100 nmol/L PKC. Mean ± SD of simulations for n = 35 parameter sets. e Steady-state dose-responses of lumped cMyBP-C αβγ + αβγδ states to increasing PKA concentrations at a phosphatase, RSK2, or PKC concentration of 100 nmol/L fitted to a Hill-equation to quantify the response. Continuous line shows the fitted average, dots are the individual values for each of the n = 35 parameter sets. f Extracted Hill coefficient parameters of the predicted PKA-dependent steady-state dose-responses of αβγ + αβγδ cMyBP-C for PP1 and PP2A in the presence or absence of PKC or RSK2. Mean ± SD of simulations for n = 35 parameter sets. g Specifity ratios of different phosphorylation-dephosphorylation cycles quantifying the influence of the δ-site on γ-site phosphorylation in the presence of PP1 or PP2A. Dots show individual values for each of the n = 35 parameter sets. Comparisons were performed with the Mann–Whitney U test. h Control simulation with PP1 parameters for reactions αβγδ→αβδ and αβγδ→αβγ exchanged with those of PP2A. Mean ± SD of simulations for n = 35 parameter sets.
Fig. 4
Fig. 4. cMyBP-C phosphorylation states during heart failure (HF).
a The model was tested for consistency with experimental data on cMyBP-C basal phosphorylation states in hearts from healthy donors or HF patients reported in Copeland et al. 2010 (CL) by fitting the model using only the enzyme concentrations as free parameters (fit). Additionally, the distribution of cMyBP-C phosphorylation states during HF was predicted by starting with the enzyme concentrations fitted to the donor (CL) data followed by a decrease in [PKA] by 50% and a 2-fold increase of PP1 and PP2A concentrations consistent with previous reports on β-adrenergic receptor downregulation and phosphatase activity during HF. b Comparison of the fitted enzyme concentrations underlying donor (fit) and HF (fit) data from a and calculated PKA/phosphatasetot ratios. c Maximally achievable fraction for each cMyBP-C phosphorylation state under various conditions. For each phosphorylation state, algorithmic optimization was used to find the enzyme vector [PKA, PKC, RSK2, PP1, PP2A] (within a physiological range) that maximizes the phosphorylation state under consideration. To probe the effect of perturbing other enzymes during HF, PKC and RSK2 concentrations were further restricted and PP1/PP2A ratio was either allowed to vary freely (crimson), or phosphatases were fixed to PP2A/PPasetot = 1 (purple) or PP1/PPasetot = 1 (dark purple). Each fitting or optimization run has been performed with all of the n = 35 parameter sets. Values represent mean ± SEM and comparisons in (b, c) were done via Mann–Whitney U test corrected for multiple comparisons with the Benjamini–Hochberg procedure with a false discovery rate of 0.05.

Similar articles

Cited by

References

    1. Kampourakis T, Yan Z, Gautel M, Sun Y-B, Irving M. Myosin binding protein-C activates thin filaments and inhibits thick filaments in heart muscle cells. Proc. Natl Acad. Sci. USA. 2014;111:18763–18768. doi: 10.1073/pnas.1413922112. - DOI - PMC - PubMed
    1. Pfuhl M, Gautel M. Structure, interactions and function of the N-terminus of cardiac myosin binding protein C (MyBP-C): who does what, with what, and to whom? J. Muscle Res. Cell Motil. 2012;33:83–94. doi: 10.1007/s10974-012-9291-z. - DOI - PubMed
    1. Belknap B, Harris SP, White HD. Modulation of thin filament activation of myosin ATP hydrolysis by N-terminal domains of cardiac myosin binding protein-C. Biochemistry. 2014;53:6717–6724. doi: 10.1021/bi500787f. - DOI - PMC - PubMed
    1. Kensler RW, Craig R, Moss RL. Phosphorylation of cardiac myosin binding protein C releases myosin heads from the surface of cardiac thick filaments. Proc. Natl Acad. Sci. USA. 2017;114:E1355–E1364. doi: 10.1073/pnas.1614020114. - DOI - PMC - PubMed
    1. Mun JY, et al. Myosin-binding protein C displaces tropomyosin to activate cardiac thin filaments and governs their speed by an independent mechanism. Proc. Natl Acad. Sci. USA. 2014;111:2170–2175. doi: 10.1073/pnas.1316001111. - DOI - PMC - PubMed

LinkOut - more resources