. 2024 Jun 14;15(1):5102.
doi: 10.1038/s41467-024-49425-4.

The effector-triggered immunity landscape of tomato against Pseudomonas syringae

Affiliations

The effector-triggered immunity landscape of tomato against Pseudomonas syringae

Fabien Lonjon et al. Nat Commun. .

Abstract

Tomato (Solanum lycopersicum) is one of the world's most important food crops, and as such, its production needs to be protected from infectious diseases that can significantly reduce yield and quality. Here, we survey the effector-triggered immunity (ETI) landscape of tomato against the bacterial pathogen Pseudomonas syringae. We perform comprehensive ETI screens in five cultivated tomato varieties and two wild relatives, as well as an immunodiversity screen on a collection of 149 tomato varieties that includes both wild and cultivated varieties. The screens reveal a tomato ETI landscape that is more limited than what was previously found in the model plant Arabidopsis thaliana. We also demonstrate that ETI eliciting effectors can protect tomato against P. syringae infection when the effector is delivered by a non-virulent strain either prior to or simultaneously with a virulent strain. Overall, our findings provide a snapshot of the ETI landscape of tomatoes and demonstrate that ETI can be used as a biocontrol treatment to protect crop plants.


Conflict of interest statement

The authors declare no competing interests.

Figures

Fig. 1
Fig. 1. Tomato ETI response of P. syringae alleles that elicit ETI on A. thaliana.
Growth of PtoDC3000 strains carrying one of 21 type III effectors known to elicit ETI on A. thaliana Col-0,. Growth data was normalized based on the growth of the virulent control PtoDC3000::Empty Vector (EV). PtoDC3000::HopAB1n served as a positive control for ETI elicitation. The green boxes indicate effectors that caused a significant reduction in bacterial growth compared to the EV (ANOVA post-hoc Tukey-test [2-tailed], P < 0.05). The box plots represent pooled data from four (HopBA1a, HopZ1a, HopAR1h and HopAA1q) or three independent experiments, each with six to 12 replicates (n = 30 for HopBA1a, HopZ1a and HopAR1h, n = 24 for HopAA1q, n = 18 for the rest of effectors). Error bars representing SEM. The dots show individual values, while the boxes display the first quartile, median, and third quartile, with whiskers extending to the smallest and largest values. Data represent the normalized results of twelve experiments. The minimum growth observed for the EV strain was 6.72 log CFU/cm2, the maximum was 7.32 log CFU/cm2, with an average of 7.12 log CFU/cm2. For normalization within a single experiment, the growth of a particular replicate was divided by the average growth of the empty vector strain within that specific experiment.
Fig. 2
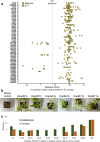
Fig. 2. The ETI landscape of P. syringae in tomato var. Glamour.
a Disease scores of PtoDC3000 carrying one of 402 expressed PsyTEC effector alleles were determined after spray inoculation on tomato plants. Disease scores were determined from the decline of green plant tissues throughout the experiment normalized to the negative control (PtoDC3000::EV, 100% decline in green) and positive control (ETI-eliciting allele PtoDC3000::HopAB1n, 0% decline in green). A cutoff of 40% (dashed line) was used to distinguish ETI-elicitors from non-ETI-elicitors. Yellow dots indicate alleles that do not elicit ETI, while green dots are alleles that elicit ETI. Each dot represents the average of at least two replicates (3–4 plants per replicate). Raw data are presented in Supplementary Data 1 and Supplementary Fig. 1. b Representative pictures of tomato Glamour plants sprayed with PtoDC3000 expressing a representative allele of the six ETI-eliciting effector families or the empty vector. Pictures were taken 7 days post-inoculation and are from different experiments. c Distribution of disease scores (% green decline values) from the tomato var. Glamour PsyTEC screen (this study) (orange bars) and of the disease score values from the A. thaliana Col-0 PsyTEC screen (green bars). The y-axis represents the number of effectors in each category when screened for ETI on the corresponding plant species and is presented as a log scale.
Fig. 3
Fig. 3. The ETI landscape of P.syringae in wild tomatoes.
a Disease phenotypes of S. arcanum and S. pimpinellifolium plants after spraying with the PtoDC3000ΔavrPtoΔhopAB1expressing alleles of the five newly identified ETI-eliciting effector families and the empty vector (EV) disease and HopAB1n ETI controls. Symptoms pictured are 7 days post-inoculation. The pictures shown for the EV, HopAB1n, HopBJ1b, HopBC1b, and HopBF1 are from the same experiment. The pictures shown for HopAA1q come from a second experiment where appropriate EV and HopAB1n controls were also sprayed (see Supplementary Figs. 5 and 6). The pictures shown for HopAR1h come from a third experiment where appropriate EV and HopAB1n controls were also sprayed (see Supplementary Figs. 5 and 6). Disease scores of PtoDC3000ΔavrPtoΔhopAB1 carrying the 402 expressed PsyTEC effector alleles after spray inoculation on b S. arcanum and c S. pimpinellifolium. A cutoff of 40% (dashed line) was used to distinguish ETI-elicitors from non-ETI-elicitors. Yellow dots indicate alleles that do not elicit ETI; green dots are alleles that elicit ETI. Triangles indicate an ETI-elicitor in tomato var. Glamour. Each dot represents a pot of at least three plants.
Fig. 4
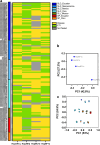
Fig. 4. Immunodiversity of wild and cultivated tomato.
a Heatmap representing the phenotypes of the 126 tomato lines classified by species and origin on the y-axis sprayed by four different ETI-elicitors expressed in PtoDC3000ΔavrPtoΔhopAB1 along the x-axis. Yellow indicates no ETI, and green represents ETI. A gray color indicates that the corresponding plant could not be tested because the relevant seed did not germinate. ETI was scored based on visual phenotypic data from Figure S8. SP stands for S. pimpinellifolium, SLC represents S. lycopersicum var. cerasiforme, and SLL denotes S. lycopersicum var. lycopersicum. b Principal component analysis (PCA) based on the ETI response profile of the four tested effectors. c PCA of the ETI response profiles of the tomato species as indicated in the legend of (a).
Fig. 5
Fig. 5. The P. syringae ETI load on tomato.
Predicted orthologs of ETI-elicitors from tomato var. Glamour carried by each of the 268 non-redundant P. syringae strains used to generate the PsyTEC collection were mapped onto a previously generated P. syringae core genome phylogeny with phylogroup designations. Effectors are color-coded as follows: darkest blue: effector present in multiple copies, dark blue: effector present in one copy, light blue: effector truncated, lightest blue: effector absent.
Fig. 6
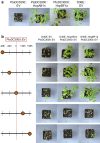
Fig. 6. ETI protects tomato plants against P. syringae co-infection.
a Control infections with PtoDC3000 carrying an empty vector (EV), PtoDC3000 expressing the ETI-elicitors HopAB1n or HopBF1a, and the effectorless polymutant PtoDC3000D36E (D36E) strain with the EV. Images were taken seven days post-PtoDC3000 inoculation. b Tomato var. Glamour plants were inoculated with the D36E strain at various time points relative to PtoDC3000 infection. The chart on the left indicates the relative infection time for each strain. PtoDC3000::EV was always infected at relative time 0, while D36E carrying either EV or an ETI eliciting effector was infected (orange circle) 48 or 24 h prior, simultaneously, or 24 and 48 h post-PtoDC3000::EV infection. Images were taken seven days post-PtoDC3000 inoculation. The experiments were repeated at least twice with similar results. The pictures shown for t − 48 h and t-24h come from the same experiment. Picture for t0, t + 24 h and t + 48 h, DC3000::EV, HopAB1n, and D36E::EV come from another experiment. The picture for DC3000::HopBF1a comes from a third experiment. Pictures were taken 7 days post-inoculation.
Fig. 7
Fig. 7. Comparison of ETI responses in tomato var. Glamour and A. thaliana.
Maximum likelihood phylogenetic tree for the PsyTEC-synthesized alleles for a HopAA, b HopAB, and c HopAR. A yellow box indicates that the corresponding allele does not trigger ETI, a green box indicates that the allele triggers ETI, and a gray box indicates that the allele is not expressed in PtoDC3000 and could not be tested.

Similar articles

Cited by

References

    1. Peralta IE, Spooner DM. Classification of wild tomatoes: a review. Kurtziana. 2000;28:45–54.
    1. Panno S, et al. A review of the most common and economically important diseases that undermine the cultivation of tomato crop in the Mediterranean basin. Agronomy. 2021;11:2188. doi: 10.3390/agronomy11112188. - DOI
    1. LeBoeuf, J. Bacterial diseases of tomato: Bacterial spot, bacterial speck, and bacterial canker. Ontario Ministry of Agriculture, Food & Rural Affairs. https://www.ontario.ca/page/bacterial-diseases-tomato-bacterial-spot-bac... (2005).
    1. Baltrus DA, McCann HC, Guttman DS. Evolution, genomics and epidemiology of Pseudomonas syringae: Challenges in Bacterial Molecular Plant Pathology. Mol. Plant Pathol. 2017;18:152–168. doi: 10.1111/mpp.12506. - DOI - PMC - PubMed
    1. Lamichhane JR, Messéan A, Morris CE. Insights into epidemiology and control of diseases of annual plants caused by the Pseudomonas syringae species complex. J. Gen. Plant Pathol. 2015;81:331–350. doi: 10.1007/s10327-015-0605-z. - DOI

MeSH terms