

Focused reservoir characterization: analysis of selected sand units using well log and 3-D seismic data in 'Kukih' field, Onshore Niger Delta, Nigeria
- PMID: 38877094
- PMCID: PMC11178835
- DOI: 10.1038/s41598-024-56100-7
Focused reservoir characterization: analysis of selected sand units using well log and 3-D seismic data in 'Kukih' field, Onshore Niger Delta, Nigeria
Abstract
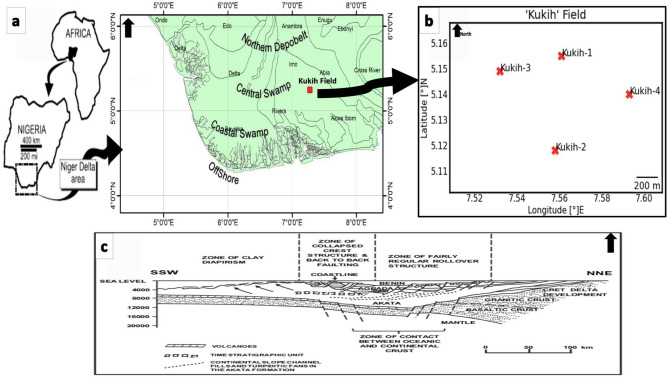
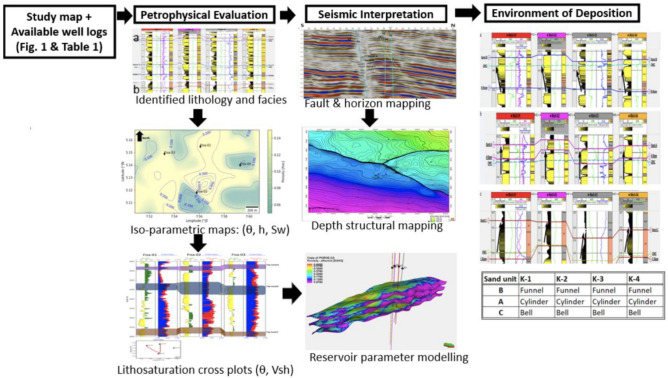
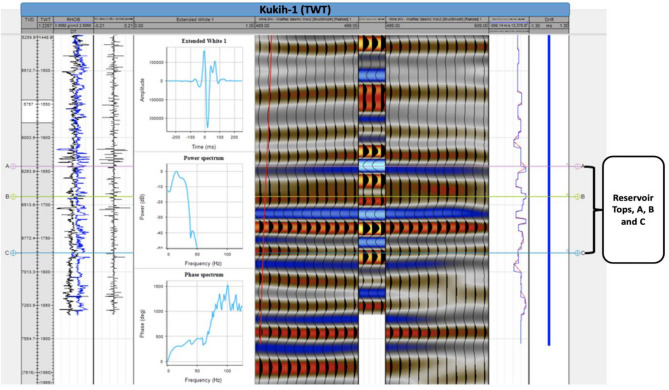
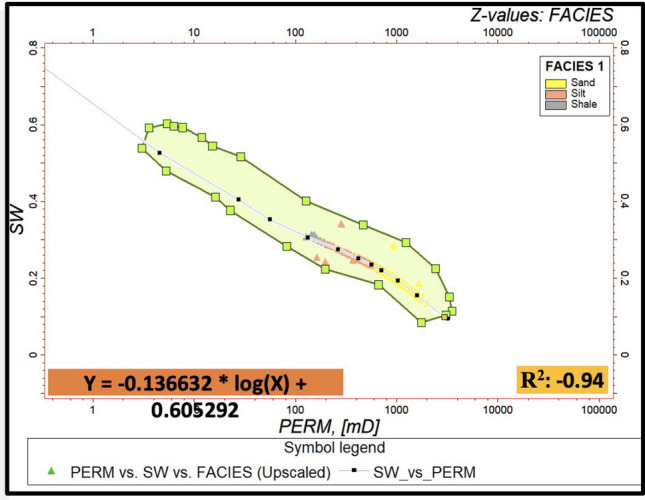
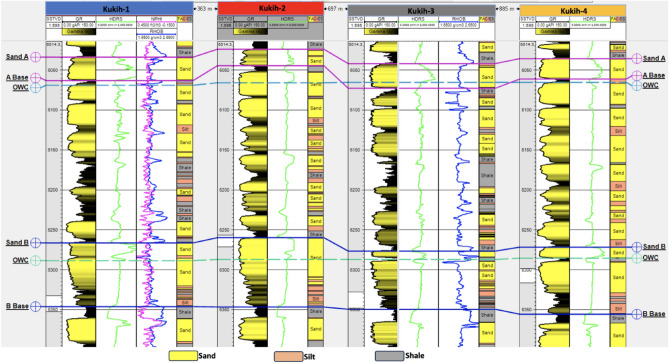
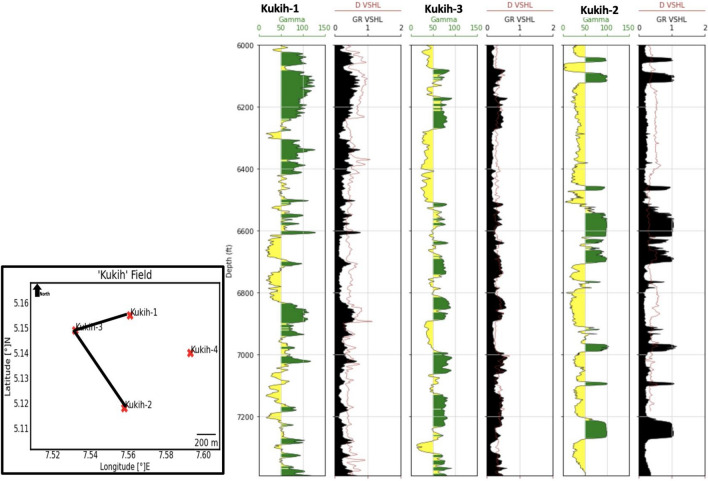
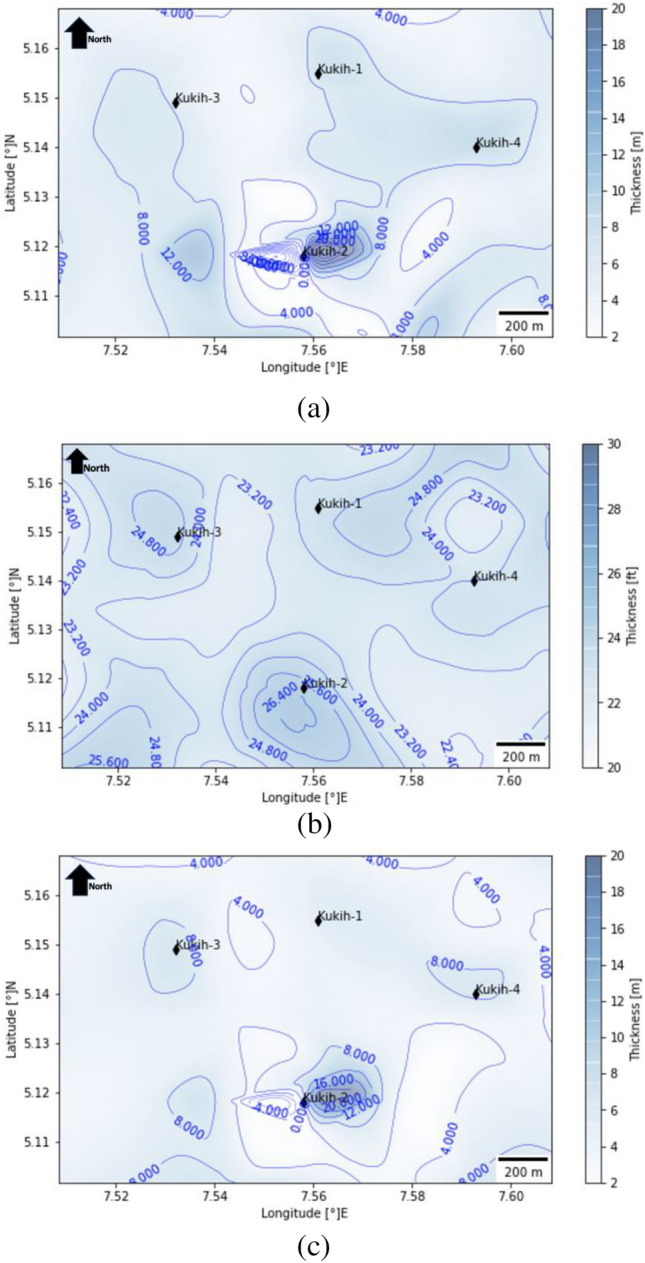
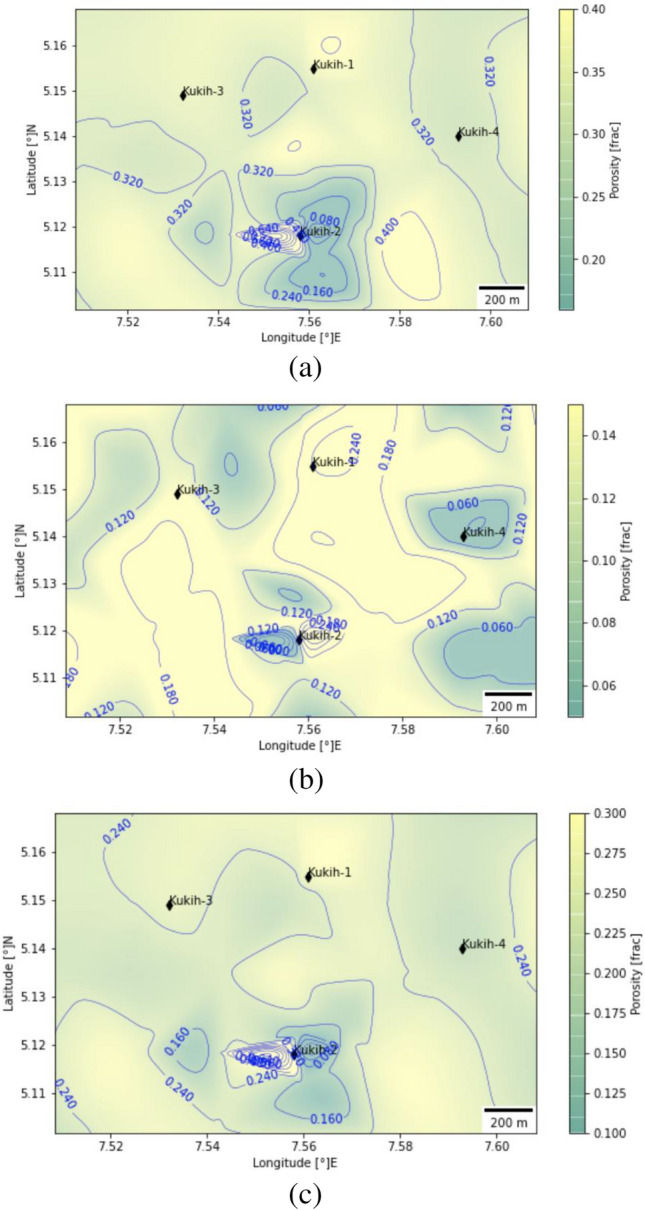
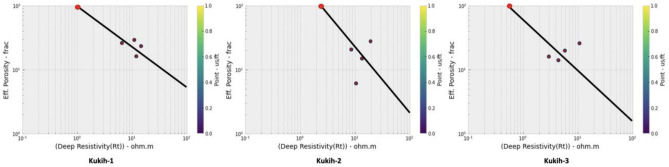
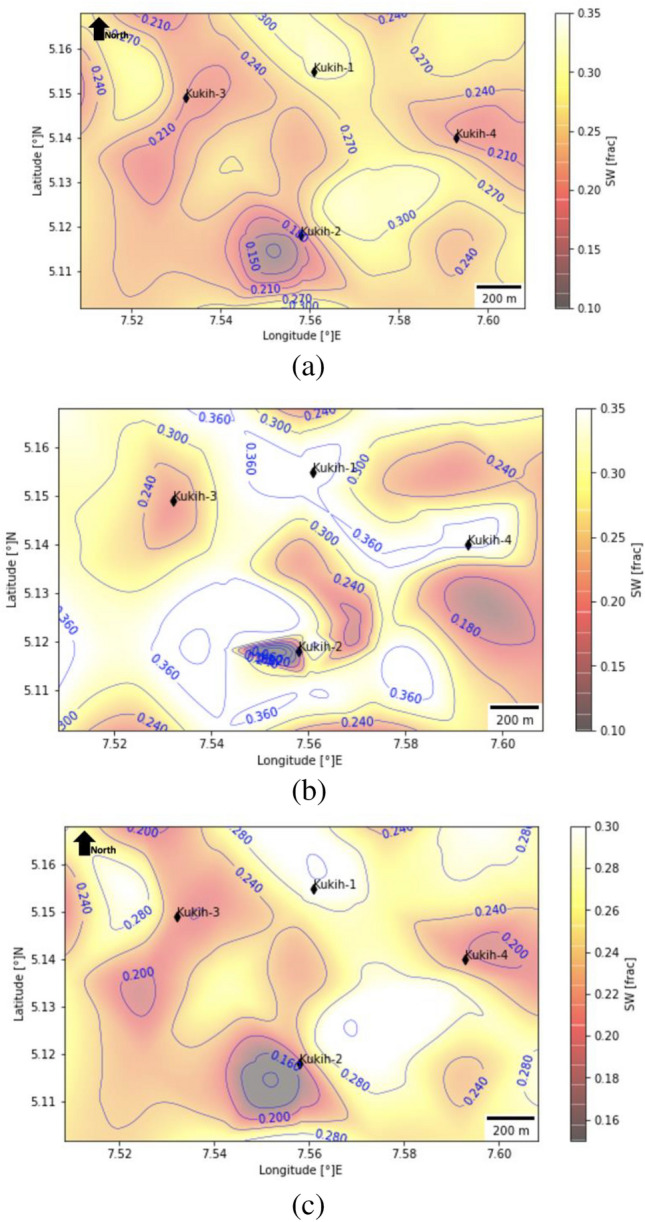
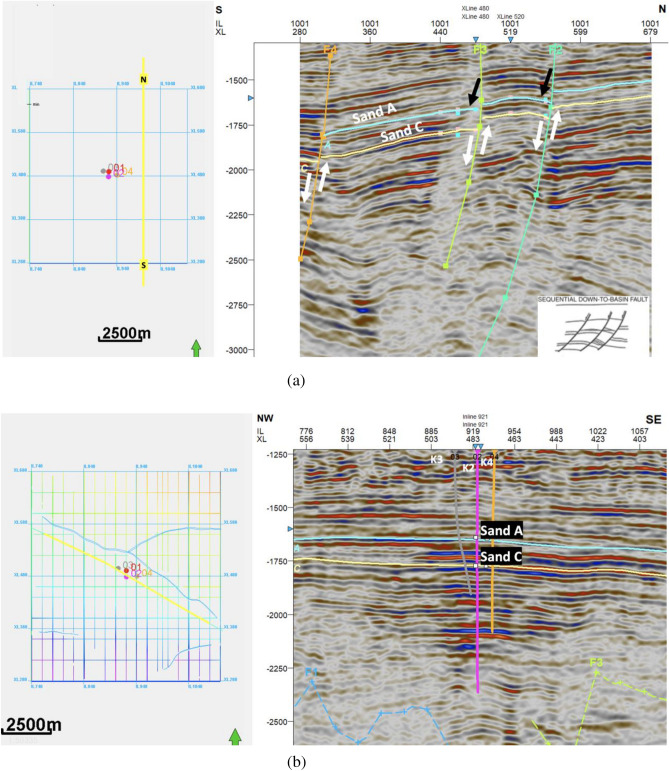
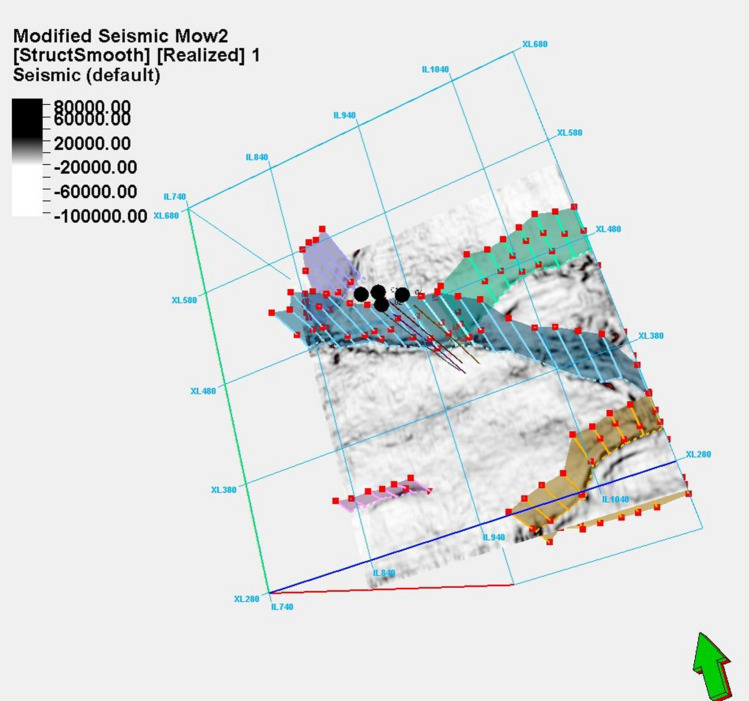
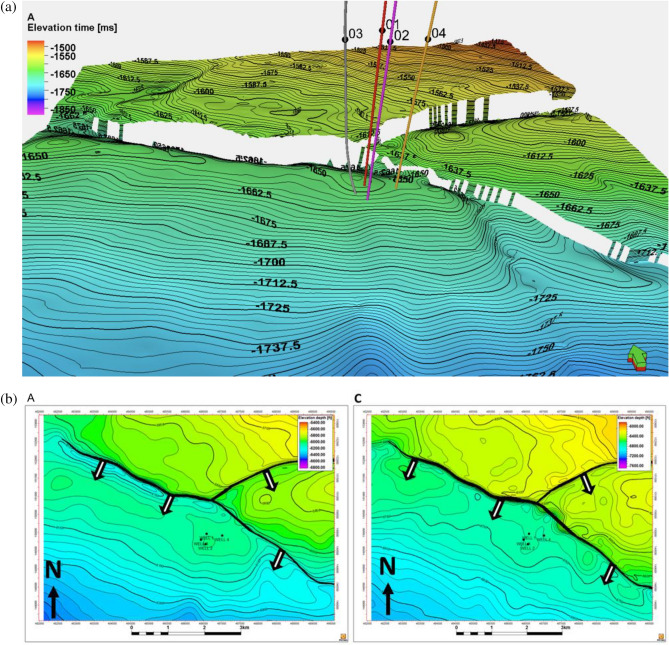
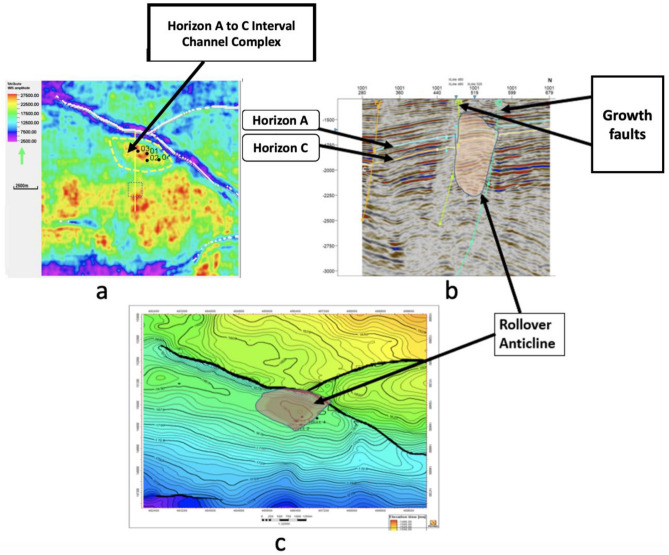
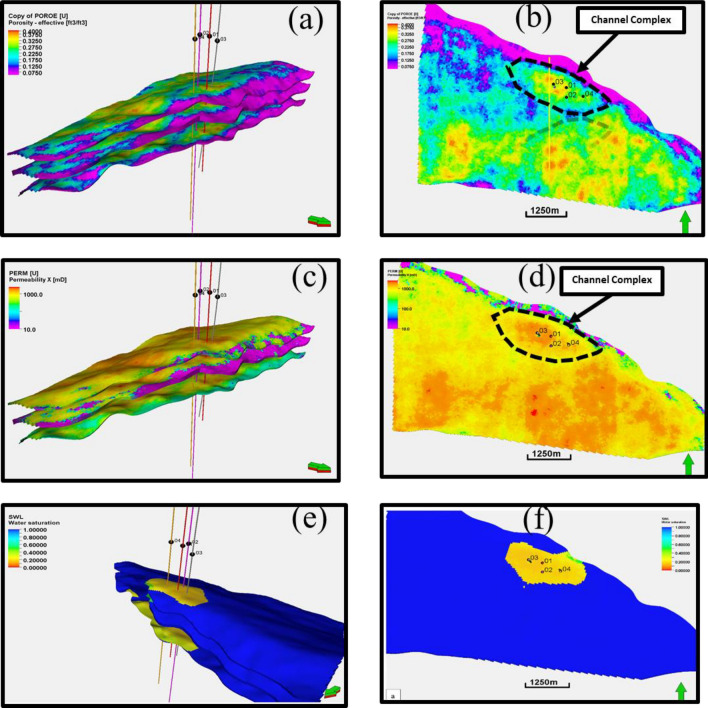
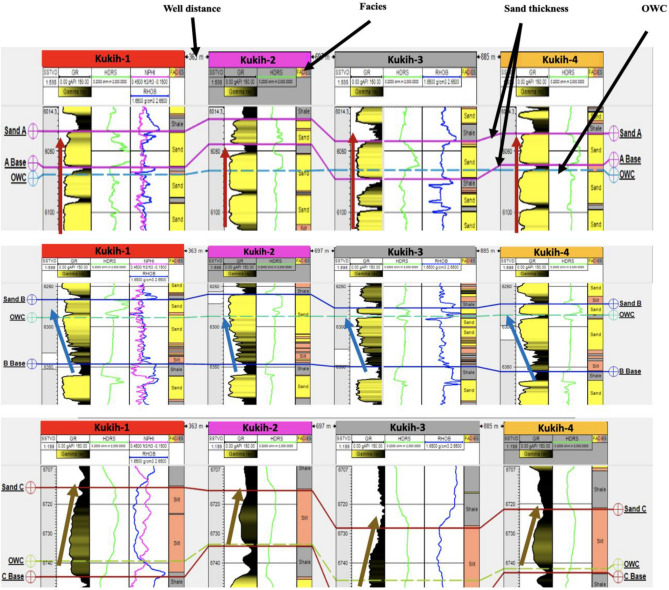
This study focuses on the comprehensive reservoir characterization of the 'Kukih' Field within the onshore northeastern Niger Delta region, Nigeria. The absence of its detailed description with delineated reservoir properties, lateral continuity, and their use to identify potential reservoir quality and heterogeneity necessitated this study. Integrating well log and 3D seismic data, the investigation aims to elucidate reservoir properties, lithofacies, and depositional environments to unravel hydrocarbon potential. The geological setting, encompassing the Agbada Formation of Early and Middle Miocene age, is scrutinized through detailed geologic analysis. Petrophysical evaluation of four well logs (Kukih-1, Kukih-2, Kukih-3, and Kukih-4) facilitated the determination of key parameters such as shale volume, effective porosity, and water saturation. Seismic interpretation further enriched the structural characterization of the field. Results showcase three predominant reservoir sands (A, B, and C) with distinct lithofacies and thickness variations. Effective porosity ranges from Fair to Excellent, with permeability exhibiting high values for hydrocarbon reservoir potential. Water saturation trends, lithofacies distributions, and structural features were illuminated through iso-parametric maps and seismic analyses. Depositional environments were inferred through facies analysis, revealing the presence of funnel-, cylinder-, and bell-shaped successions that hint at intricate marine sedimentary processes. Challenges owing to limited core data were acknowledged, and the integration of methodologies emerged as a pivotal strategy for enhanced reservoir understanding. This study underscores the 'Kukih' Field's hydrocarbon potential, accentuating the significance of multidisciplinary approaches in deciphering complex reservoir systems. In light of the petrophysical analysis derived from the well logs and the identification of structural highs through the structural maps, this study recommends the drilling of unexplored zones exhibiting promising structural characteristics.
Keywords: Depositional environment; Facies analysis; Hydrocarbon potential; Multidisciplinary approach; Petrophysical evaluation; Reservoir characterization; Structural analysis.
© 2024. The Author(s).
Conflict of interest statement
This analysis is devoid of any conflicts of interest, affirming the impartiality and integrity of its assertions.
Figures
Similar articles
-
High resolution 3-D seismic and sequence stratigraphy for reservoir prediction in 'Stephi' field, offshore Niger Delta, Nigeria.Sci Rep. 2024 Sep 27;14(1):22390. doi: 10.1038/s41598-024-73285-z. Sci Rep. 2024. PMID: 39333358 Free PMC article.
-
3D geological and petrophysical modeling of Alam El-Bueib formation using well logs and seismic data in Matruh field, northwestern Egypt.Sci Rep. 2024 Mar 21;14(1):6849. doi: 10.1038/s41598-024-56825-5. Sci Rep. 2024. PMID: 38514735 Free PMC article.
-
Rock typing and reservoir characterization of the Messinian Abu Madi Formation in the onshore South Abu El Naga Gas Field, Nile Delta, Egypt.Sci Rep. 2025 May 7;15(1):15926. doi: 10.1038/s41598-025-97780-z. Sci Rep. 2025. PMID: 40335611 Free PMC article.
-
Effect of different lithological assemblages on shale reservoir properties in the Permian Longtan Formation, southeastern Sichuan Basin: Case study of Well X1.PLoS One. 2022 Aug 12;17(8):e0271024. doi: 10.1371/journal.pone.0271024. eCollection 2022. PLoS One. 2022. PMID: 35960721 Free PMC article. Review.
-
A review of high-resolution X-ray computed tomography applied to petroleum geology and a case study.Micron. 2019 Sep;124:102702. doi: 10.1016/j.micron.2019.102702. Epub 2019 Jun 7. Micron. 2019. PMID: 31252333 Review.
References
-
- Odumodu CFR, Mode AW. Hydrocarbon maturation modeling of Paleocene to Lower Miocene source rocks in the Niger Delta Basin: Implications for hydrocarbon generation. Arab. J. Geosci. 2016;9:411. doi: 10.1007/s12517-016-2427-5. - DOI
-
- Adejobi A, Olayinka AI. Stratigraphy and hydrocarbon potential of the Opuama channel complex area, Western Niger Delta Nigeria. Assoc. Petrol. Expl. 1997;12:2–9.
-
- Adagunodo TA, et al. Characterization of reservoirs and depositional study of J-P Field, shallow offshore of Niger Delta Basin Nigeria. Sci. African. 2022;15:1–10. doi: 10.1016/j.sciaf.2021.e01064. - DOI
-
- Abdelwahhab MA, Radwan AA, Mahmoud H, Mansour A. Geophysical 3D-static reservoir and basin modelling of a Jurassic estuarine system (JG-Oilfield, Abu Gharadig basin, Egypt) J. Asian Earth Sci. 2022;225:105067. doi: 10.1016/j.jseaes.2021.105067. - DOI
-
- Avbovbo AA. Tertiary Lithostratigraphy of Niger Delta. AAPG Bull. 1978;62(1):96–200. doi: 10.1306/C1EA482E-16C9-11D7-8645000102C1865D. - DOI
LinkOut - more resources
Full Text Sources
