. 2024 Jun 14;14(1):13775.
doi: 10.1038/s41598-024-64036-1.

Adolescent alcohol exposure persistently alters orbitofrontal cortical encoding of Pavlovian conditional stimulus components in female rats

Affiliations

Adolescent alcohol exposure persistently alters orbitofrontal cortical encoding of Pavlovian conditional stimulus components in female rats

Jose A Pochapski et al. Sci Rep. .

Abstract

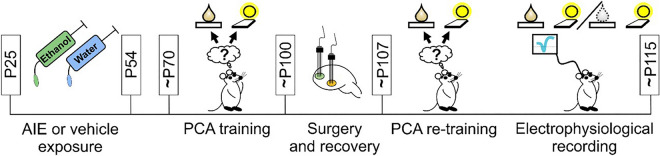
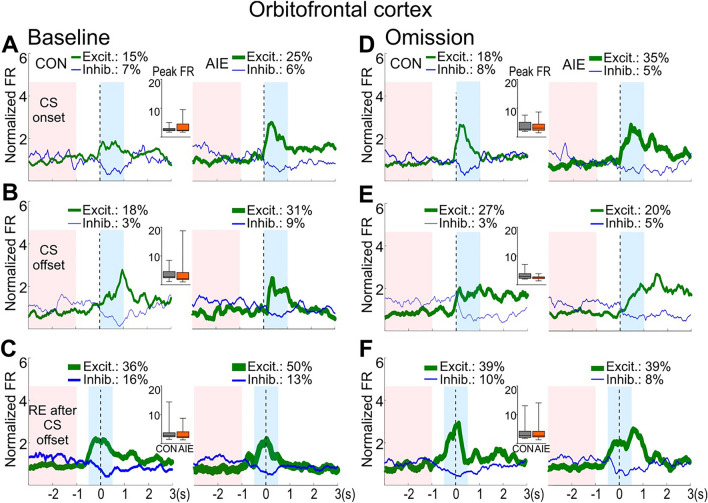
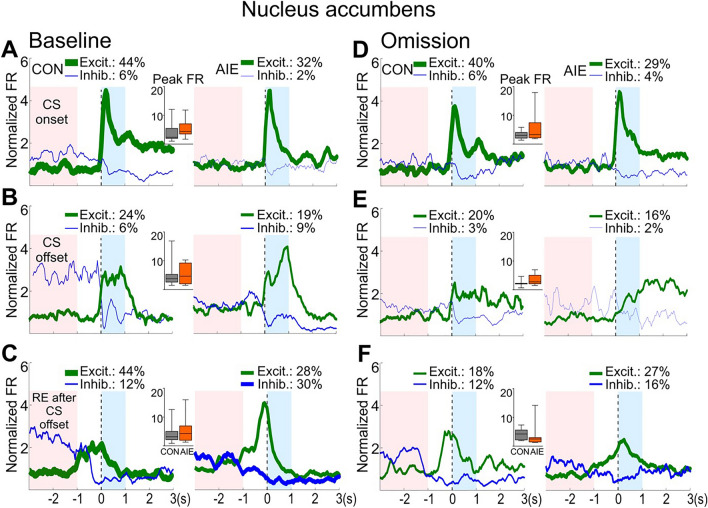
Exposure to alcohol during adolescence impacts cortical and limbic brain regions undergoing maturation. In rodent models, long-term effects on behavior and neurophysiology have been described after adolescent intermittent ethanol (AIE), especially in males. We hypothesized that AIE in female rats increases conditional approach to a reward-predictive cue and corresponding neuronal activity in the orbitofrontal cortex (OFC) and nucleus accumbens (NAc). We evaluated behavior and neuronal firing after AIE (5 g/kg intragastric) or water (CON) in adult female rats. Both AIE and CON groups expressed a ST phenotype, and AIE marginally increased sign-tracking (ST) and decreased goal-tracking (GT) metrics. NAc neurons exhibited phasic firing patterns to the conditional stimulus (CS), with no differences between groups. In contrast, neuronal firing in the OFC of AIE animals was greater at CS onset and offset than in CON animals. During reward omission, OFC responses to CS offset normalized to CON levels, but enhanced OFC firing to CS onset persisted in AIE. We suggest that the enhanced OFC neural activity observed in AIE rats to the CS could contribute to behavioral inflexibility. Ultimately, AIE persistently impacts the neurocircuitry of reward-motivated behavior in female rats.


Conflict of interest statement

The authors declare no competing interests.

Figures

Figure 1
Figure 1
Experimental timeline. Female Sprague–Dawley rats received ethanol administration across the adolescent period, from postnatal day (P) 25 to P54 on a 2-days-on / 2-days-off schedule. After this period no additional ethanol was administered. Starting around P70, a total of 20 Pavlovian condition approach (PCA) training sessions were performed. Each PCA session consisted of 15 trials where a 30-s (s) conditioned stimulus (CS, cue light/lever extension) was presented, followed by the US presentation (0.1 ml of a 20% sucrose solution) immediately after the CS offset. After the training phase, a stereotaxic surgery procedure was performed for electrode array implantation in the OFC and NAc, followed by 7 days of recovery. At least 5 additional PCA sessions occurred after the surgery recovery in order to habituate the animals to the electrophysiological recording procedure. Next, to evaluate possible AIE-induced effects on neuronal activity, single-unit recordings in OFC and NAc were performed during a regular PCA session (baseline) followed by a reward omission session. During the reward omission session, all 15 trials were performed similarly to the baseline session, with one important exception: after the 30-s CS, no reward solution was delivered in the reward receptacle. In the figure, the colored drop illustrates the US presentation during PCA session and the gray dotted drop represents the reward omission session. For more details, see methods.
Figure 2
Figure 2
Little effect of AIE exposure was observed on sign-tracking and goal-tracking behavioral responses in sign-tracking rats. (A) Using a composite sign-tracking/goal-tracking (ST-GT) score, rats were categorized as goal-trackers (CON n = 4, AIE n = 3), sign-trackers (CON n = 8, AIE n = 14), and intermediate (CON n = 6, AIE n = 5), see methods. Results here focused on sign-trackers (filled symbols). (B) Total number of lever presses. No significant differences were observed. (C) Lever press probability. A marginal exposure effect and a significant session effect were observed. However, no interaction between the factors was observed. (D). Latency to perform the first lever press. No significant differences were observed. (E). Receptacle elevation score. No significant differences were observed. (F). Probability of receptacle entry during the 30 s CS period. A marginal exposure effect and a significant effect of session were observed. However, no interaction between the factors was observed. (G). Number of receptacle entries (RE) 10 s after CS offset. A significant interaction of exposure by session was observed. Post-hoc analysis demonstrated a higher number of RE during the baseline session in the AIE versus CON groups. (H). Receptacle entry after CS offset. A significant effect of session, but no exposure or interaction between the factors were observed. (I-L). Averaged number of lever presses (I-J) and receptacle entries (K-L) during the first 10 s after CS onset (0–10 s) and during the 10 s before CS offset (21–30 s). (I). Analysis during baseline session demonstrated a significant effect of time. No treatment effect or interaction were observed. (J). Similarly, during the omission session only an effect of time was observed. (K). During the baseline session, only a significant effect of time was observed. (L). No significant differences were observed during the omission session. Data are expressed as mean ± SEM. The symbols in black circles for CON (n = 8) and orange squares for AIE (n = 14) represent individual subjects' data for sign-tracking rats. *** Main effect of session (P < 0.001). # P ≤ 0.05 group difference after Sidak’s post-hoc comparison. For statistical details see Table 1.
Figure 3
Figure 3
AIE exposure induced long-term changes in the OFC neuronal activity in response to CS onset and CS offset. Single-unit activity of OFC neurons was analyzed in sign-tracking rats during the baseline and omission sessions. (A). Illustrative representation of each trial during PCA baseline and omission sessions. In each trial, a 30-s conditioned stimulus (CS, cue light/lever extension) was presented. After the CS offset, the unconditioned stimulus (US, sucrose) was delivered during PCA baseline session. During the omission session, no US was delivered. Analyses were conducted on OFC single-unit population activity 1 s after CS onset and CS offset and 0.5 s before and after the receptacle entry performed after the CS offset (reward retrieval). (B-D). OFC population activity (average of all neurons) during baseline session. (B). Neurons recorded in AIE-exposed rats presented significantly higher population excitatory activity after CS onset than CON-exposed rats. (C). Analysis after CS offset also indicated a significantly higher OFC population activity in AIE-exposed compared to CON-exposed rats. (D). No AIE effect was observed on OFC activity during the first receptacle entry after CS offset. (E–G). OFC population activity during omission session. (E). After changes in the CS-US contingency a significantly higher excitatory activity after CS onset was still observed in OFC population activity in AIE-exposed group. (F). No AIE effect was observed on OFC population activity after CS offset during omission session. (G). Compared to the CON-exposed group, no AIE effect was observed on OFC activity during the first receptacle entry after CS offset. Neuronal population activity data are normalized to the whole session firing rate and presented as mean firing rate (line) ± SEM (shading) of all recorded neurons for CON (gray) and AIE (orange) groups. Number of recorded cells on OFC during baseline session: 61 cells in CON rats; 54 cells in AIE rats. Number of recorded cells on OFC during omission session: 60 cells in CON rats; 61 cells in AIE group. Inset graphs: box plots show the mean firing rate in the target window (blue box). * Significant group difference in mean firing rate (P ≤ 0.05). For statistical details, see Table 2.
Figure 4
Figure 4
No AIE exposure effect was observed on the amplitude of the OFC phasic excitatory cells. Phasic neuronal activity during CS onset, CS offset and first receptacle entry after CS offset from OFC recorded neurons during the PCA baseline and omission sessions. Firing activity for neurons that showed phasic excitatory activity (in green) and phasic inhibitory activity (in blue) are shown in each figure for CON (left graphs) and AIE (right graphs). The red box represents the 2-s baseline window for the phasic activity analysis. The thickness of each line reflects the proportion of neurons exhibiting phasic excitation or inhibition (non-phasic cells are not shown). Inset: box plots show the amplitude of excitation during the target window (blue box) for each phasic excitatory cell. OFC phasic activity during PCA baseline is presented for CS onset (A), CS offset (B), and first receptacle entry after CS offset (C). A higher percentage of phasic excitatory cells were recorded during the PCA baseline in AIE-exposed rats. However, no difference was observed in group comparisons on the amplitude of the firing activity displayed by phasic excitatory cells for these events (A-C). OFC phasic activity was also analyzed during omission sessions for CS onset (D), CS offset (E), and first receptacle entry after CS offset (F). There was a larger percentage of excitatory cells after CS onset in OFC neurons recorded from AIE-exposed rats. In contrast to the baseline session, both groups presented similar percentages of excitatory cells after CS offset and during the first receptacle entry after CS offset. No AIE effect was observed in the amplitude of the phasic excitation for these events. Neuronal phasic activity data are presented as mean firing rate. Box plots showed the median, interquartile range, and minimum and maximum data values, with CON in gray and AIE in orange. Note that the percentage of neurons displaying phasic activity are descriptive results. For statistical details of the analyses on the amplitude of phasic excitatory cells activity, see Supplemental Table S2.
Figure 5
Figure 5
No AIE effect was observed on NAc activity in response to CS onset, CS offset, and receptacle entry after CS offset. Single-unit activity of NAc neurons were analyzed in sign-tracking rats during the baseline and omission sessions. (A). Illustrative representation of each trial, as described for Fig. 3. (B-D). NAc population activity (average of all neurons) during baseline session. (B). NAc neuron population activity did not differ between exposure groups after CS onset during the PCA baseline session. (C). NAc neuron population activity did not differ between exposure groups after CS offset. (D). NAc neuron population activity did not differ between exposure groups during the first receptacle entry to retrieve the US. (E–G). NAc population activity during the omission session. (E). After changes in CS-US contingency, NAc neuron population activity did not differ between exposure groups after CS onset. (F). NAc neuron population activity did not differ between exposure groups after CS offset. (G). NAc neuron population activity did not differ between exposure groups during the first receptacle entry after CS offset. Neuronal population activity data are normalized to the whole session firing rate and presented as mean firing rate (line) ± SEM (shading) of all recorded neurons for CON (gray) and AIE (orange) groups. Number of recorded cells from NAc during baseline session: 33 cells from CON and 47 cells from AIE group. Number of recorded cells from NAc during omission session: 33 cells from CON and 45 cells from AIE group. Inset: box plots show the mean firing rate in the target window (blue box). These data are presented as median, interquartile range, and minimum and maximum data values. For statistical details see Table 2.
Figure 6
Figure 6
No AIE effect was observed on NAc phasic activity after CS onset, CS offset, or the first receptacle entry after CS offset. Phasic activity in NAc neurons was analyzed during PCA baseline and omission sessions. Firing activity for neurons that showed phasic excitatory activity (in green) and phasic inhibitory activity (in blue) are shown in each figure for CON (left graphs) and AIE (right graphs). The red box represents the 2-s baseline window for the phasic activity analysis. The thickness of each line reflects the proportion of neurons exhibiting phasic excitation or inhibition (non-phasic cells are not shown). Inset: box plots show the amplitude of excitation during the target window (blue box) for each phasic excitatory cell. NAc phasic activity during the baseline session (A, B, and C) and omission session (D, E, and F) are presented for CS onset, CS offset, and the first receptacle entry (RE) after CS offset, respectively. No AIE effect was observed during these events on the amplitude of the activity displayed by phasic excitatory cells during both recording sessions. Neuronal phasic activity data are presented as mean firing rate. Box plots showed the median, interquartile range, and minimum and maximum data values, with CON in gray and AIE in orange. Note that the percentage of neurons displaying phasic activity are descriptive results. For statistical details of the analyses on the amplitude of phasic excitatory cells activity, see Supplemental Table S2.
Figure 7
Figure 7
OFC firing response to CS onset is associated with subsequent lever presses in AIE-exposed, but not CON-exposed, rats. The results of the mixed-linear model (MLM) analysis are shown for baseline (A-B) and omission sessions (C-D). The left panels (A and C) represent the comparison of exposure (AIE and control), OFC mean firing rate (FR) to CS onset (CS on), and lever presses during the last 10 s before CS offset. The slope values represent the comparison of individual OFC neurons' activity to CS onset and LP 10 s before CS offset. Group comparisons are shown on the right bar graphs (B and D). Solid lines represent the main effect of exposure on lever presses. Dotted lines represent the main effect of firing rate on lever presses. Intermittent dotted lines represent the exposure × firing rate interaction. **P < 0.01. For statistical details see Table 2 and Supplemental Table S2. Int. (interaction), NS (non-significant).

Similar articles

References

    1. Spear LP. Adolescents and alcohol: Acute sensitivities, enhanced intake, and later consequences. Neurotoxicol. Teratol. 2014 doi: 10.1016/j.ntt.2013.11.006.Adolescents. - DOI - PMC - PubMed
    1. Spear LP. Effects of adolescent alcohol consumption on the brain and behaviour. Nat. Rev. Neurosci. 2018 doi: 10.1038/nrn.2018.10. - DOI - PubMed
    1. Varlinskaya EI, Spear LP. Social consequences of ethanol: Impact of age, stress, and prior history of ethanol exposure. Physiol. Behav. 2015;1:145–150. doi: 10.1016/j.physbeh.2014.11.062. - DOI - PMC - PubMed
    1. Bava S, Tapert SF. Adolescent brain development and the risk for alcohol and other drug problems. Neuropsychol. Rev. 2010 doi: 10.1007/s11065-010-9146-6. - DOI - PMC - PubMed
    1. Caballero A, Granberg R, Tseng KY, Chicago N. Mechanisms contributing to prefrontal cortex maturation during adolescence. Neurosci. Biobehav. Rev. 2016;70:4–12. doi: 10.1016/j.neubiorev.2016.05.013. - DOI - PMC - PubMed