. 2024 Aug;131(3):430-443.
doi: 10.1038/s41416-024-02742-3. Epub 2024 Jun 14.

Disruption of DNA-PKcs-mediated cGAS retention on damaged chromatin potentiates DNA damage-inducing agent-induced anti-multiple myeloma activity

Affiliations

Disruption of DNA-PKcs-mediated cGAS retention on damaged chromatin potentiates DNA damage-inducing agent-induced anti-multiple myeloma activity

Jin-Na Zhang et al. Br J Cancer. 2024 Aug.

Abstract

Background: Targeting DNA damage repair factors, such as DNA-dependent protein kinase catalytic subunit (DNA-PKcs), may offer an opportunity for effective treatment of multiple myeloma (MM). In combination with DNA damage-inducing agents, this strategy has been shown to improve chemotherapies partially via activation of cGAS-STING pathway by an elevated level of cytosolic DNA. However, as cGAS is primarily sequestered by chromatin in the nucleus, it remains unclear how cGAS is released from chromatin and translocated into the cytoplasm upon DNA damage, leading to cGAS-STING activation.

Methods: We examined the role of DNA-PKcs inhibition on cGAS-STING-mediated MM chemosensitivity by performing mass spectrometry and mechanism study.

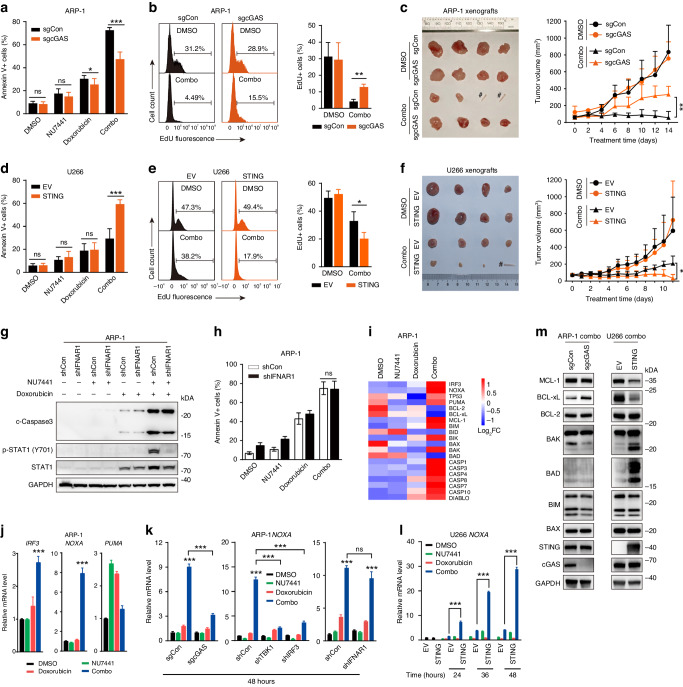
Results: Here, we found DNA-PKcs inhibition potentiated DNA damage-inducing agent doxorubicin-induced anti-MM effect by activating cGAS-STING signaling. The cGAS-STING activation in MM cells caused cell death partly via IRF3-NOXA-BAK axis and induced M1 polarization of macrophages. Moreover, this activation was not caused by defective classical non-homologous end joining (c-NHEJ). Instead, upon DNA damage induced by doxorubicin, inhibition of DNA-PKcs promoted cGAS release from cytoplasmic chromatin fragments and increased the amount of cytosolic cGAS and DNA, activating cGAS-STING.

Conclusions: Inhibition of DNA-PKcs could improve the efficacy of doxorubicin in treatment of MM by de-sequestrating cGAS in damaged chromatin.


Conflict of interest statement

The authors declare no competing interests.

Figures

Fig. 1
Fig. 1. DNA-PKcs inhibition synergistically enhanced doxorubicin-induced cell death of MMCs.
a ARP-1 or NCI-H929 cells were harvested 48 h after treatment with doxorubicin (ARP-1 5 μg/mL or NCI-H929 0.25 μg/mL for 1 h) together with various DDR inhibitors (ATM inhibitor: KU60019 5 μM, ATR inhibitor: VE821 5 μM, DNA-PKcs inhibitor: NU7441 5 μM, PARP1 inhibitor: Olaparib 10 μM, Chk1 inhibitor: Prexasertib 2.5 μM, Chk2 inhibitor: CCT241533 2.5 μM) or the DMSO mock control as indicated, and cell apoptosis was evaluated by flow cytometry with Annexin V/PI staining (n = 4 per group). b ARP-1 or NCI-H929 cells were treated with DMSO, NU7441, doxorubicin or Combo (i.e., combined NU7441 and doxorubicin) at the indicated doses for 48 h, the cell growth inhibition rates were measured by CCK-8 assay and combination index (CI) values were calculated (CI < 0.85 indicates a synergistic effect) (n = 8). ce ARP-1 or NCI-H929 cells were exposed to DMSO, NU7441, doxorubicin or Combo for 48 h, and analyzed by Western blot with GAPDH as a loading control (c) and by the CCK-8 assay to monitor the relative cell growth (d, n = 4). Cell proliferation was also determined by EdU incorporation (e, n = 3 per group). f, g ARP-1-xenografted NCG mice were intraperitoneally administered with DMSO, NU7441 (12 mg/kg, 5 times a week), doxorubicin (3 mg/kg, once a week) or Combo. The tumor size was monitored by caliper measurement daily (f, n = 3 per group) and the level of c-Caspase3 in tumors with chemical treatment for 7 d was analyzed by Western blot, with GAPDH as a loading control (g). Columns in a, e and each symbol in b, d indicate the mean ± SD of at least three independent experiments, and statistics was performed by one-way ANOVA with Dunnett multiple comparison test for comparison between each inhibitor and DMSO in the presence of doxorubicin in a, and comparison between Combo treatment and DMSO, NU7441 or doxorubicin alone in d and e. Each symbol in f represents the mean ± SD of three tumor-bearing mice at each time point and statistics was performed by unpaired one-tailed Student’s t test. *P < 0.05; **P < 0.01; ***P < 0.001; ns not significant.
Fig. 2
Fig. 2. DNA-PKcs inhibition potentiated doxorubicin-induced cGAS-STING-mediated response of type I IFNs in MMCs.
a RNA-seq analysis of ARP-1 cells exposed to DMSO, NU7441 (5 μM), doxorubicin (5 μg/mL for 1 h) or Combo for 48 h. Gene set enrichment analysis (GSEA) of differentially expressed genes was performed to identify significantly enriched pathways with normalized enrichment score (NES) > 1, P value < 0.01 and false discovery rate (FDR) < 0.25. The top 3 up-regulated pathways ordered by NES were illustrated. bd ARP-1 cells were exposed to DMSO, NU7441, doxorubicin or Combo. The transcripts of IFNB1 and ISG54 after 2, 8, 24 and 48 h were determined by RT-qPCR (b, n = 3 per group). Cytokine levels of CCL5 and CXCL10 in the supernatant were examined by ELISA after 48 h (c, n = 3 per group). Steady-state levels of STAT1 and p-STAT1 (Y701) were determined by Western blot with GAPDH as a loading control (d). e Steady-state levels of endogenous cGAS and STING in MM cell lines indicated. f Apoptosis of MM cells determined by flow cytometry with Annexin V/PI staining. MM cells were treated with DMSO, NU7441(5 μM), doxorubicin or Combo for 48 h. Doxorubicin treatment for each cell line: ARP-1 5 μg/mL, AMO1 2.5 μg/mL, NCI-H929 0.25 μg/mL, U266 5 μg/mL, RPMI-8226 1 μg/mL, MM1.S 0.25 μg/mL for 1 h (n = 3 per group). g, h ARP-1 cells infected with lentivirus expressing Cas9 together with negative control sgRNA (sgCon) or sgRNA targeting cGAS (sgcGAS) were treated with DMSO, NU7441, doxorubicin or Combo for 48 h. Steady-state protein levels were determined by Western blot with GAPDH as a loading control (g). The transcripts of IFNB1 and ISG54 were analyzed by RT-qPCR (h, n = 3 per group). ik U266 cells infected with lentivirus expressing the EV control or STING were treated with DMSO, NU7441, doxorubicin or Combo for 48 h. Steady-state protein levels were determined by Western blot with GAPDH as a loading control (i). The transcripts of IFNB1 and ISG54 were analyzed by RT-qPCR (j, n = 3 per group) and the concentration of CCL5 and CXCL10 secreted into the supernatant was determined by ELISA (k, n = 3 per group). EV: empty vector. Columns in b and c indicate the mean ± SD of at least three independent experiments, and statistics was performed by one-way ANOVA with Dunnett multiple comparison test for comparison between Combo treatment and DMSO, NU7441 or doxorubicin alone. Columns in f, h, j and k indicate the mean ± SD of at least three independent experiments, and statistics was performed by unpaired two-tailed Student’s t test. *P < 0.05; **P < 0.01; ***P < 0.001; ns not significant.
Fig. 3
Fig. 3. NU7441/doxorubicin promoted cGAS-STING-dependent but type I IFNs-independent NOXA-mediated apoptosis of MMCs.
a, b, d, e ARP-1 cells infected with lentivirus expressing Cas9 together with sgCon or sgcGAS (a, b) and U266 cells infected with lentivirus expressing the EV control or STING (d, e) were treated with DMSO, NU7441 (5 μM), doxorubicin (5 μg/mL for 1 h) or Combo. Apoptosis was determined by flow cytometry with Annexin V/PI staining after 48 h (a, d n = 9 per group) and cell proliferation indicated by EdU incorporation was analyzed by flow cytometry (b, e n = 3 per group). EV: empty vector. c, f NCG mice xenografted with ARP-1 cells depleted of cGAS (vs. sgCon) (c) or U266 cells stably expressing exogenous STING (vs. EV) (f) were intraperitoneally administered with DMSO, NU7441 (12 mg/kg, 5 times a week), doxorubicin (3 mg/kg, once a week) or Combo. The tumor size was monitored by caliper measurement. #: A mouse tail indicating that the mouse no longer had a visible tumor xenograft (n = 4 per group). g, h ARP-1 cells depleted of IFNAR1 by shIFNAR1 (vs. shCon) were exposed to DMSO, NU7441, doxorubicin or Combo for 48 h. Steady-state protein levels were analyzed by Western blot (g), and apoptosis was determined by flow cytometry with Annexin V/PI staining (h, n = 3 per group). i, j RNA-seq analysis in heatmap depicting significant alteration in expression of selected genes related to intrinsic apoptosis in ARP-1 cells treated as indicated (i), and the transcripts of IRF3, NOXA and PUMA were analyzed by RT-qPCR (j, n = 3 per group). k, l ARP-1 cells depleted of cGAS (vs. sgCon), TBK1 (vs. shCon), IRF3 (vs. shCon), IFNAR1 (vs. shCon) (k) and U266 cells stably expressing STING (vs. EV) (l) were treated with DMSO, NU7441, doxorubicin or Combo. The NOXA mRNA level was determined by RT-qPCR (n = 3 per group). m The steady-state levels of MCL-1, BCL-xL, BCL-2, BAK, BAD, BIM and BAX in ARP-1 depleted of cGAS (vs. sgCon) and U266 stably expressing STING (vs. EV) were determined by Western blot at 48 h after Combo treatment. Columns in a, b, d, e, h and l indicate the mean ± SD of at least three independent experiments, and statistics was performed by unpaired two-tailed Student’s t test. Each symbol in c and f represents the mean ± SD of four tumor-bearing mice at each time point and statistics was performed by unpaired two-tailed Student’s t test. Columns in j and k indicate the mean ± SD of at least three independent experiments and statistics was performed by one-way ANOVA with Dunnett multiple comparison test for comparison between Combo treatment and DMSO, NU7441 or doxorubicin alone, and unpaired two-tailed Student’s t test for the effect of sgcGAS (vs. sgCon) or shTBK1, shIRF3, shIFNAR1 (vs. shCon) on Combo-induced NOXA expression. *P < 0.05; **P < 0.01; ***P < 0.001; ns not significant.
Fig. 4
Fig. 4. Activation of the cGAS-STING signaling by NU7441/doxorubicin in MMCs induced M1 polarization of macrophages (Mφs).
a Flowchart for Mφ polarization assay. Human PBMCs were cultured in media containing M-CSF (20 ng/mL) for 6-7 d and differentiated into Mφs. At 48 h after MM cells were treated with DMSO, NU7441 (5 μM), doxorubicin (5 μg/mL for 1 h) or Combo, the supernatants from MM cells treated were collected, diluted 1:1 with fresh Mφ medium and added to the Mφs culture. Mφ polarization was determined by flow cytometry at 1 d after the supernatant addition. b Mφ polarization with expression of the surface molecule CD163, CD206 and CD86 after adding supernatants of ARP-1 cells treated with DMSO, NU7441, doxorubicin or Combo. S-ARP-1: Supernatants from ARP-1 cells (n = 4 per group). c The mRNA levels of M1 and M2 markers in Mφ polarization induced by supernatants of ARP-1 cells treated with DMSO, NU7441, doxorubicin or Combo (n = 6 per group). d The IL-10 concentration in the Mφ culture. The first Mφ culture media was replaced with fresh Mφ culture medium at 1 d after adding supernatants of ARP-1 cells treated with DMSO, NU7441, doxorubicin or Combo, and the IL-10 concentration in the fresh Mφ culture media was examined by ELISA (n = 3 per group). e Mφ polarization with expression of the surface molecule CD163, CD206 and CD86 after adding supernatants of U266 cells treated with Combo (i.e., combined NU7441 and doxorubicin). U266 cells stably expressing exogenous STING was compared to U266 cells expressing the EV control. S-U266: Supernatants from U266 cells (n = 6 or 5 per group). EV: empty vector. f The mRNA levels of M1 and M2 markers in Mφ polarization induced by supernatants of U266 cells treated with Combo (n = 5 per group). g The IL-10 concentration in the Mφ culture after adding supernatants of U266 cells treated with Combo, as in d (n = 3 per group). h Apoptosis of ARP-1 cells treated with DMSO, BTZ (10 nM) alone, BTZ (10 nM) in combination with Mφs either in M1 polarization or M2 polarization induced by the supernatants of ARP-1 cells treated with DMSO, NU7441, doxorubicin or Combo (n = 4 per group), or U266 cells treated with Combo (n = 3 per group). Columns in bh indicate the mean ± SD of at least three independent experiments, and statistics was performed by one-way ANOVA with Dunnett multiple comparison test for comparison between Combo treatment and DMSO, NU7441 or doxorubicin alone in bd, paired two-tailed Student’s t test in e, and unpaired two-tailed Student’s t test in fh. *P < 0.05; **P < 0.01; ***P < 0.001; ns not significant.
Fig. 5
Fig. 5. DNA-PKcs inhibition but not c-NHEJ deficiency potentiated doxorubicin-induced cGAS activation in MMCs by dissociating cGAS from cytoplasmic nucleosomes.
ac The effect of DNA-PKcs depletion (a), KU80 depletion (b) or XRCC4 depletion (c) on the mRNA levels of IFNB1 and ISG54 in ARP-1 cells treated with DMSO, NU7441, doxorubicin or Combo (n = 9 per group). d Distribution of cGAS proteins in ARP-1 and U266 cells in whole-cell lysate (WCL), cytoplasmic fraction (Cy), soluble nuclear fraction (SN) and chromatin fraction (Ch). GAPDH, LaminB1 and H2AX served as loading controls. e The effect of chemical treatment on cGAS distribution in ARP-1 and U266 cells. f, g ARP-1 cells infected with lentivirus expressing Flag-tagged cGAS were treated with DMSO, NU7441, doxorubicin or Combo for 36 h. The expression and subcellular localization of cGAS (green) were visualized by immunofluorescence, counterstained with DAPI (blue) to indicate nuclei, scale bars, 20 μm (f). The representative confocal immunofluorescent staining of cGAS (green), DNA-PKcs or KU80 (red) of ARP-1 cells (Flag-cGAS) was shown, counterstained with DAPI (blue) to indicate nuclei, scale bars, 10 μm (g). h The association of DNA-PKcs and KU80 with cGAS in MM cells. ARP-1 and U266 cells stably infected lentivirus expressing Flag-tagged cGAS were harvested and lysed at 36 h after treatment with DMSO, NU7441, doxorubicin or Combo. The protein interaction was determined by immunoprecipitation followed by Western blot with antibodies indicated. i, j Identification of cGAS-interacting proteins in U266 cells stably expressing HA-tagged cGAS after treatment with doxorubicin alone or combined NU7441/doxorubicin by co-immunoprecipitation with anti-HA antibodies followed by mass spectrometry. Co-immunoprecipitates were resolved by SDS-PAGE and visualized by Coomassie brilliant blue staining (i) and proteins <25-kDa from doxorubicin alone in a red rectangle were analyzed by mass spectrometry (j). k, l Validation of cGAS-interacting proteins histone H2A and H2B identified in U266 cells stably expressing HA-cGAS or ARP-1 cells stably expressing Flag-cGAS. Cells were harvested at 36 h after chemical treatments indicated and lysed with the cytoplasmic protein extraction lysis buffer (k) or the Co-IP lysis buffer (l). The interaction between cGAS and histone H2A/H2B was validated by co-immunoprecipitation followed by Western blot. Columns in ac indicate the mean ± SD of at least three independent experiments, and statistics was performed by unpaired two-tailed Student’s t test for the effect of shDNA-PKcs (vs. shCon) (a), shKU80 (vs. shCon) (b) and sgXRCC4 (vs. sgCon) (c) on Combo-induced IFNB1 and ISG54 expression.
Fig. 6
Fig. 6. Disruption of cytoplasmic cGAS-nucleosome binding abolished the effect of NU7441 on doxorubicin-induced activation of the cGAS-STING signaling in MMCs.
a Immunoblot of cGAS and its mutants in whole-cell lysate (WCL), cytoplasmic fraction (Cy), soluble nuclear fraction (SN) and chromatin fraction (Ch) of cGAS KO ARP-1 cells infected with lentivirus expressing negative EV control, wild-type cGAS (WT) or 4 cGAS mutants (Y215E, Y215A, R236E and R255E). GAPDH, LaminB1 and histone H3 served as loading controls. EV: empty vector. b The association of H2A and H2B with Flag-cGAS in the cytoplasm of cGAS KO ARP-1 cells complemented with Flag-cGAS (WT) or its 4 different mutants in the presence of doxorubicin alone or combined NU7441/doxorubicin. The protein interaction was determined by immunoprecipitation (IP) followed by Western blot with antibodies indicated. c The effect of cGAS mutations on the mRNA levels of IFNB1, ISG54, CCL5 and CXCL10 in cGAS KO ARP-1 cells complemented with EV, cGAS (WT) or 4 different cGAS mutants. Cells were treated with DMSO, NU7441, doxorubicin or Combo for 48 h (n = 9 or 6 per group). d The effect of cGAS mutations on apoptosis of cGAS KO ARP-1 cells complemented with EV, cGAS (WT) or 4 different cGAS mutants after cells were treated with DMSO, NU7441, doxorubicin or Combo for 48 h (n = 3 per group). e Immunoblot of c-Caspase3, c-Caspase-8, STAT1 and p-STAT1 (Y701) proteins in cGAS KO ARP-1 cells complemented with EV, cGAS (WT) or 4 different cGAS mutants after cells were treated with DMSO and Combo or with DMSO and doxorubicin for 48 h. f ARP-1 cells depleted of MRE11 (vs. shCon) were treated with DMSO, NU7441, doxorubicin or Combo. The IFNB1 and ISG54 mRNA levels were determined by RT-qPCR after 48 h (n = 6 per group). Columns in c, d and f indicate the mean ± SD of at least three independent experiments, and statistics was performed by unpaired two-tailed Student’s t test. The numbers indicate fold changes in comparison in c and d. *P < 0.05; **P < 0.01; ***P < 0.001; ns not significant.

References

    1. Kumar SK, Rajkumar V, Kyle RA, van Duin M, Sonneveld P, Mateos MV, et al. Multiple myeloma. Nat Rev Dis Primers. 2017;3:17046. 10.1038/nrdp.2017.46 - DOI - PubMed
    1. Alagpulinsa DA, Szalat RE, Poznansky MC, Shmookler Reis RJ. Genomic Instability in Multiple Myeloma. Trends Cancer. 2020;6:858–73. 10.1016/j.trecan.2020.05.006 - DOI - PubMed
    1. Yang Y, Li Y, Gu H, Dong M, Cai Z. Emerging agents and regimens for multiple myeloma. J Hematol Oncol. 2020;13:150. 10.1186/s13045-020-00980-5 - DOI - PMC - PubMed
    1. Cowan AJ, Green DJ, Kwok M, Lee S, Coffey DG, Holmberg LA, et al. Diagnosis and Management of Multiple Myeloma: A Review. JAMA. 2022;327:464–77. 10.1001/jama.2022.0003 - DOI - PubMed
    1. Lakshman A, Singh PP, Rajkumar SV, Dispenzieri A, Lacy MQ, Gertz MA, et al. Efficacy of VDT PACE-like regimens in treatment of relapsed/refractory multiple myeloma. Am J Hematol. 2018;93:179–86. 10.1002/ajh.24954 - DOI - PubMed

MeSH terms