. 2024 Jun;30(6):1655-1666.
doi: 10.1038/s41591-024-03040-4. Epub 2024 Jun 14.

Ultrasensitive plasma-based monitoring of tumor burden using machine-learning-guided signal enrichment

Adam J Widman #  1   2 Minita Shah #  3 Amanda Frydendahl #  4   5 Daniel Halmos #  3   6 Cole C Khamnei  3   6 Nadia Øgaard  4   5 Srinivas Rajagopalan  3   6 Anushri Arora  3   6 Aditya Deshpande  3   6 William F Hooper  3 Jean Quentin  3   6 Jake Bass  3   6 Mingxuan Zhang  3   6 Theophile Langanay  3   6 Laura Andersen  4   5 Zoe Steinsnyder  3 Will Liao  3 Mads Heilskov Rasmussen  4   5 Tenna Vesterman Henriksen  4   5 Sarah Østrup Jensen  4   5 Jesper Nors  4   5 Christina Therkildsen  7 Jesus Sotelo  3   6 Ryan Brand  3   6 Joshua S Schiffman  3   6 Ronak H Shah  8 Alexandre Pellan Cheng  3   6 Colleen Maher  8   9 Lavinia Spain  10   11 Kate Krause  12 Dennie T Frederick  12 Wendie den Brok  13 Caroline Lohrisch  13 Tamara Shenkier  13 Christine Simmons  13 Diego Villa  13 Andrew J Mungall  14 Richard Moore  14 Elena Zaikova  15 Viviana Cerda  15 Esther Kong  15 Daniel Lai  15 Murtaza S Malbari  6 Melissa Marton  3 Dina Manaa  3 Lara Winterkorn  3 Karen Gelmon  13 Margaret K Callahan  8 Genevieve Boland  12 Catherine Potenski  3   6 Jedd D Wolchok  8 Ashish Saxena  6 Samra Turajlic  10   11 Marcin Imielinski  3   16 Michael F Berger  8 Sam Aparicio  15   17 Nasser K Altorki  6 Michael A Postow  8   6 Nicolas Robine  3 Claus Lindbjerg Andersen  4   5 Dan A Landau  18   19
Affiliations

Ultrasensitive plasma-based monitoring of tumor burden using machine-learning-guided signal enrichment

Adam J Widman et al. Nat Med. 2024 Jun.

Abstract

In solid tumor oncology, circulating tumor DNA (ctDNA) is poised to transform care through accurate assessment of minimal residual disease (MRD) and therapeutic response monitoring. To overcome the sparsity of ctDNA fragments in low tumor fraction (TF) settings and increase MRD sensitivity, we previously leveraged genome-wide mutational integration through plasma whole-genome sequencing (WGS). Here we now introduce MRD-EDGE, a machine-learning-guided WGS ctDNA single-nucleotide variant (SNV) and copy-number variant (CNV) detection platform designed to increase signal enrichment. MRD-EDGESNV uses deep learning and a ctDNA-specific feature space to increase SNV signal-to-noise enrichment in WGS by ~300× compared to previous WGS error suppression. MRD-EDGECNV also reduces the degree of aneuploidy needed for ultrasensitive CNV detection through WGS from 1 Gb to 200 Mb, vastly expanding its applicability within solid tumors. We harness the improved performance to identify MRD following surgery in multiple cancer types, track changes in TF in response to neoadjuvant immunotherapy in lung cancer and demonstrate ctDNA shedding in precancerous colorectal adenomas. Finally, the radical signal-to-noise enrichment in MRD-EDGESNV enables plasma-only (non-tumor-informed) disease monitoring in advanced melanoma and lung cancer, yielding clinically informative TF monitoring for patients on immune-checkpoint inhibition.


Conflict of interest statement

Competing interests

DAL, AJW, CCK, and JB are listed as inventors on a pending patent application (WO2023018791A1), filed by Cornell University, that is directed to methods of detecting SNVs for the purposes of MRD detection and other plasma-based cancer monitoring. DAL, AJW, and MS are listed as inventors on a pending patent application (WO2023133093A1), filed by Cornell University, that is directed to methods of detecting CNVs for the purposes of MRD detection and other plasma-based cancer monitoring. APC is listed as an inventor on submitted patents pertaining to cell-free DNA (US patent applications 63/237,367, 63/056,249, 63/015,095, 16/500,929) and receives consulting fees from Eurofins Viracor. AS receives research funding from AstraZeneca, has served on Advisory Boards for AstraZeneca, Blueprint Medicines, and Jazz Pharmaceuticals, and has been a consultant for Genentech. MAP has received consulting fees from BMS, Chugai, Cancer Expert Now, Intellisphere, Merck, MJH associates, Nektar, Pfizer, Uptodate, WebMD, Erasca, and received institutional support from RGenix, Infinity, BMS, Merck, Genentech and Novartis. CLA reports collaborations with C2i Genomics and Natera. CS has received honoraria for advisory board participation from Pfizer, Novartis, Knight, Bayer, Merck, Roche, Lilly within the past two years. None of the honoraria have been in excess of $5000.00CAD and total for honoraria received is less than $25,000.00CAD. MKC has received consulting fees from BMS, Merck, InCyte, Moderna, ImmunoCore, and AstraZeneca and receives institutional support from BMS. ST is funded by Cancer Research UK (grant reference number A29911); the Francis Crick Institute, which receives its core funding from Cancer Research UK (FC10988), the UK Medical Research Council (FC10988), and the Wellcome Trust (FC10988); the National Institute for Health Research (NIHR) Biomedical Research Centre at the Royal Marsden Hospital and Institute of Cancer Research (grant reference number A109), the Royal Marsden Cancer Charity, The Rosetrees Trust (grant reference number A2204), Ventana Medical Systems Inc (grant reference numbers 10467 and 10530), the National Institute of Health (U01 CA247439) and Melanoma Research Alliance (Award Ref no 686061). ST has received speaking fees from Roche, Astra Zeneca, Novartis and Ipsen. ST has the following patents filed: Indel mutations as a therapeutic target and predictive biomarker PCTGB2018/051892 and PCTGB2018/051893. GMB has sponsored research agreements through her institution with: Olink Proteomics, Teiko Bio, InterVenn Biosciences, Palleon Pharmaceuticals. GMB served on advisory boards for: Iovance, Merck, Nektar Therapeutics, Novartis, and Ankyra Therapeutics. GMB consults for: Merck, InterVenn Biosciences, Iovance, and Ankyra Therapeutics. GMB equity in Ankyra Therapeutics. MB reports consulting for AstraZeneca, Eli Lilly, Paige.AI, research support from Boundless Bio, and intellectual property rights for SOPHiA Genetics. JDW is a consultant for: Apricity; Ascentage Pharma; AstraZeneca; BeiGene; Bicara Therapeutics; Bristol Myers Squibb; Daiichi Sankyo; Dragonfly; Imvaq; Larkspur; Psioxus, Recepta; Takeda; Tizona; Trishula Therapeutics; Sellas. JDW received Grant/Research Support from: Bristol Myers Squibb; Enterome. JDW has Equity in: Apricity, Arsenal IO/CellCarta; Ascentage; Imvaq; Linneaus, Larkspur; Georgiamune; Maverick; Tizona Therapeutics; Xenimmune. DAL received research support from Illumina, Inc. DAL participated in advisory boards Pangea, Mission Bio, Alethiomics. DAL is a scientific co-founder of C2i Genomics. The remaining authors declare no competing interests.

Figures

Extended Data Fig. 1:
Extended Data Fig. 1:. MRD-EDGESNV feature selection, model architecture and performance
a) Feature density plots for ctDNA and cfDNA SNV artifacts used in the MRD-EDGESNV NSCLC model. These fragments were subject to quality filters (Supplementary Table 2) to remove low quality SNV artifacts prior to this analysis. In this comparison, ctDNA SNV fragments are identified from consensus mutation calls in high-burden NSCLC plasma samples (Supplementary Table 1) and compared to cfDNA SNV fragments (sequencing errors) drawn from within the same plasma sample to preclude sample-specific biases when establishing predictive ability of individual features. b) SNV classification performance for different machine learning models. F1 score was assessed on tumor-confirmed melanoma ctDNA SNV fragments vs. cfDNA artifacts from healthy controls. Random subsamplings were drawn from the held-out melanoma validation set (Supplementary Table 1), which was split into tenths for this analysis. We compared performance between MRD-EDGESNV and its separate components (left), as well as to other ML architectures (right) c) Fragment-level ROC analysis for MRD-EDGESNV classifier for different cancer types. Performance is assessed on filtered fragments (~90% of low-quality cfDNA artifacts are excluded by quality filters) in held-out validation sets (Supplementary Table 1) for melanoma (blue), CRC (green), and NSCLC (red). Colored dots on curves indicate the tumor-informed decision threshold (0.5) used in each tumor type to classify individual SNV fragments as ctDNA or cfDNA artifact. d) Signal-to-noise enrichment analysis for MRDetect and for each step of the MRD-EDGESNV tumor-informed pipeline. Final pipeline enrichment is 118-fold for MRD-EDGESNV vs. 8.3-fold for MRDetectSNV in the same datasets.
Extended Data Fig. 2:
Extended Data Fig. 2:. Lower limit of detection studies with MRD-EDGESNV
a) In silico studies of cfDNA from the metastatic colorectal cancer sample CRC-863 mixed into cfDNA from a healthy plasma sample (CTRL-335) at mixing fractions TF = 10−6–10−3 at 29X coverage depth, performed in 30 technical replicates with independent sampling seeds. Tumor-informed MRD-EDGESNV enables sensitive detection of TF as low as 1*10−5 (AUC 0.80), measured by Z score of SNV detection rates against unmixed control plasma (TF=0, n=30 randomly chosen replicates). b) In silico studies of cfDNA from the metastatic small cell lung cancer sample SC-128_0w mixed into cfDNA from a healthy plasma sample (CTRL-216) at mixing fractions TF = 10−6–10−3 at 25X coverage depth, performed in 20 technical replicates with independent sampling seeds. Tumor-informed MRD-EDGESNV enables sensitive detection of TF as low as 5*10−6 (AUC 0.86), measured by Z score of SNV detection rates against unmixed control plasma (TF=0, n=20 randomly chosen replicates). Box plots represent median, lower and upper quartiles; whiskers correspond to 1.5 x interquartile range. An AUC heatmap measures detection vs. TF=0 at different mixed TFs. c) Sensitivity at 95% specificity for tumor-informed MRD-EDGESNV in silico studies in green) CRC, red) SCLC, and blue) melanoma. Mixed TF replicates were compared to TF=0 replicates by sample-level MRD-EDGESNV Z score. d-f) Detection performance vs. TF=0 at different mixed TFs for MRD-EDGESNV (blue) and MRDetectSNV SVM (gray). The AUC is measured by a sample Z score (positive label) compared to TF=0 distribution (negative label) for each replicate at each TF. Error bars represent 95% CI (DeLong AUC variance). (bottom) Normalized error for a subset of mixed TFs between MRD-EDGESNV and MRDetectSNV. Error bars represent 95% CI. Normalized error is shown for TFs where AUC is less than 1 and is measured as (TFestimated−TFmixed)/TFmixed. d) in silico CRC studies as defined in (a), e) in silico SCLC studies as defined in (b), f) In silico studies of cfDNA from the metastatic cutaneous melanoma sample MEL-100 mixed into cfDNA from a healthy plasma sample (CTRL-216) at mixing fractions TF = 10−7–10−4 at 16X coverage depth, performed in 20 technical replicates with independent sampling seeds.
Extended Data Fig. 3:
Extended Data Fig. 3:. Estimated tumor fractions in experimental mixing studies with MRD-EDGESNV
a) Plasma TF inference with MRD-EDGESNV using genome-wide SNV integration for in vitro dilutions of the pretreatment melanoma plasma MEL-137_A in expired plasma harvested through plasmapheresis from a donor without known cancer. Dilutions were performed in 2 replicates, and a mean noise rate for the patient-specific mutation profile was drawn from n=17 concurrently sequenced SCLC plasma samples (Supplementary Table 5). b) MRD-EDGESNV (left) and MRDetectSNV (right) Z score discrimination between ctDNA detected in experimental plasma replicates (blue dots, replicate 1, and green dots, replicate 2) from the patient MEL-137 and downsampled TF=0 replicates (white boxes, n=30, 15 downsampled alignment files from 2 TF=0 replicates). Signal is measured from SNV detection rates on patient plasma and the downsampled TF=0 plasma samples using the patient-specific SNV profile for MEL-137. Positive ctDNA detection (dotted blue line) was defined as patient plasma MRD-EDGESNV or MRDetectSNV Z score above a detection threshold of 95% specificity against downsampled TF=0 plasma in the ROC for each platform (Supplementary Table 4). Sample-level Z scores were capped at 10 to allow greater visibility of Z scores around the detection threshold.
Extended Data Fig. 4:
Extended Data Fig. 4:. In silico mixing studies of MRD-EDGECNV in CRC, NSCLC, and melanoma
a,b) In silico mixing studies in which high TF plasma samples were admixed into non-cancer plasma (a) or low TF plasma samples (b). Admixtures model tumor fractions of 10−6–10−3 (see Methods for detailed description of in silico admixture process). Box plots represent median, lower and upper quartiles; whiskers correspond to 1.5 x interquartile range. An AUC heatmap demonstrates detection performance vs. TF=0 at different mixed TFs as measured by a sample Z score (derived from summed read-depth skews for read depth classifier, BAF score for BAF classifier, summed fragment length entropy for fragment length entropy classifier, Methods) compared to TF=0 distribution for each replicate. a) Pretreatment NSCLC plasma from the patient NSCLC-45 was mixed into non-cancer control plasma from the patient CTRL-206 in 25 technical replicates (each subsampling seed represents a technical replicate). The read depth (left) and fragment length entropy (right) classifiers demonstrate similar performance in pretreatment NSCLC admixtures compared to CRC admixtures (Fig. 2b–d). (middle) Pretreatment melanoma plasma from the patient MEL-12 was mixed into posttreatment plasma following a major response to immunotherapy in 25 technical replicates. The BAF classifier demonstrates similar performance compared to CRC admixtures (Fig. 2c) and accounts for bias that may be encountered when mixing plasma into matched peripheral blood mononuclear cell (PBMC) normal, as performed in CRC. b) Z scores for the read depth classifier in neutral regions (no copy number gain or loss in the matched tumor WGS data) for NSCLC demonstrates the expected absence of directional read depth skew in copy neutral regions. c) Assessment of preoperative plasma, post adjuvant plasma, and matched normal (from PBMCs) BAF in SNPs before (left) and after (right) SNP quality filters in CRC (patient CRC-465). Filters include mapping bias correction and outlier exclusion criteria (Methods). BAF signal is calculated through least squares linear regression on SNPs from LOH regions identified in matched tumor WGS, accounting for underlying copy number state in tumors (Methods). To demonstrate the relationship between signal and phased SNPs, the major allele in plasma is randomly permuted to be in phase or out of phase at the percentage specified along the x axis. Following quality filtering, signal can be appropriately inferred and demonstrates the expected relationship between preoperative plasma (highest signal), postoperative MRD (intermediate signal), and PBMC BAF (minimal signal).
Extended Data Fig. 5:
Extended Data Fig. 5:. Clinical performance of tumor-informed MRD-EDGE in stage III perioperative colorectal cancer
a) (left) ROC analysis on MRD-EDGE (blue), a combined detection model of SNV and CNV mutation profiles, and MRDetect (gray) in preoperative stage III CRC. Preoperative plasma samples with matched tumor mutation profiles (n=15, Supplementary Table 5) are compared with control plasma samples assessed against all unmatched stage III CRC tumor mutation profiles (n=15 tumor profiles assessed across 25 control samples from Aarhus controls cohort, n=375 control-comparisons). Twenty control samples included in SNV model training and / or used in the MRD-EDGECNV read depth panel of normals were withheld from this analysis. (middle) ROC analysis with MRD-EDGESNV (blue), and MRDetectSNV (gray). Preoperative plasma samples with matched tumor mutation profiles (n=15) are compared with unmatched control plasma samples assessed against all unmatched stage III CRC tumor mutation profiles (n=15 tumor profiles assessed across 40 control samples from Aarhus controls cohort, n=600 control-comparisons). Five control samples included in SNV model training were withheld from this analysis. (right) ROC analysis with MRD-EDGECNV (blue), and MRDetectCNV (gray). Preoperative plasma sample CNV-based Z scores (n=15) are compared against control plasma samples assessed against all unmatched stage III CRC tumor mutation profiles (n=15 tumor profiles assessed across 25 control samples from Aarhus controls cohort, n=375 control-comparisons). Twenty control samples included in the read depth panel of normals were withheld from this analysis. b) Cross-patient ROC analysis on preoperative stage III CRC plasma samples for MRD-EDGESNV demonstrates similar performance to control (non-cancer) plasma. Preoperative plasma samples with matched tumor profiles (n=15) are compared with stage III CRC plasma samples assessed against all unmatched stage III CRC tumor profiles (n=15 tumor profiles assessed across 14 cross-patient samples, n=210 cross-comparisons). c) ROC analysis performed on CNV-based Z-score values for read depth (left), BAF (middle), and fragment length entropy (right) CNV classifiers in preoperative stage III CRC. Preoperative plasma samples with matched tumor profiles (n=15) are compared with control plasma samples assessed against all unmatched tumor profiles (n=375 comparisons for read depth, 15 tumor profiles assessed across 25 control samples; n=675 comparisons for BAF and fragment length entropy, 15 tumor profiles assessed across 45 control samples). Twenty control samples included in the read depth panel of normal samples were withheld from read-depth analysis.
Extended Data Fig. 6:
Extended Data Fig. 6:. Comparison of MRD-EDGE and MRDetect in preoperative, pretreatment NSCLC
a) (left) ROC analysis of NSCLC plasma samples for MRD-EDGE (blue) and MRDetect (gray). NSCLC plasma samples with matched tumor profiles (n=22 samples, Supplementary Table 5) are compared with control plasma samples assessed against all unmatched NSCLC tumor mutation profiles (n=22 tumor profiles assessed across 20 control samples from NYGC controls cohort, n=440 control-comparisons). (middle) ROC analysis of NSCLC plasma samples for MRD-EDGESNV (blue) and MRDetectSNV (gray). NSCLC plasma samples with matched tumor profiles (n=22, Supplementary Table 5) are compared with control plasma samples assessed against all unmatched NSCLC tumor mutation profiles (n=22 tumor profiles assessed across 40 control samples from NYGC controls cohort, n=660 control-comparisons). Five patients used in MRD-EDGESNV NSCLC model training were excluded from downstream analysis. (right) ROC analysis of NSCLC plasma samples for MRD-EDGECNV (blue) and MRDetectCNV (gray). NSCLC plasma samples with matched tumor profiles (n=22, Supplementary Table 5) are compared against control plasma samples assessed against all unmatched NSCLC tumor mutation profiles (n=22 tumor profiles assessed across 20 control samples from NYGC controls cohort, n=440 control-comparisons). Fifteen patients used in the read depth panel of normal samples were excluded from downstream analysis. b) Cross-patient ROC analysis on pretreatment NSCLC tumor profiles for MRD-EDGESNV demonstrates similar performance to control (non-cancer) plasma. Preoperative plasma samples with matched tumor profiles (n=22) are compared with NSCLC plasma samples assessed against all unmatched NSCLC tumor profiles (n=22 tumor profiles assessed across 21 cross-patient samples, n=462 cross-comparisons). c) ROC analysis performed on CNV-based Z-score values for read depth (left), BAF (middle), and fragment length entropy (right) CNV classifiers in preoperative stage III CRC. Preoperative plasma samples with matched tumor profiles (n=22) are compared with control plasma samples assessed against all unmatched tumor profiles (n=440 comparisons for read depth, 22 tumor profiles assessed across 20 control samples; n=770 comparisons for BAF and fragment length entropy, 22 tumor profiles assessed across 35 control samples). Twenty control samples included in the read depth panel of normal samples were withheld from read-depth analysis.
Extended Data Fig. 7:
Extended Data Fig. 7:. MRD-EDGE detection of ctDNA from colorectal pT1 carcinomas and adenomas
a) Cross-patient ROC analysis for MRD-EDGESNV in screen-detected pT1 lesions (left) and adenomas (right). Preoperative plasma samples with matched tumor mutation profiles are compared with a cross-patient panel of plasma samples assessed against all unmatched cross-patient tumor profiles (n=44, including 29 pT1 and adenoma cross patients and 15 stage III preoperative patients). b) Tumor resection volume for adenoma samples in which ctDNA was detected (orange) and non-detected (blue). Box plots represent median, bottom and upper quartiles; whiskers correspond to 1.5 x interquartile range.
Extended Data Fig. 8:
Extended Data Fig. 8:. Use of MRD-EDGESNV in acral melanoma and monitoring response to immunotherapy with MRD-EDGESNV
a) ctDNA detection rates for pretreatment cutaneous melanoma samples from the adaptive dosing cohort (n=26, orange, detection rate was capped at 0.0005) compared to acral melanoma samples (n=3, blue, pre- and posttreatment timepoints from one patient with acral melanoma) sequenced within the same batch and flow cell and detection rates as healthy control plasma (n=30, gray). ctDNA is not detected from acral melanoma plasma, demonstrating absence of batch effect and the specificity of MRD-EDGESNV for the UV signatures associated specifically with cutaneous melanoma. b) Forest plot demonstrating relationship between ctDNA TF trend (increase or decrease) and progression-free survival (PFS) and overall survival (OS) at serial posttreatment timepoints. MRD-EDGESNV TF estimates are measured as a detection rate normalized to the pretreatment sample (normalized detection rate, nDR). Each posttreatment timepoint is prognostic of PFS outcomes. HR, hazard ratio. c) (left) Kaplan–Meier overall survival analysis for Week 6 RECIST response (n=10 partial response, ‘PR’, n=8 stable disease, ‘SD’, n=6 progressive disease, ‘PD’) in the adaptive dosing melanoma cohort (n=26 patients) where CT imaging was available at Week 6 shows no significant relationship with OS (multivariate logrank test). (right) Kaplan–Meier OS analysis for Week 6 ctDNA trend in adaptive dosing melanoma patients with decreased (n=17) or increased (n=5) nDR compared to pretreatment timepoint as measured by MRD-EDGESNV. Patients with undetectable pretreatment ctDNA (n=2) were excluded from the analysis, as were 2 patients where Week 6 plasma was not available for analysis. Increased nDR at Week 6 was associated with shorter overall survival (two-sided log-rank test).
Extended Data Fig. 9:
Extended Data Fig. 9:. Use of MRD-EDGESNV to monitor response to ICI in small cell lung cancer
a) In silico studies of cfDNA from the SCLC sample SC-128 (pretreatment TF = 22.9%) mixed in n=20 replicates against cfDNA from a healthy plasma sample (TF=0) at mix fractions 10−5–10−2 at 25X coverage depth. MRD-EDGESNV enables sensitive detection of TF as low as TF=5*10−4 (AUC 0.72), measured by Z score of SNV fragment detection rate against unmixed control plasma (TF=0, n=20 randomly chosen replicates), without matched tumor tissue to guide SNV identification. Box plots represent median, bottom and upper quartiles; whiskers correspond to 1.5 x interquartile range. An AUC heatmap measures detection vs. TF=0 at different mixed TFs. B) ROC analysis on detection rates for MRD-EDGESNV (blue) and TF estimation with ichorCNA (gray) in pretreatment SCLC plasma samples (Supplementary Table 7). Fragment detection rates in SCLC plasma samples (n=16 plasma samples, Supplementary Table 5) were compared with fragment detection rates in control plasma samples (n=30). C) Kaplan–Meier progression-free survival analysis for Week 3 ctDNA trend in SCLC patients with decreased (n=7) or increased (n=3) normalized detection rate (nDR) as measured by MRD-EDGESNV. Increased nDR at Week 3 was associated with shorter progression-free survival (two-sided log-rank test).
Figure 1:
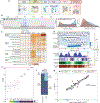
Figure 1:. MRD-EDGESNV deep learning classifier distinguishes ctDNA SNV fragments from cfDNA artifacts
a) MRD-EDGE schematic. b) Selected feature density plots for ctDNA and cfDNA SNV artifacts: trinucleotide context (left), replication timing (middle), PCAWG (right). c) Heatmap of predictive power of selected features (Methods) measured by single variable area under the receiver operating curve (svAUC, Methods) in NSCLC, CRC, and melanoma. Feature use in MRDetect or MRD-EDGESNV is indicated. d) (top) Illustration of the fragment tensor, an 18×240 matrix encoding of the reference sequence, R1 and R2 read pairs, R1 and R2 read length, and SNV position in the fragment (‘Alt position’). The fragment tensor is passed as input to a convolutional neural network (CNN). (bottom) Relationship between local ctDNA SNV mutation density at the chromosome level and regional features: cancer type-specific chromatin inaccessibility (ATAC-Seq), late replicating regions (Replication timing) and quiescent genomic regions (Chromatin state) are associated with increased density of tumor-confirmed ctDNA SNVs. Regional features (Supplementary Table 2) are encoded as tabular values and passed as input to a multilayer perceptron (MLP). An ensemble classifier takes input from both the fragment and regional models to determine the likelihood that each fragment is ctDNA or cfDNA SNV artifact. e) In silico studies of cfDNA from the metastatic cutaneous melanoma sample MEL-100 mixed into cfDNA from a healthy plasma sample (CTRL-216) at mix fractions TF = 10−7–10−4 at 16X coverage depth, performed in 20 technical replicates with independent sampling seeds. An AUC heatmap demonstrates detection performance at the different admixed TFs vs. negative controls (TF=0) as measured by Z score, with tumor-informed MRD-EDGESNV enabling sensitive detection at TF=5*10−7 (AUC 0.70). Box plots represent median, lower and upper quartiles; whiskers correspond to 1.5 x interquartile range. f) ctDNA detection status of preoperative stage III CRC plasma samples analyzed by MRD-EDGESNV and ddPCR (n = 48). g) Comparison of estimated ctDNA levels estimated by MRD-EDGESNV (TFs) and ddPCR (variant allele frequency, VAF). Estimated TFs/VAFs of ctDNA-negative samples were set to 0. Linear regression includes samples called positive by both ddPCR and MRD-EDGESNV (black dots). Shaded area represents 95% confidence interval.
Figure 2:
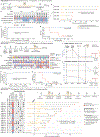
Figure 2:. Machine learning-based error suppression and additional features enhance plasma WGS-based CNV detection sensitivity
a) (left) Copy number denoising for inference of plasma read depth. Patient-specific CNV segments are selected by comparing tumor and germline WGS. In plasma, CNV segments may be obscured within noisy raw read depth profiles. Machine-learning guided denoising using a panel of normal (PON) healthy control plasma samples removes recurrent background noise to produce denoised plasma read depth profiles. PON plasma samples are excluded from downstream CNV analysis. (middle) Loss of heterozygosity (LOH) can be measured via changes in the B-allele frequency of SNPs in cfDNA. (right) Increased or decreased fragment length heterogeneity is expected in regions of tumor amplifications or deletions, respectively, due to varying contribution of ctDNA (shorter fragment size) to the plasma cfDNA pool. Fragment length heterogeneity is measured through Shannon’s entropy of fragment insert sizes. b-e) In silico mixing studies of admixed high and low TF samples from the CRC patient CRC-930. Pretreatment plasma (TF = 12%) was mixed into non-cancer plasma (CTRL-443, b and d) or matched PBMC (c) in 25 replicates. Admixtures model tumor fractions of 10−6–10-3. Box plots represent median, lower and upper quartiles; whiskers correspond to 1.5 x interquartile range. An AUC heatmap demonstrates detection performance at the different admixed TFs vs. negative controls (TF=0), measured by Z score (derived from summed read-depth skews for read depth classifier, BAF score for BAF classifier, summed fragment length entropy for fragment length entropy classifier, Methods). b) Read depth classifier demonstrates detection sensitivity above TF=0 as low as 5*10−5 (AUC 0.92). c-d) SNP B-allele frequency (BAF) (c) and fragment length entropy (d) classifiers demonstrate detection sensitivity at 5*10−5 (AUC 0.95 and 0.73, respectively). e) Measurement of the MRD-EDGECNV lower limit of detection for the combined feature set as a function of the CNV load and admixture modeled TF. Sensitive detection (AUC 0.70) is observed at TF = 5*10−5 at 200 Mb. Control row is shown for an additional 25 TF=0 seeds held out from downsampling analysis. AUCs were confined to a range of 0.50–1.00.
Figure 3:
Figure 3:. Tumor-informed monitoring of minimal residual disease in perioperative, neoadjuvant, and recurrent disease settings
a) Perioperative colorectal cancer ctDNA assessment. Plasma TF is tracked prior to surgery, and after surgery and adjuvant chemotherapy. b) Clinical characteristics and detection status of the stage III CRC cohort. c) ROC analysis on MRD-EDGE in preoperative stage III CRC with matched tumor mutation profiles (n=15) compared to control plasma samples assessed against all unmatched stage III CRC tumor mutation profiles (n=15 tumor profiles assessed across 25 control samples from Aarhus controls cohort, n=375 control-comparisons). d) Kaplan–Meier disease-free survival analysis of all patients with detected (n=9) and non-detected (n=6) postoperative ctDNA. Postoperative ctDNA detection was associated with shorter recurrence-free survival (two-sided log-rank test). e) Time to recurrence in stage III CRC patients with disease recurrence (n=5) after ctDNA detection post-therapy (green dot). Red dot indicates confirmed recurrence on CT imaging. f) Neoadjuvant NSCLC clinical treatment protocol. Plasma TF is tracked in the preoperative period to evaluate for response to SBRT and ICI (durvalumab) therapy and after surgery to evaluate for MRD. g) Clinical characteristics and detection status of the neoadjuvant NSCLC cohort (n=22 patients). h) ROC analysis on MRD-EDGE in pretreatment early-stage NSCLC. Preoperative plasma samples with matched tumor mutation profiles (n=22) are compared with control samples assessed against all unmatched NSCLC tumor mutation profiles (n=22 mutation profiles assessed across 20 control samples from NYGC control cohort, n=440 control-comparisons). i) Tumor burden monitoring on neoadjuvant immunotherapy and SBRT with MRD-EDGESNV (blue) and MRD-EDGECNV (orange) Tumor burden estimates are measured as the Z score of the patient tumor mutation profile against healthy control plasma. j) Tumor burden monitoring with MRD-EDGESNV and MRD-EDGECNV in 2 NSCLC patients on neoadjuvant ICI monotherapy (top, NSCLC-40; bottom, NSCLC-41). Red dot indicates recurrence; black dot indicates absence of recurrence at last known follow-up. k) Kaplan–Meier disease-free survival analysis of all patients with detected (n=8) and non-detected (n=6) postoperative ctDNA. Postoperative ctDNA detection was associated with shorter recurrence-free survival (two-sided log-rank test). i) Observational TNBC recurrence cohort. Early-stage TNBC patients underwent surgical resection plus neoadjuvant and/or adjuvant chemotherapy. Plasma was sampled intermittently throughout clinical course. m) (left) Clinical characteristics and sampling timepoints for the observational TNBC recurrence cohort (n=18 patients). (right) Lead-time calculations for ctDNA detection post-therapy (green dot) versus clinical recurrence (red dot). Where available, purple dot shows ctDNA detection after surgery or initiation of chemotherapy.
Figure 4:
Figure 4:. MRD-EDGE tumor-informed detection of ctDNA from screen-detected adenomas and pT1 lesions
a) Detection status of the cohort of stage IV colorectal (CRC, n=5), screen-detected pT1 lesions (n=10) and screen-detected adenoma plasma samples (n=20) according to MRD-EDGESNV and MRD-EDGECNV classifiers. Samples with a Z score above the detection threshold as prespecified in the stage III CRC cohort (Fig. 3a–b) are highlighted (Supplementary Table 7). b) ROC analysis for MRD-EDGESNV (top) and MRD-EDGECNV (bottom) classifiers in screen-detected pT1 lesions (left) and adenomas (right) compared to cancer-free control plasma samples. The SNV analysis excluded 5 Aarhus control samples (n=45 total Aarhus control plasma samples) used in SNV model training, yielding n=40 controls as a comparator. The CNV analysis excluded 20 Aarhus control samples used in the panel of normal samples, yielding n=25 control samples as a comparator. c) Plasma TF inference using genome-wide SNV integration for stage IV CRC (n=5), stage III CRC (n=15), SNV detected pT1 lesions (n=5), and SNV detected adenomas (n=4) shows decreasing estimated TF by CRC stage. Lines indicate median estimated TF. d) (left) Histology image of the pT1 lesion Aden-14 (top) demonstrates invasion of the submucosa by dysplastic cancer cells, while an image of the adenoma Aden-17 (bottom) demonstrates the presence of dysplasia and absence of submucosal invasion. (right) Barplots demonstrate number of plasma samples with detected ctDNA in patients with pT1 lesions (top) and adenomas (bottom). Detections are shaded by dark blue (MRD-EDGESNV detections), light blue (MRD-EDGECNV detections), light purple (SNV and CNV detections), and white (non-detected).
Figure 5:
Figure 5:. ctDNA detection in melanoma plasma WGS without matched tumor
a) In silico mixing of cfDNA from metastatic melanoma sample MEL-100 (TF = 6.1%) into control cfDNA (TF=0) at mix fractions 10−6–10−3 at 16X coverage depth (20 technical replicates). MRD-EDGESNV detects TF as low as TF=5*10−5 (AUC 0.77), measured by Z score of SNV fragment detection rates against unmixed control plasma (TF=0), without matched tumor tissue. AUC heatmap measures detection vs. TF=0 at different mixed TFs. b) Signal-to-noise enrichment analysis for MRDetectSNV and staged steps of MRD-EDGESNV using the same in silico mixing replicates as in a). MRD-EDGESNV produces 2,518-fold enrichment vs. 8.3-fold for MRDetectSNV. c) Adaptive dosing melanoma cohort (n=26 patients). All patients began treatment with combination ipilimumab and nivolumab. d) ROC analysis for MRD-EDGESNV detection of pretreatment melanoma for healthy individuals (n=30) and melanoma patients (n=25). Detection rate cutoff was selected as the first operational point with specificity ≥ 95%. e) Fourteen of 26 melanoma patients underwent tumor-informed targeted panel sequencing. Barplot demonstrates pretreatment detection sensitivity for MRD-EDGESNV, tumor-informed panel, de novo panel (Methods) and ichorCNA. Error bars indicate 95% binomial confidence interval for empiric sensitivity within 14 trials. f) Tumor burden monitoring on ICI with MRD-EDGESNV, tumor-informed panel, and de novo panel for 3 melanoma patients, measured as normalized detection rate (nDR) to the pretreatment sample (MRD-EDGESNV) and as normalized variant allele fraction (nVAF) normalized to the pretreatment VAF (tumor-informed and de novo panels). Blue name indicates samples with ≥14 SNVs covered in the tumor-informed panel. g) Forty-three pre- and posttreatment samples from the melanoma cohort underwent sequencing with MRD-EDGESNV and the tumor-informed panel. (left) Heatmap demonstrating high concordance (88%) between MRD-EDGESNV and the tumor-informed panel for detected ctDNA and undetectable ctDNA. (right) Lower detection overlap (60%) is seen between MRD-EDGESNV and the de novo targeted panel. h) Barplot of Cohen’s kappa agreement metric for Week 6 ctDNA increase or decrease compared to pretreatment baseline between 3 mutation callers (MRD-EDGESNV, de novo panel, ichorCNA) and the tumor-informed panel. Box plots- median, bottom and upper quartiles; whiskers- 1.5 x interquartile range.
Figure 6:
Figure 6:. Serial monitoring of clinical response to immunotherapy with MRD-EDGESNV
a) Two advanced melanoma cohorts. (left) conventional immunotherapy cohort received nivolumab monotherapy or combination ICI. Plasma was collected at pretreatment timepoint and weeks 3, 6, and 12. Cross sectional imaging to evaluate response to treatment was performed at 12 weeks. (right) adaptive dosing cohort received combination immunotherapy as in Fig. 5c. b) Serial plasma TF monitoring with MRD-EDGESNV corresponds to changes seen on imaging. TF estimates are measured as normalized detection rate (nDR) to the pretreatment sample for MRD-EDGESNV. (top) ctDNA nDR increases over time in a patient with disease refractory to ICI. The patient had progressive disease at Week 6 and Week 12 CT assessment. (bottom) ctDNA nDR decreased at Week 3 in a patient with a partial response to therapy. CT imaging demonstrates tumor shrinkage at Week 6 and Week 12. c) Kaplan–Meier progression-free (left) and overall (right) survival analysis for Week 3 ctDNA trend in patients with decreased (n=27) or increased (n=7) nDR, measured by MRD-EDGESNV. Patients with undetectable pretreatment ctDNA (n=3) were excluded. Increased nDR at Week 3 was associated with shorter progression-free and overall survival (two-sided log-rank test). d) (top left) pretreatment CT imaging of a patient with decreased ctDNA in response to ICI at Week 3 on both MRD-EDGESNV (nDR, blue) and a tumor-informed panel (normalized variant allele frequency, nVAF, red). Following the administration of methylprednisone at Week 3, estimated TF (eTF) on both ctDNA detection platforms increased. At Week 6, progressive disease is seen on CT imaging (top right). e) Early steroids for immune-related adverse events (irAEs) within the combination ICI dosing period (prior to Week 8) further stratify Week 3 survival analyses. Kaplan–Meier progression-free survival (left) and overall survival (right) analysis for patients with primary refractory disease (‘Increased’, blue, n=7), defined as rising nDR seen at Week 3 following first dose of treatment, decreasing ctDNA who did not receive steroids (‘Decreased - no steroids’, red, n=18), and patients who received steroids for irAEs within the combination ICI dosing period (‘Decreased - steroids’, green, n=9). P value reflects multivariate logrank test.

Similar articles

Cited by

References

    1. Powles T et al. ctDNA guiding adjuvant immunotherapy in urothelial carcinoma. Nature (2021) doi:10.1038/s41586-021-03642-9. - DOI - PubMed
    1. Bratman SV et al. Personalized circulating tumor DNA analysis as a predictive biomarker in solid tumor patients treated with pembrolizumab. Nature Cancer 1, 873–881 (2020). - PubMed
    1. Tie J et al. Circulating Tumor DNA Analysis Guiding Adjuvant Therapy in Stage II Colon Cancer. N. Engl. J. Med. 386, 2261–2272 (2022). - PMC - PubMed
    1. Phallen J et al. Direct detection of early-stage cancers using circulating tumor DNA. Sci. Transl. Med. 9, (2017). - PMC - PubMed
    1. Newman AM et al. An ultrasensitive method for quantitating circulating tumor DNA with broad patient coverage. Nat. Med. 20, 548–554 (2014). - PMC - PubMed

MeSH terms

LinkOut - more resources