. 2024 Jul;6(7):1310-1328.
doi: 10.1038/s42255-024-01066-z. Epub 2024 Jun 14.

Concurrent loss of LKB1 and KEAP1 enhances SHMT-mediated antioxidant defence in KRAS-mutant lung cancer

Affiliations

Concurrent loss of LKB1 and KEAP1 enhances SHMT-mediated antioxidant defence in KRAS-mutant lung cancer

Hyun Min Lee et al. Nat Metab. 2024 Jul.

Abstract

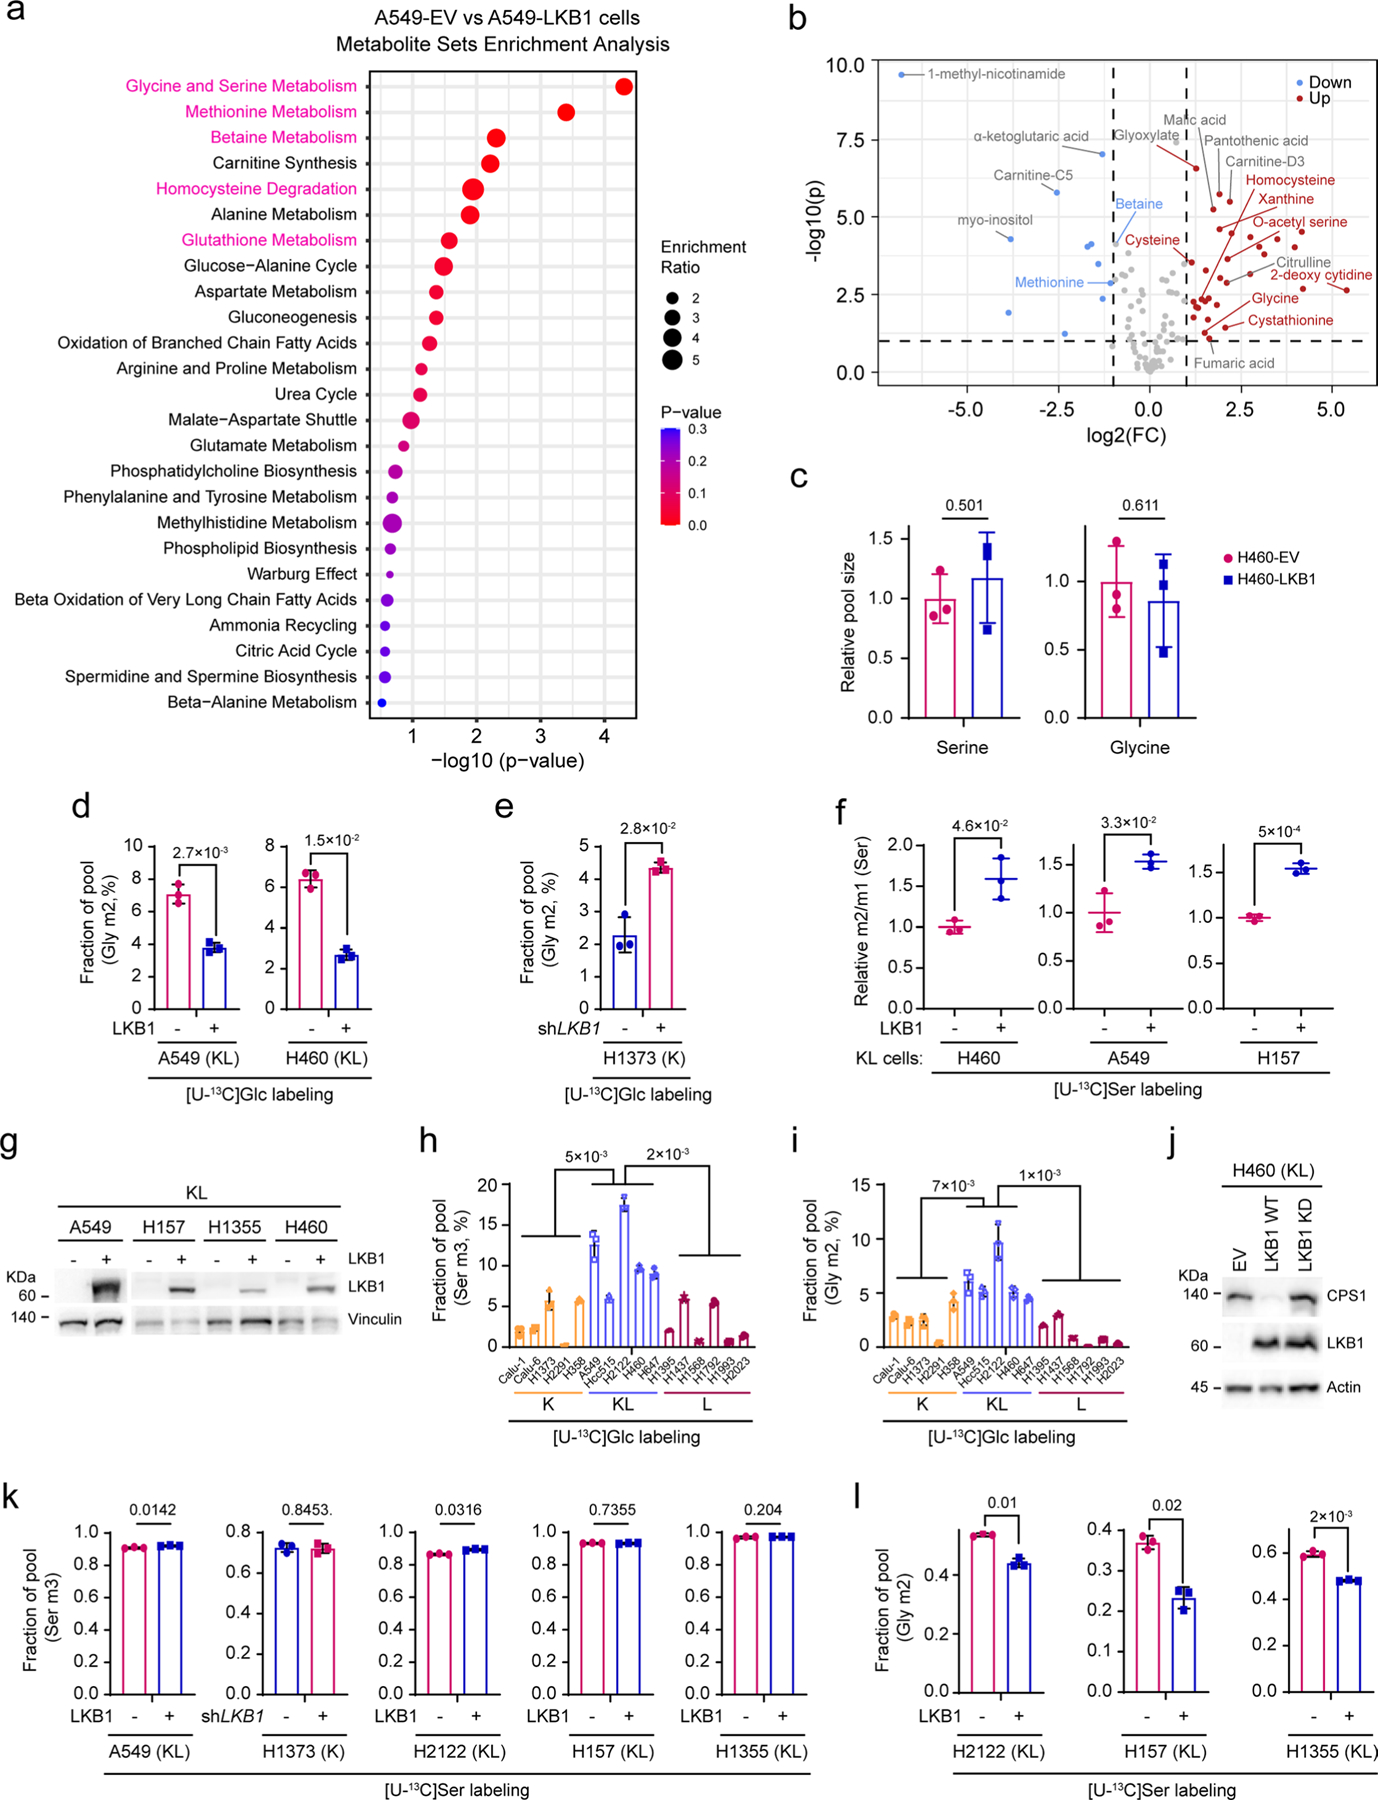
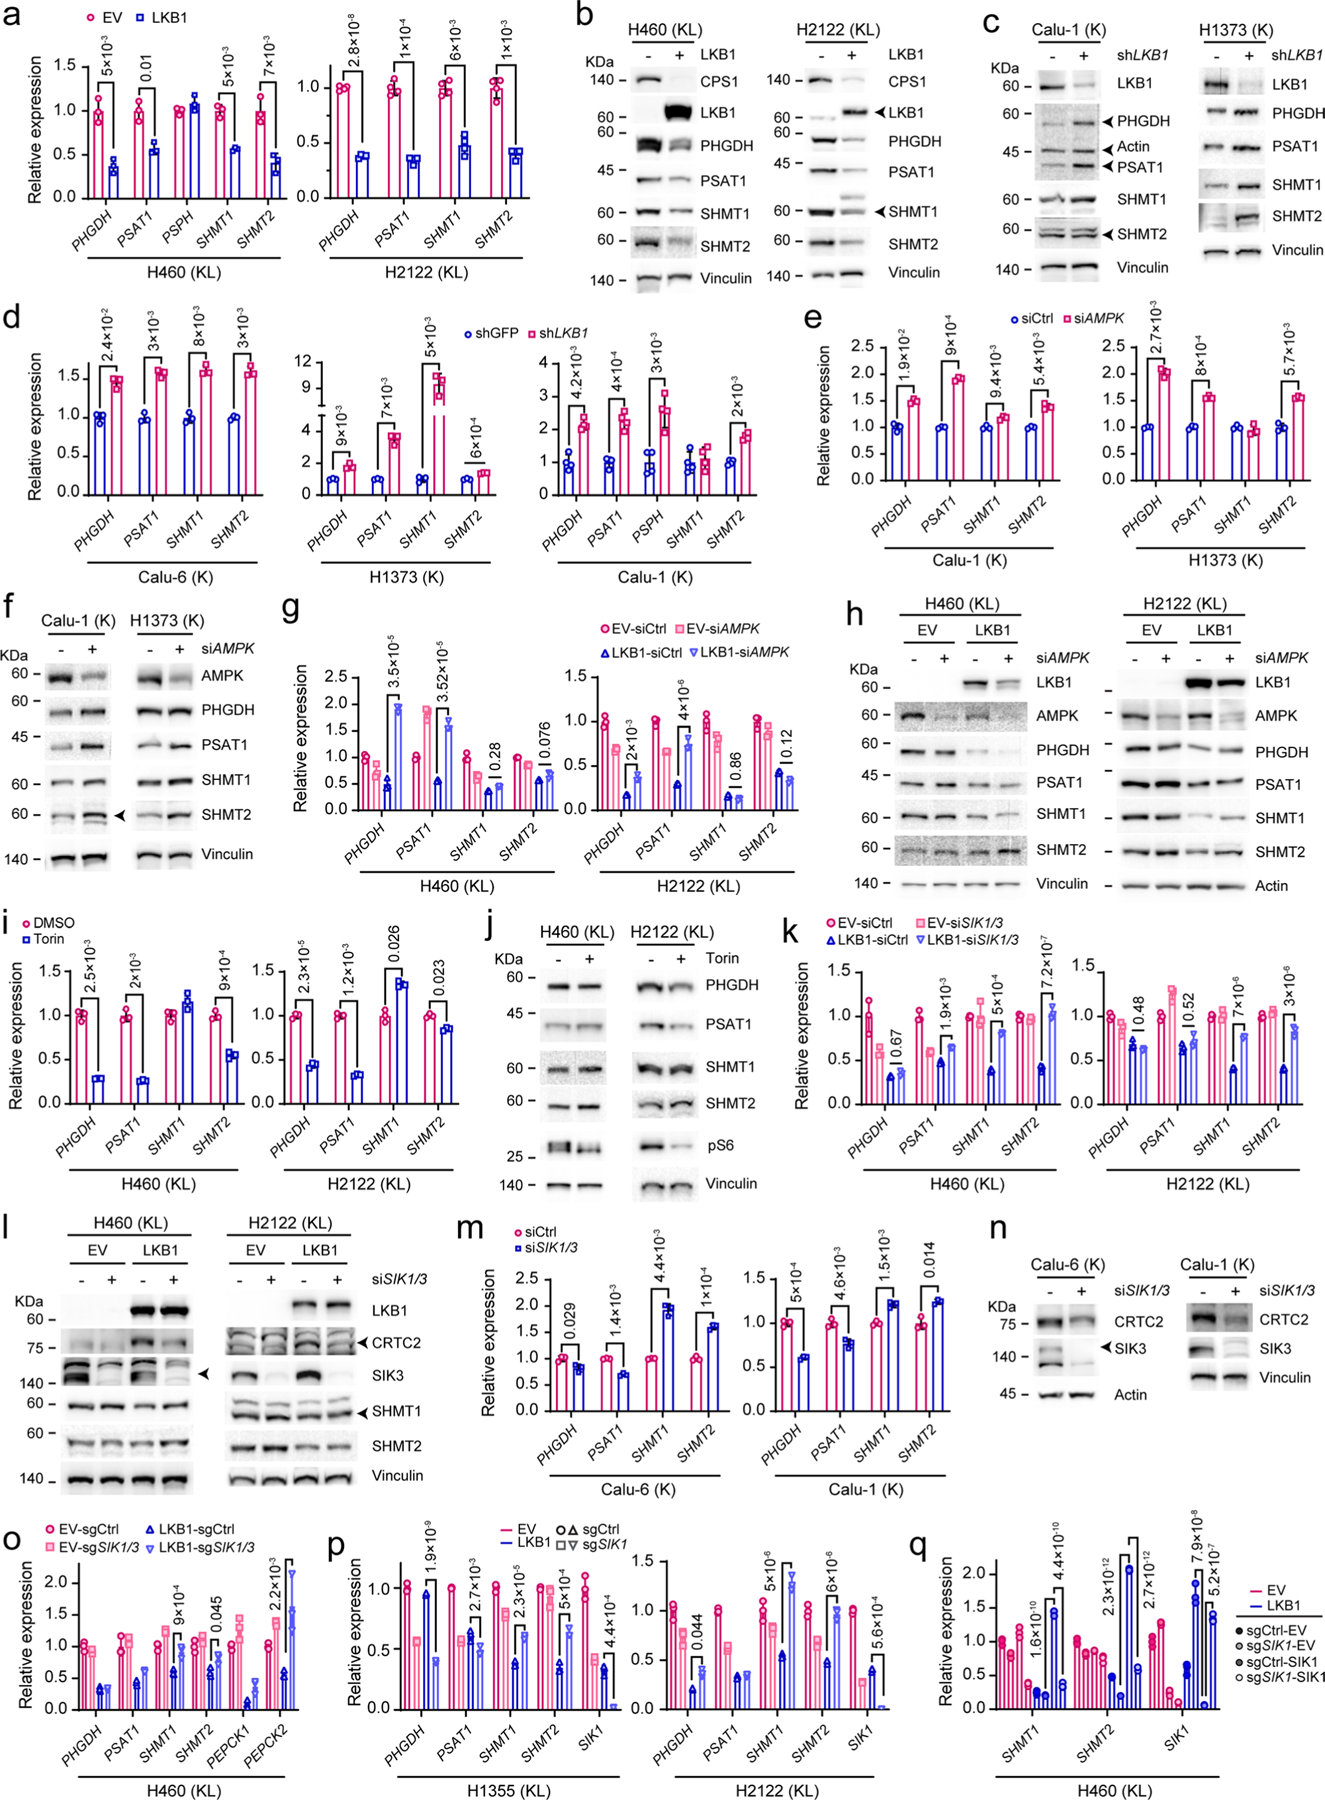
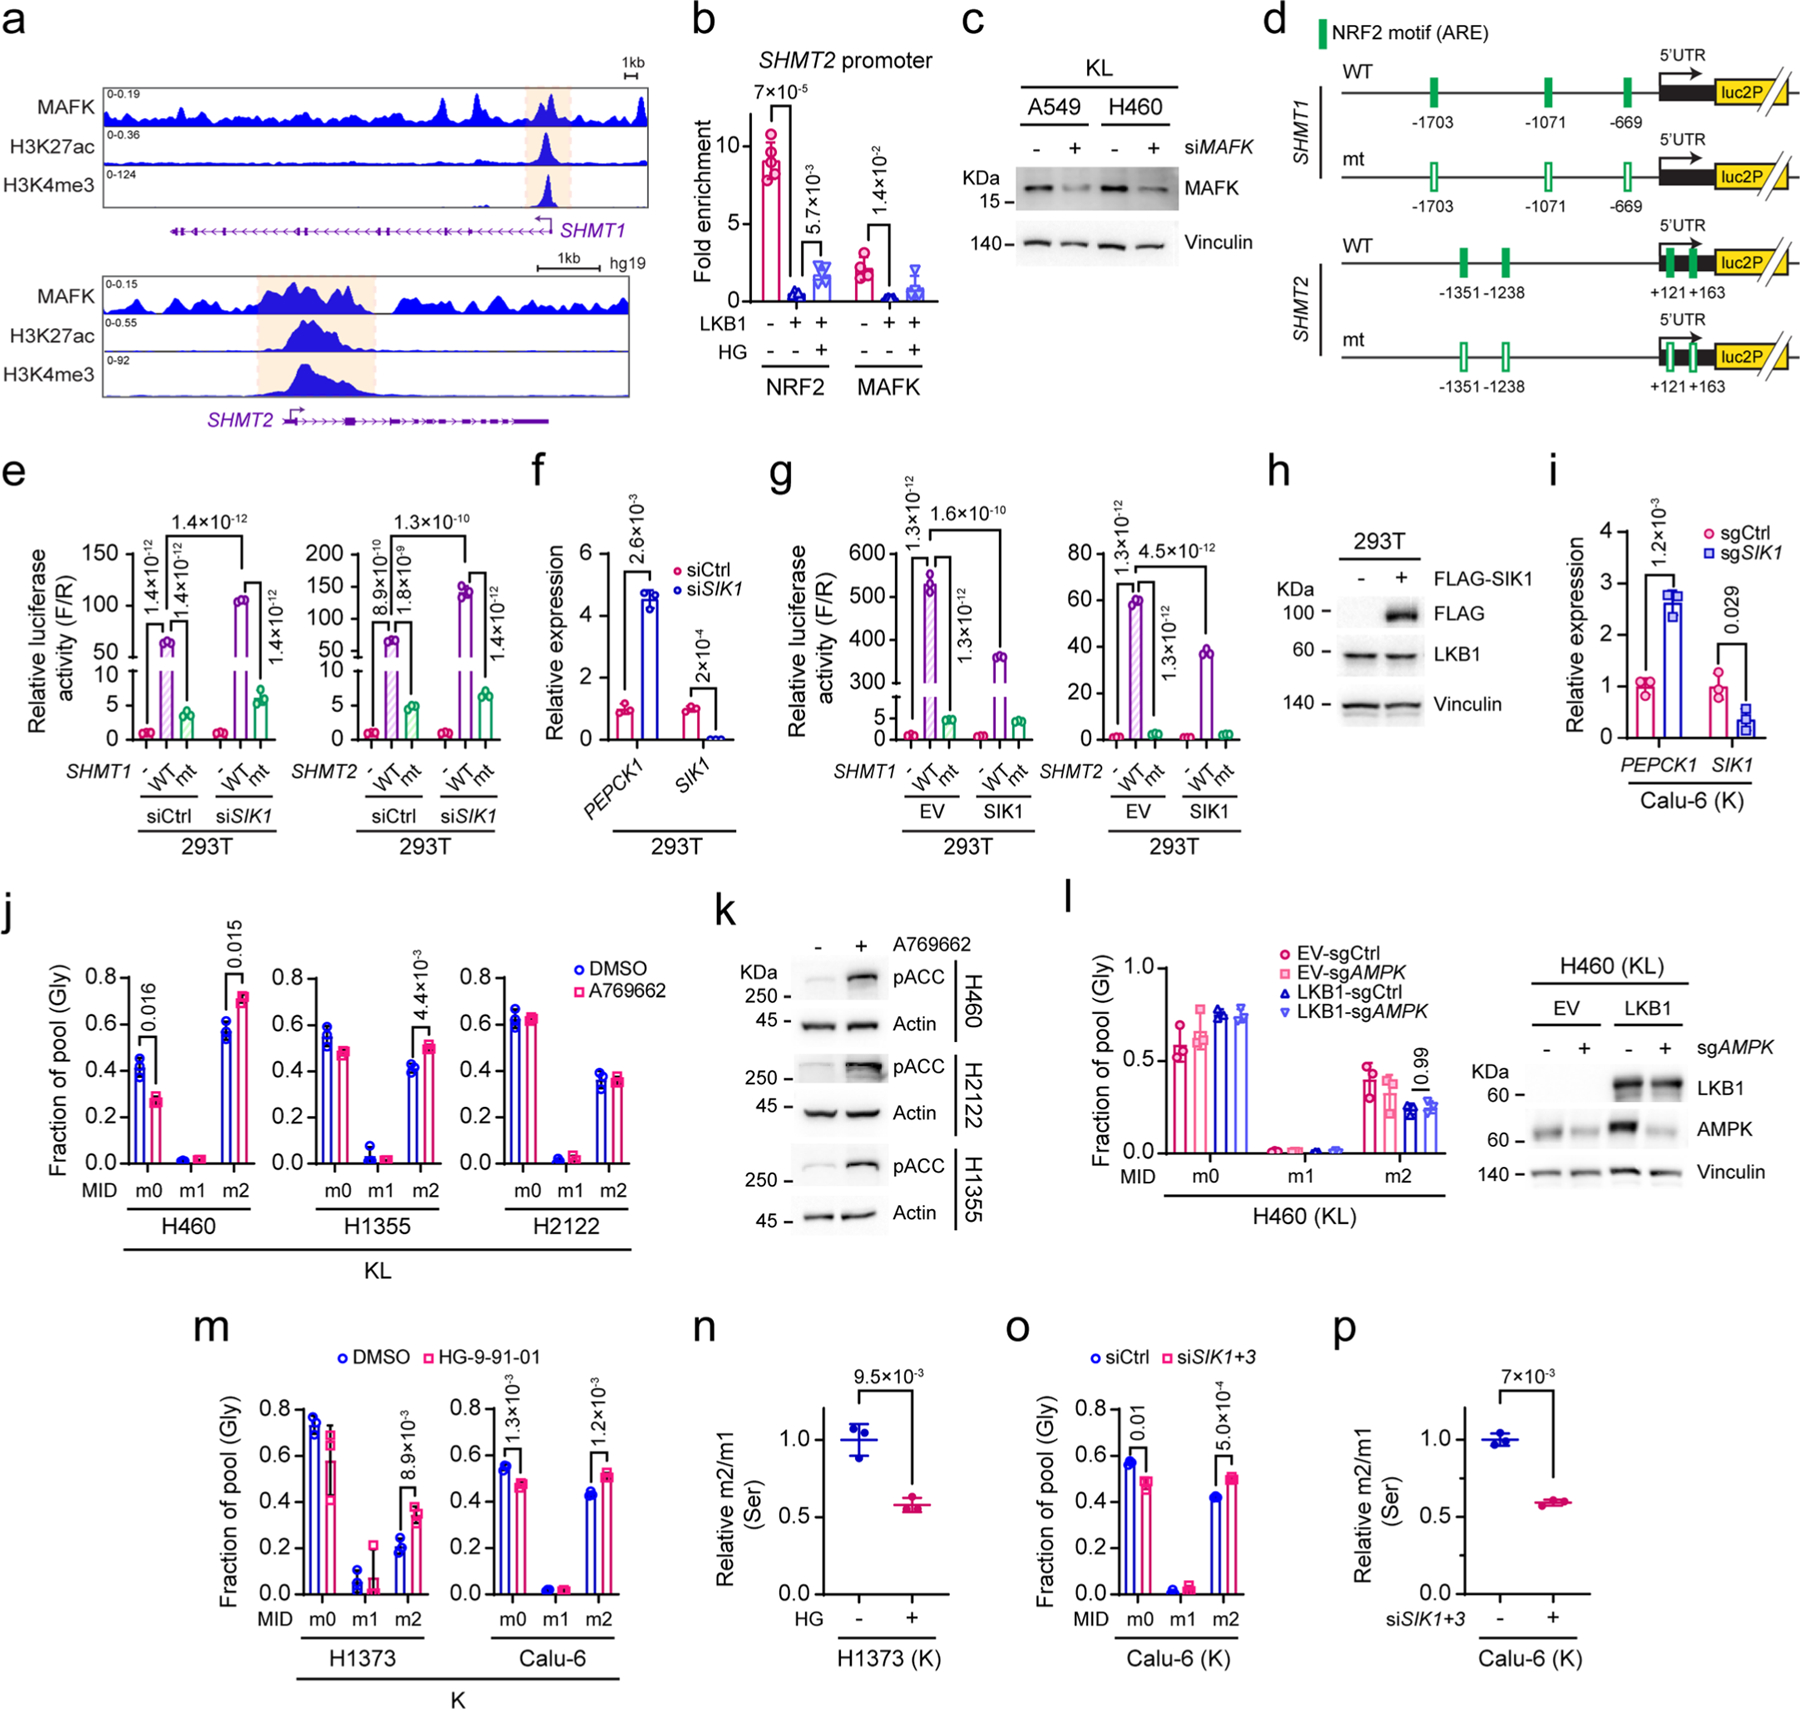
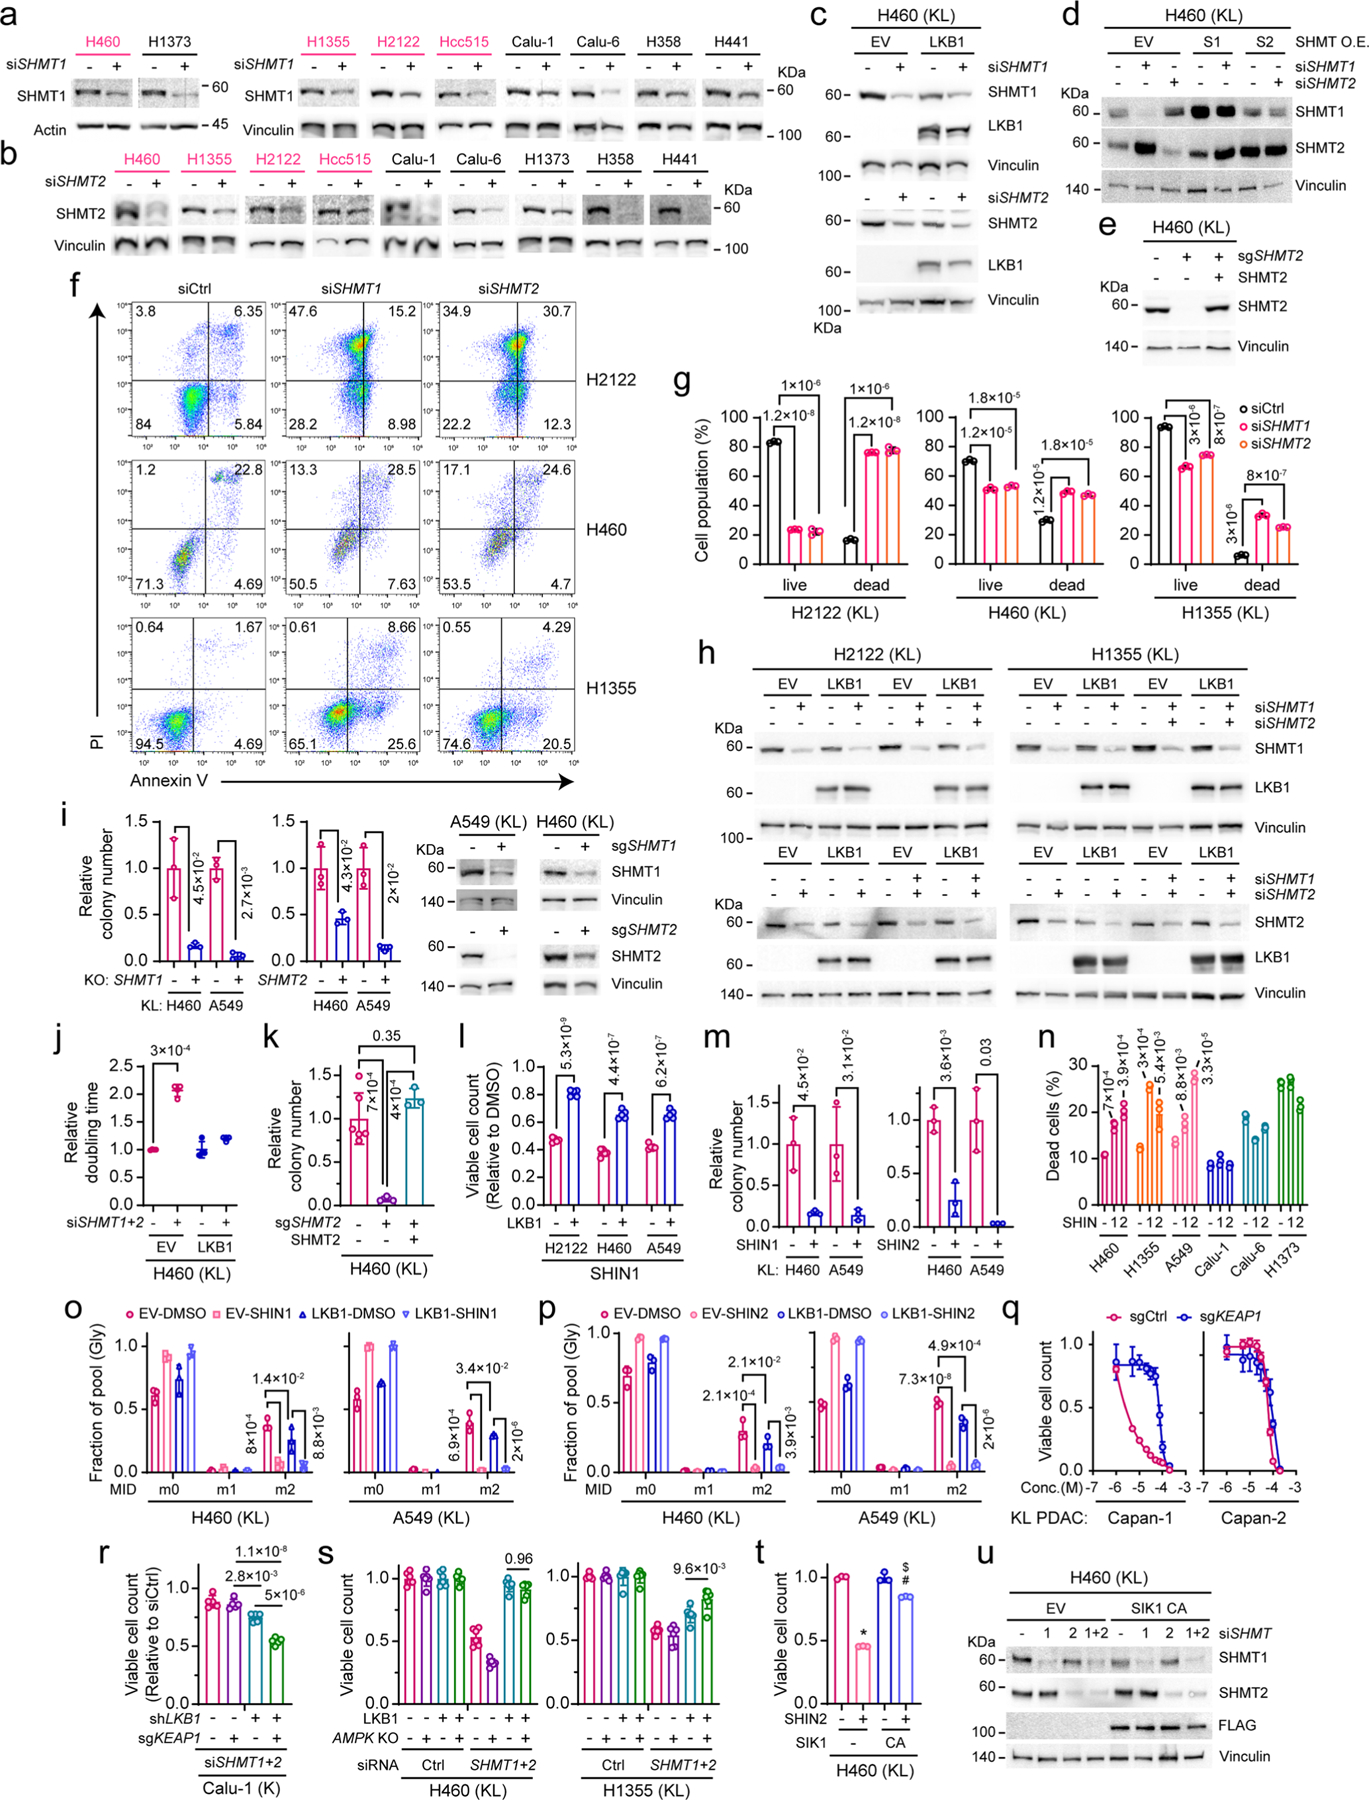
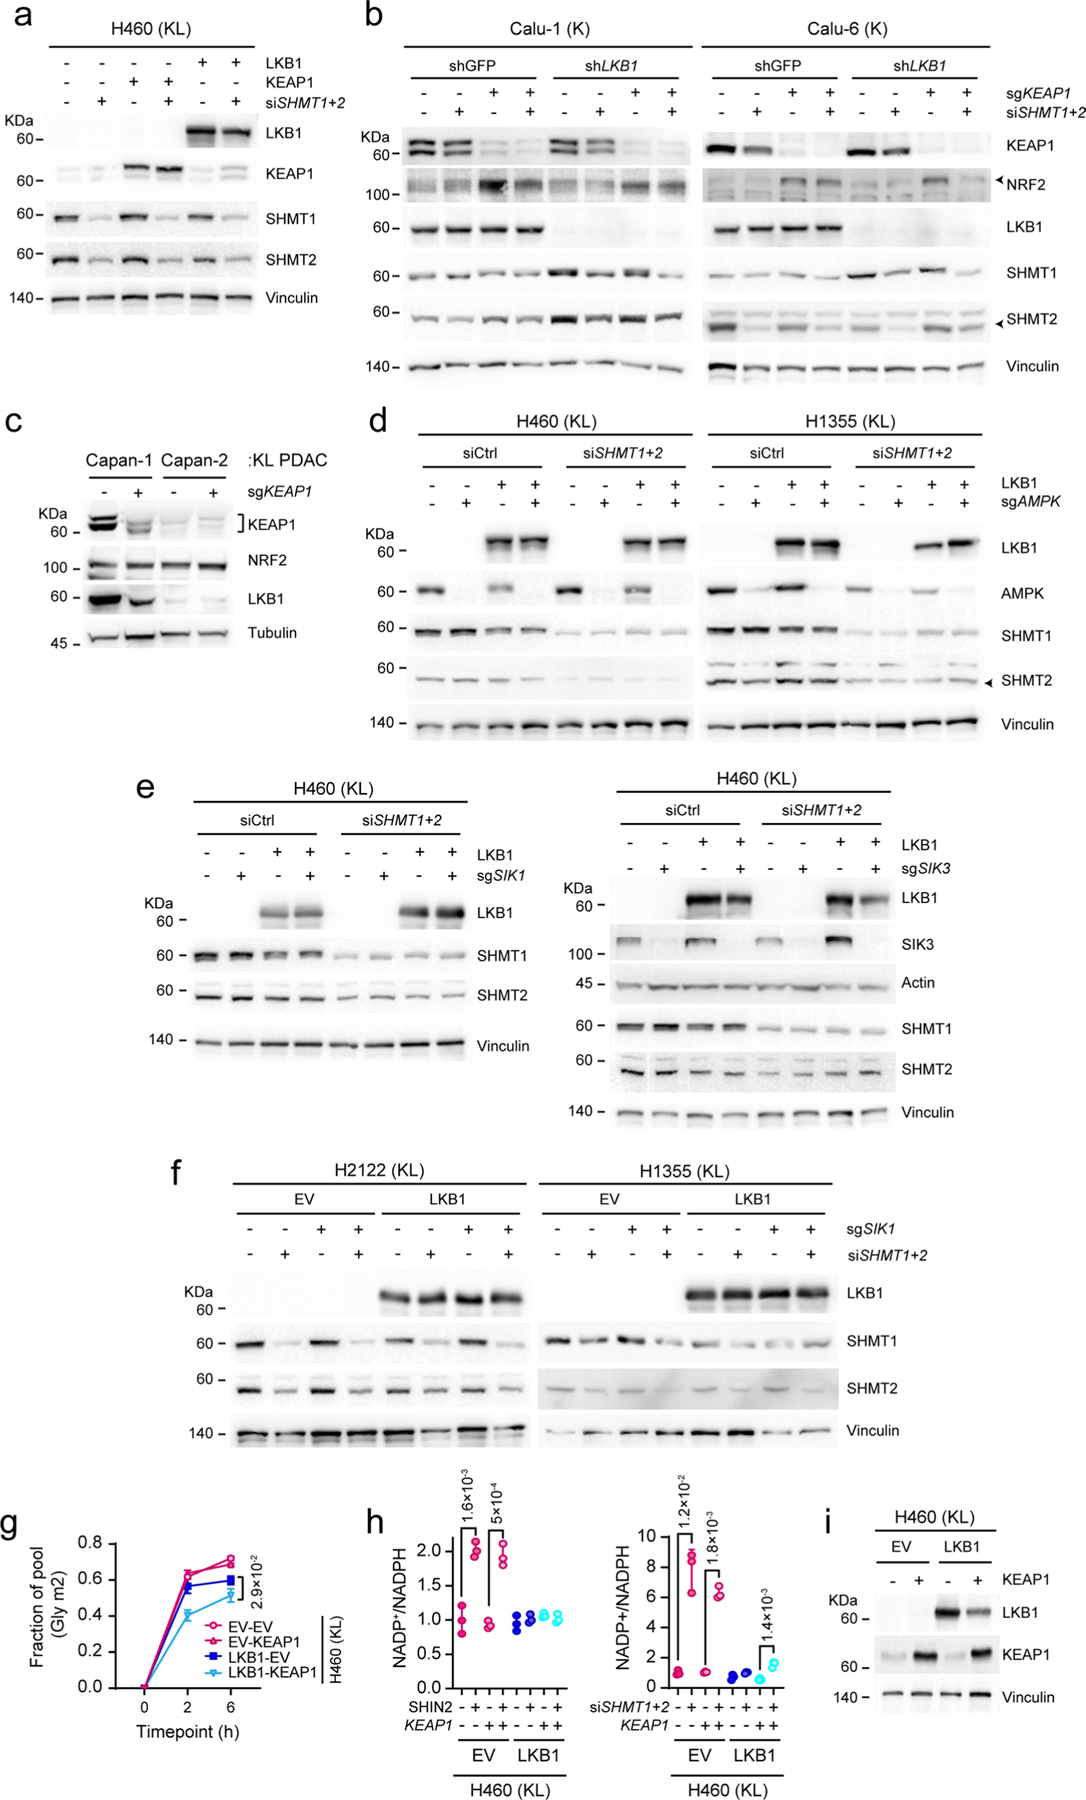
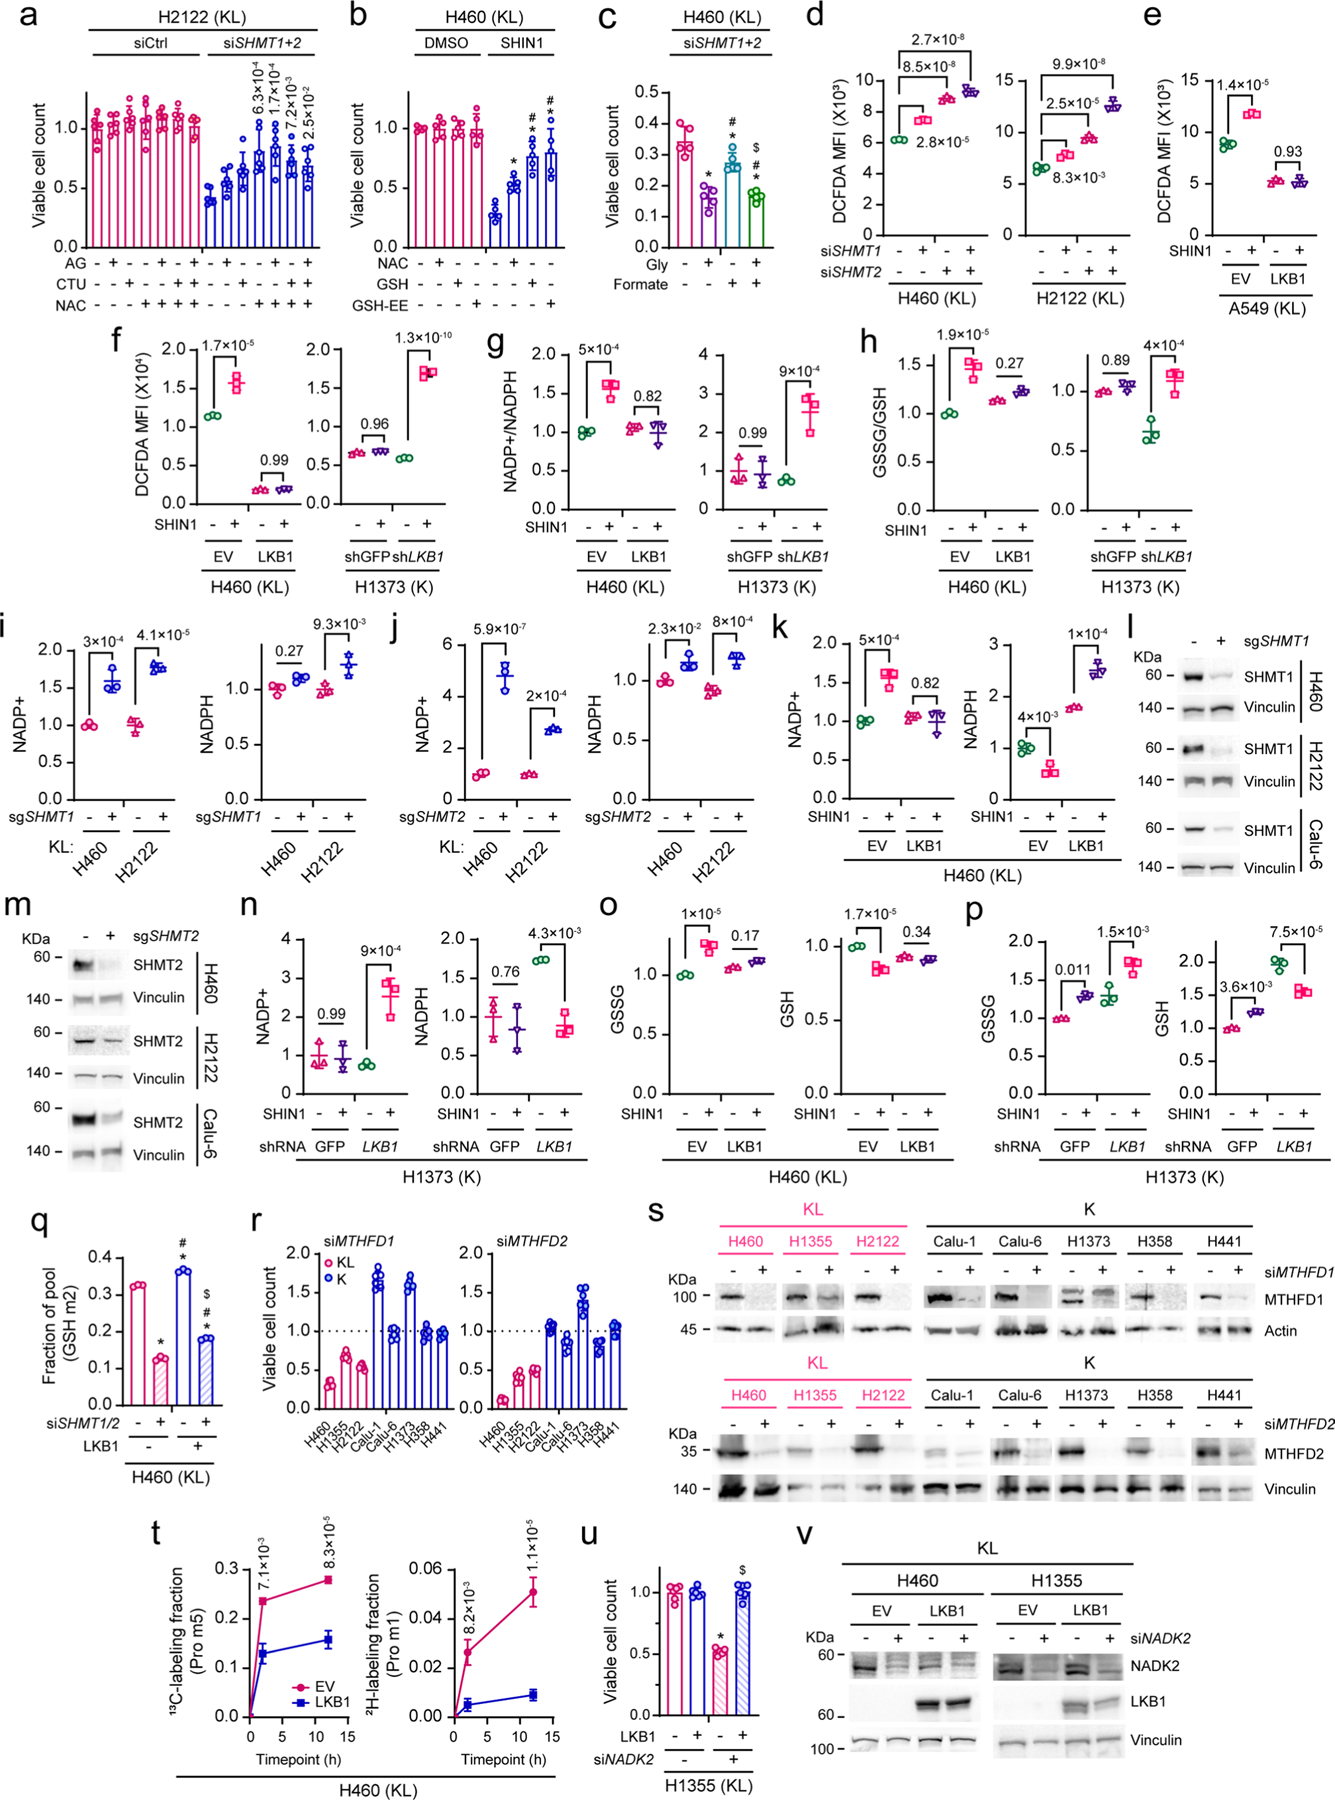
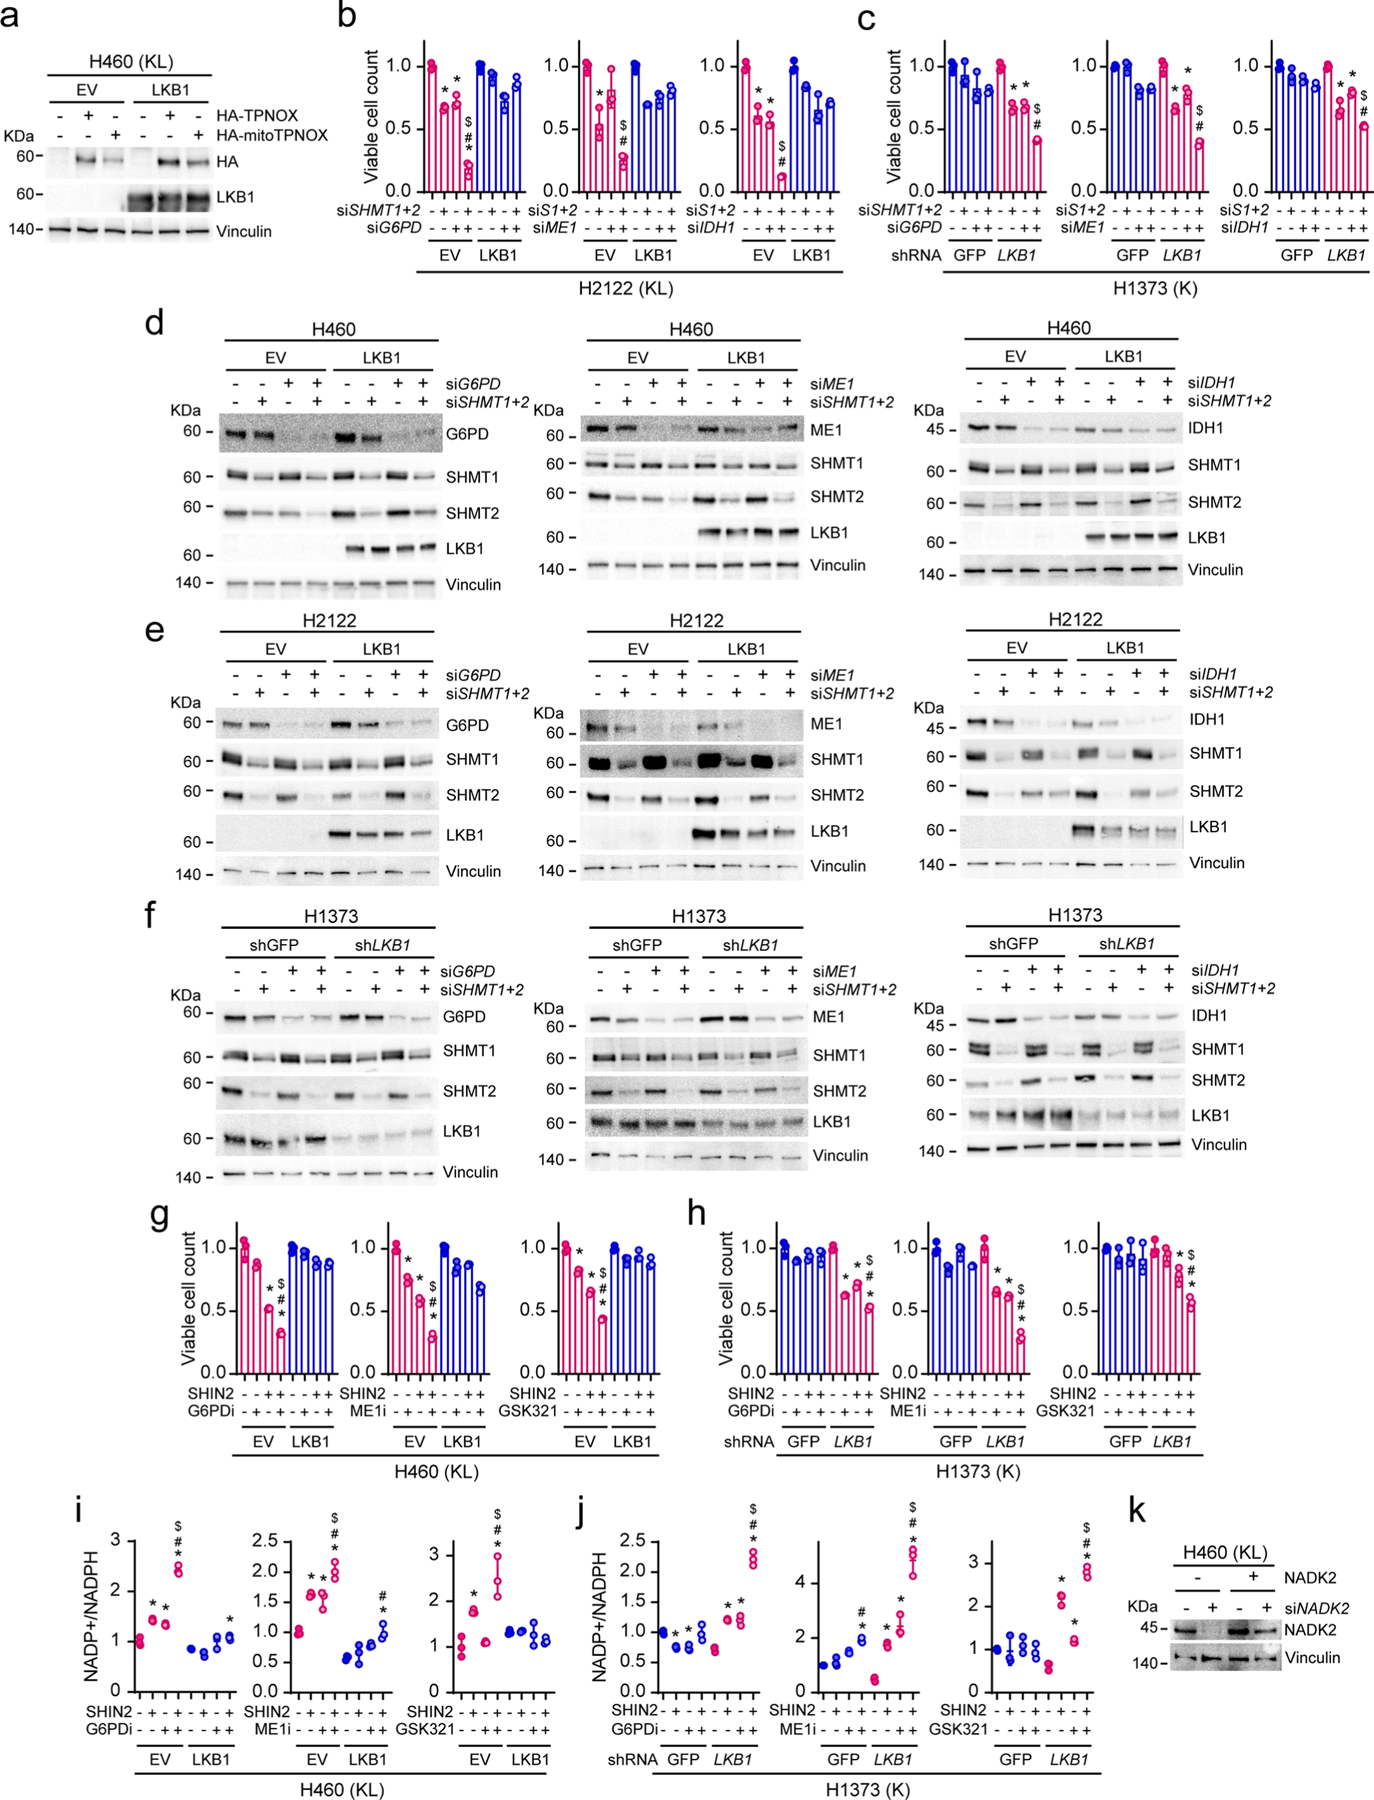
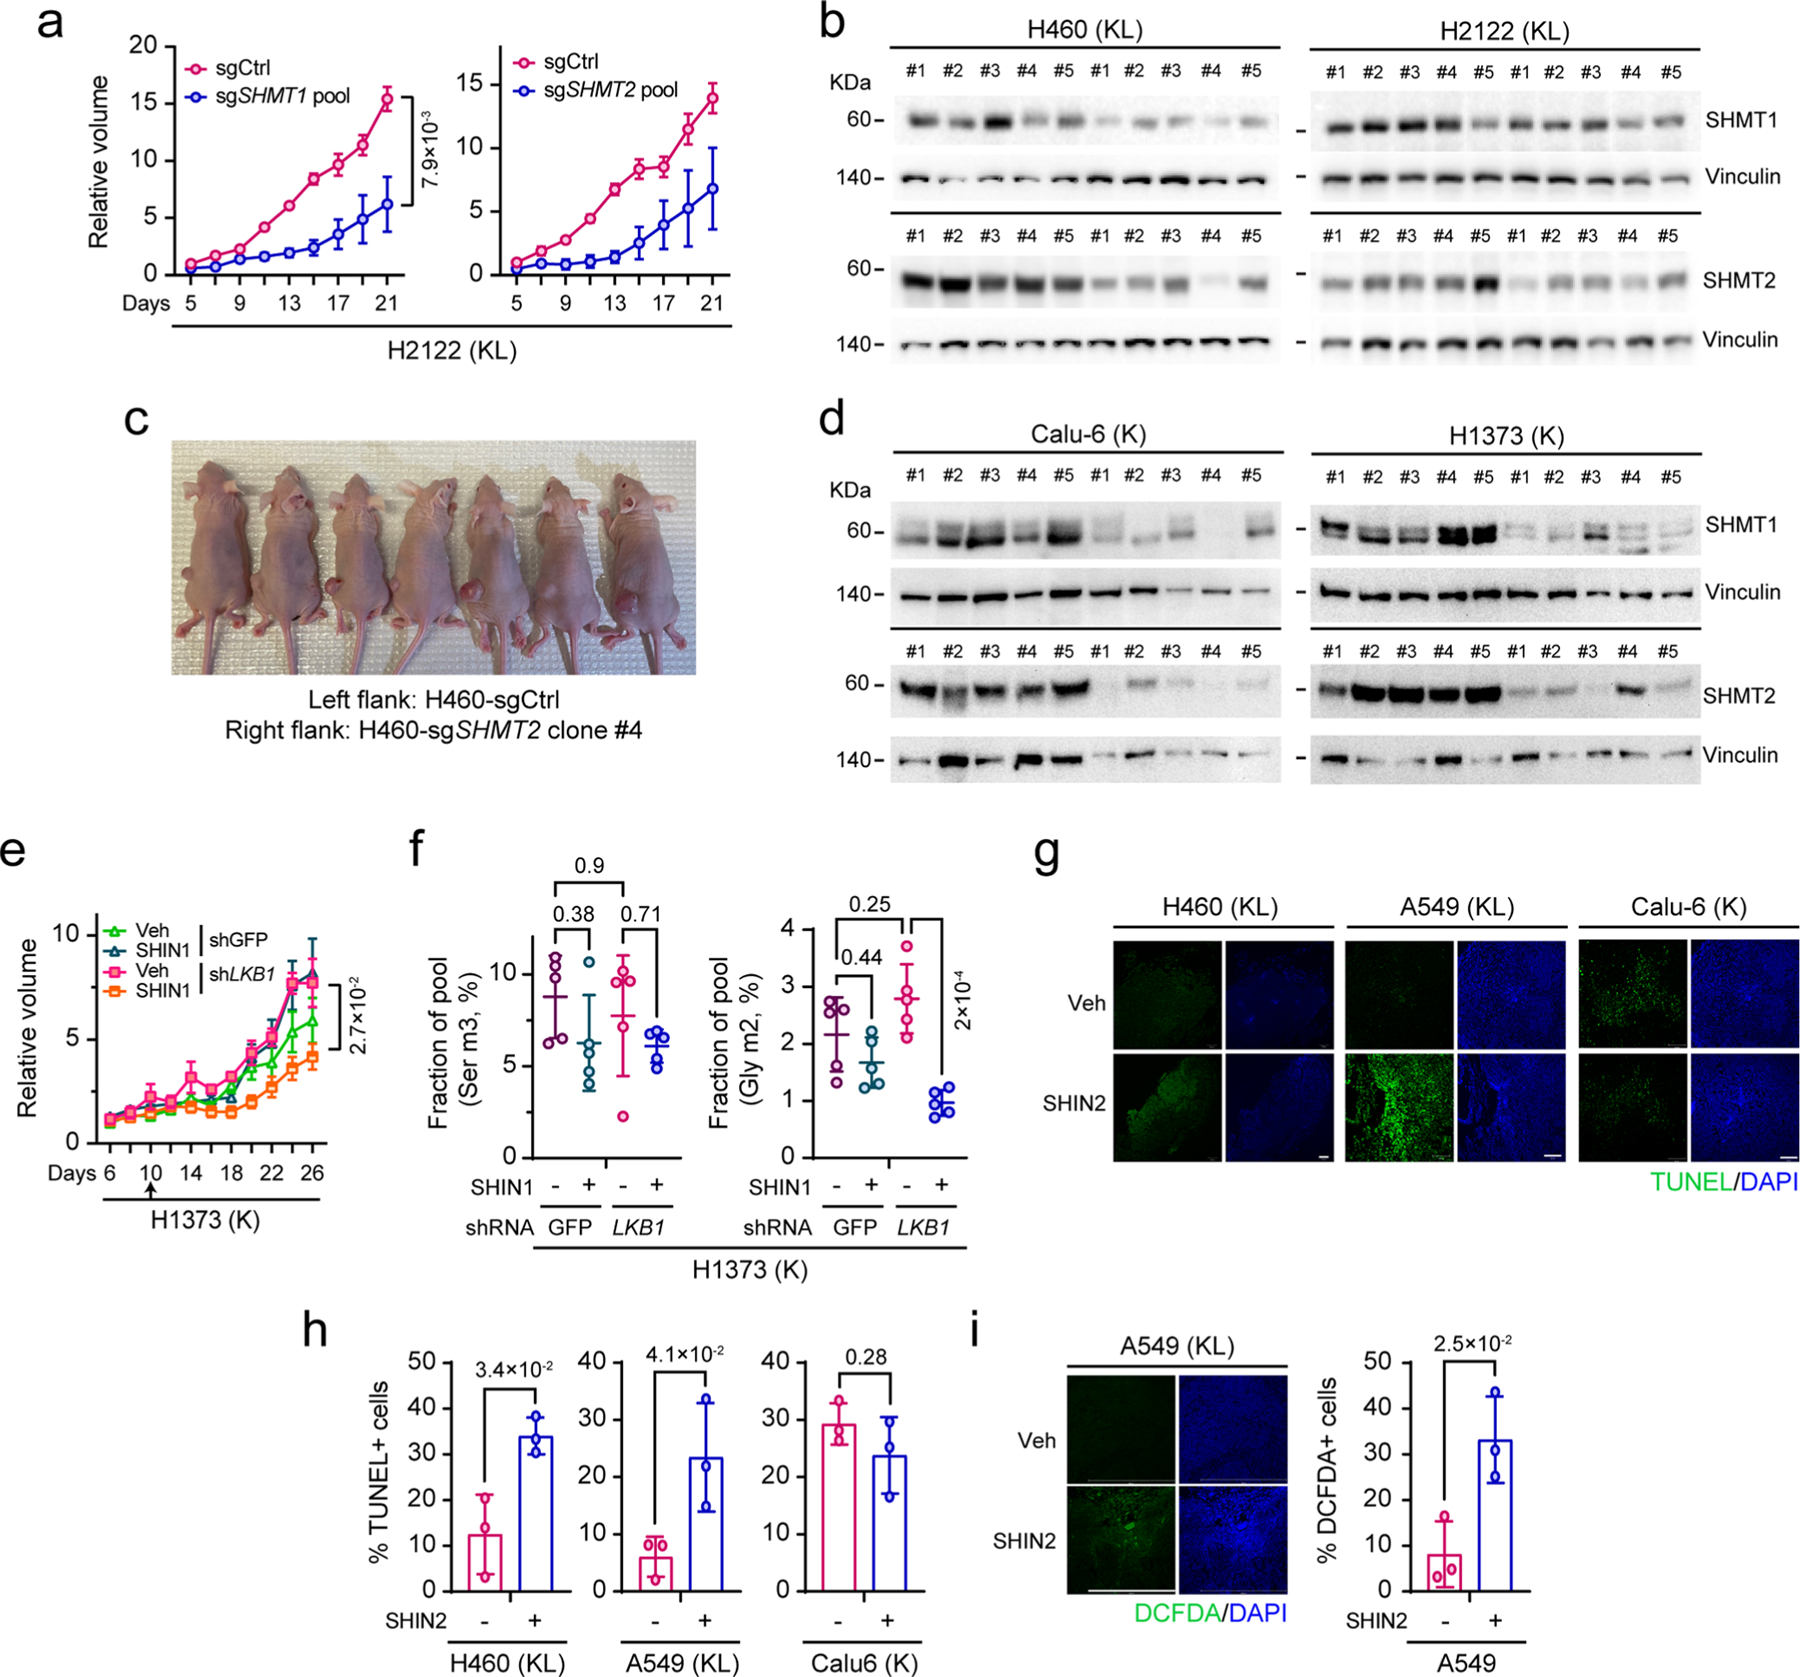
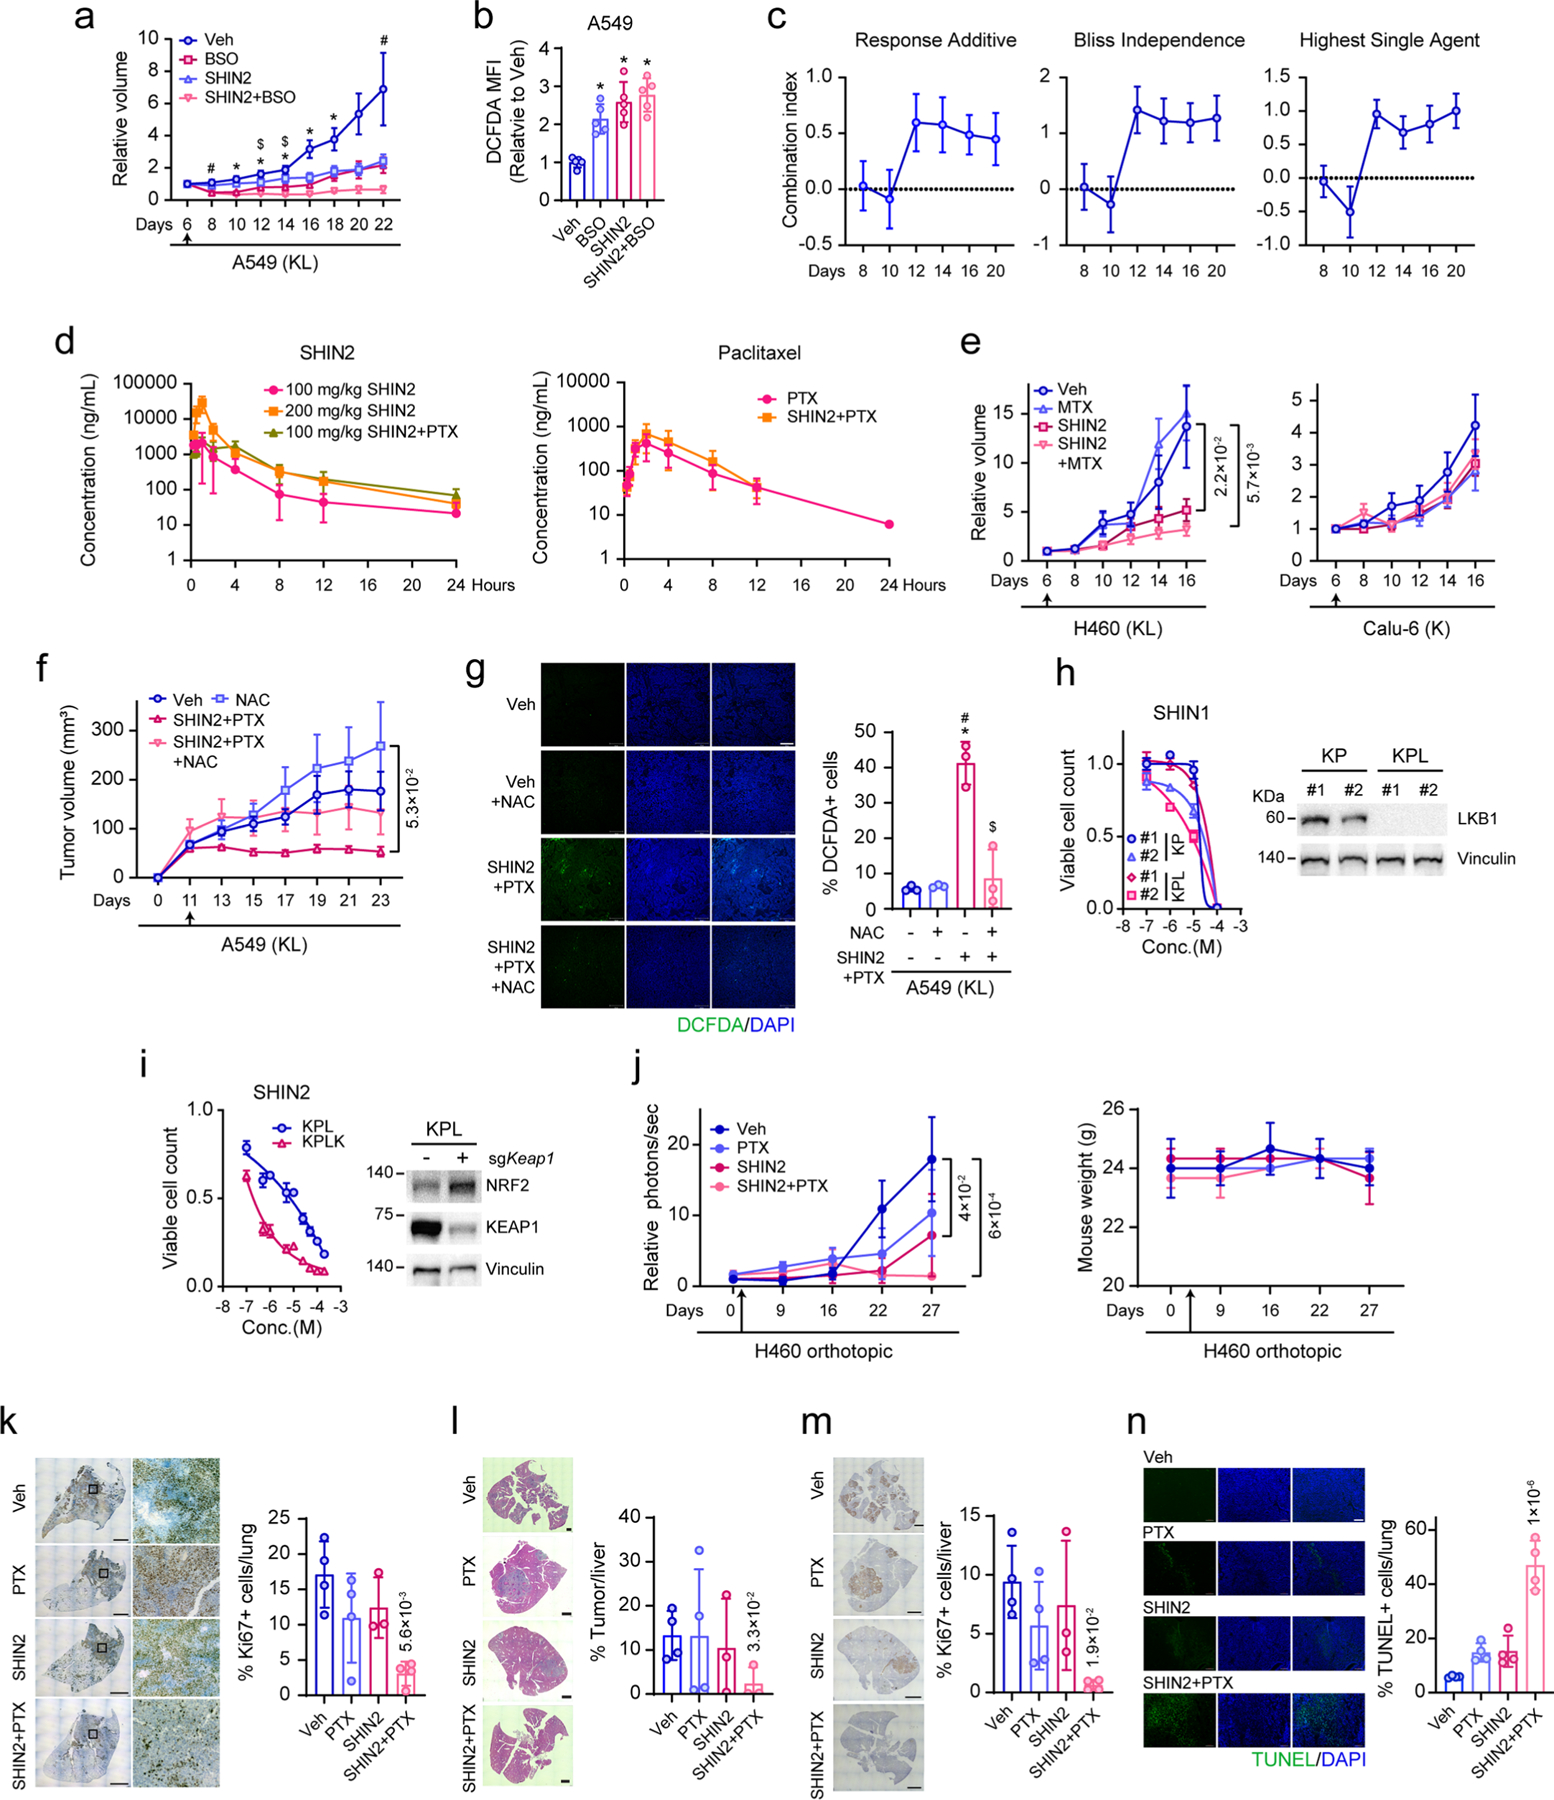
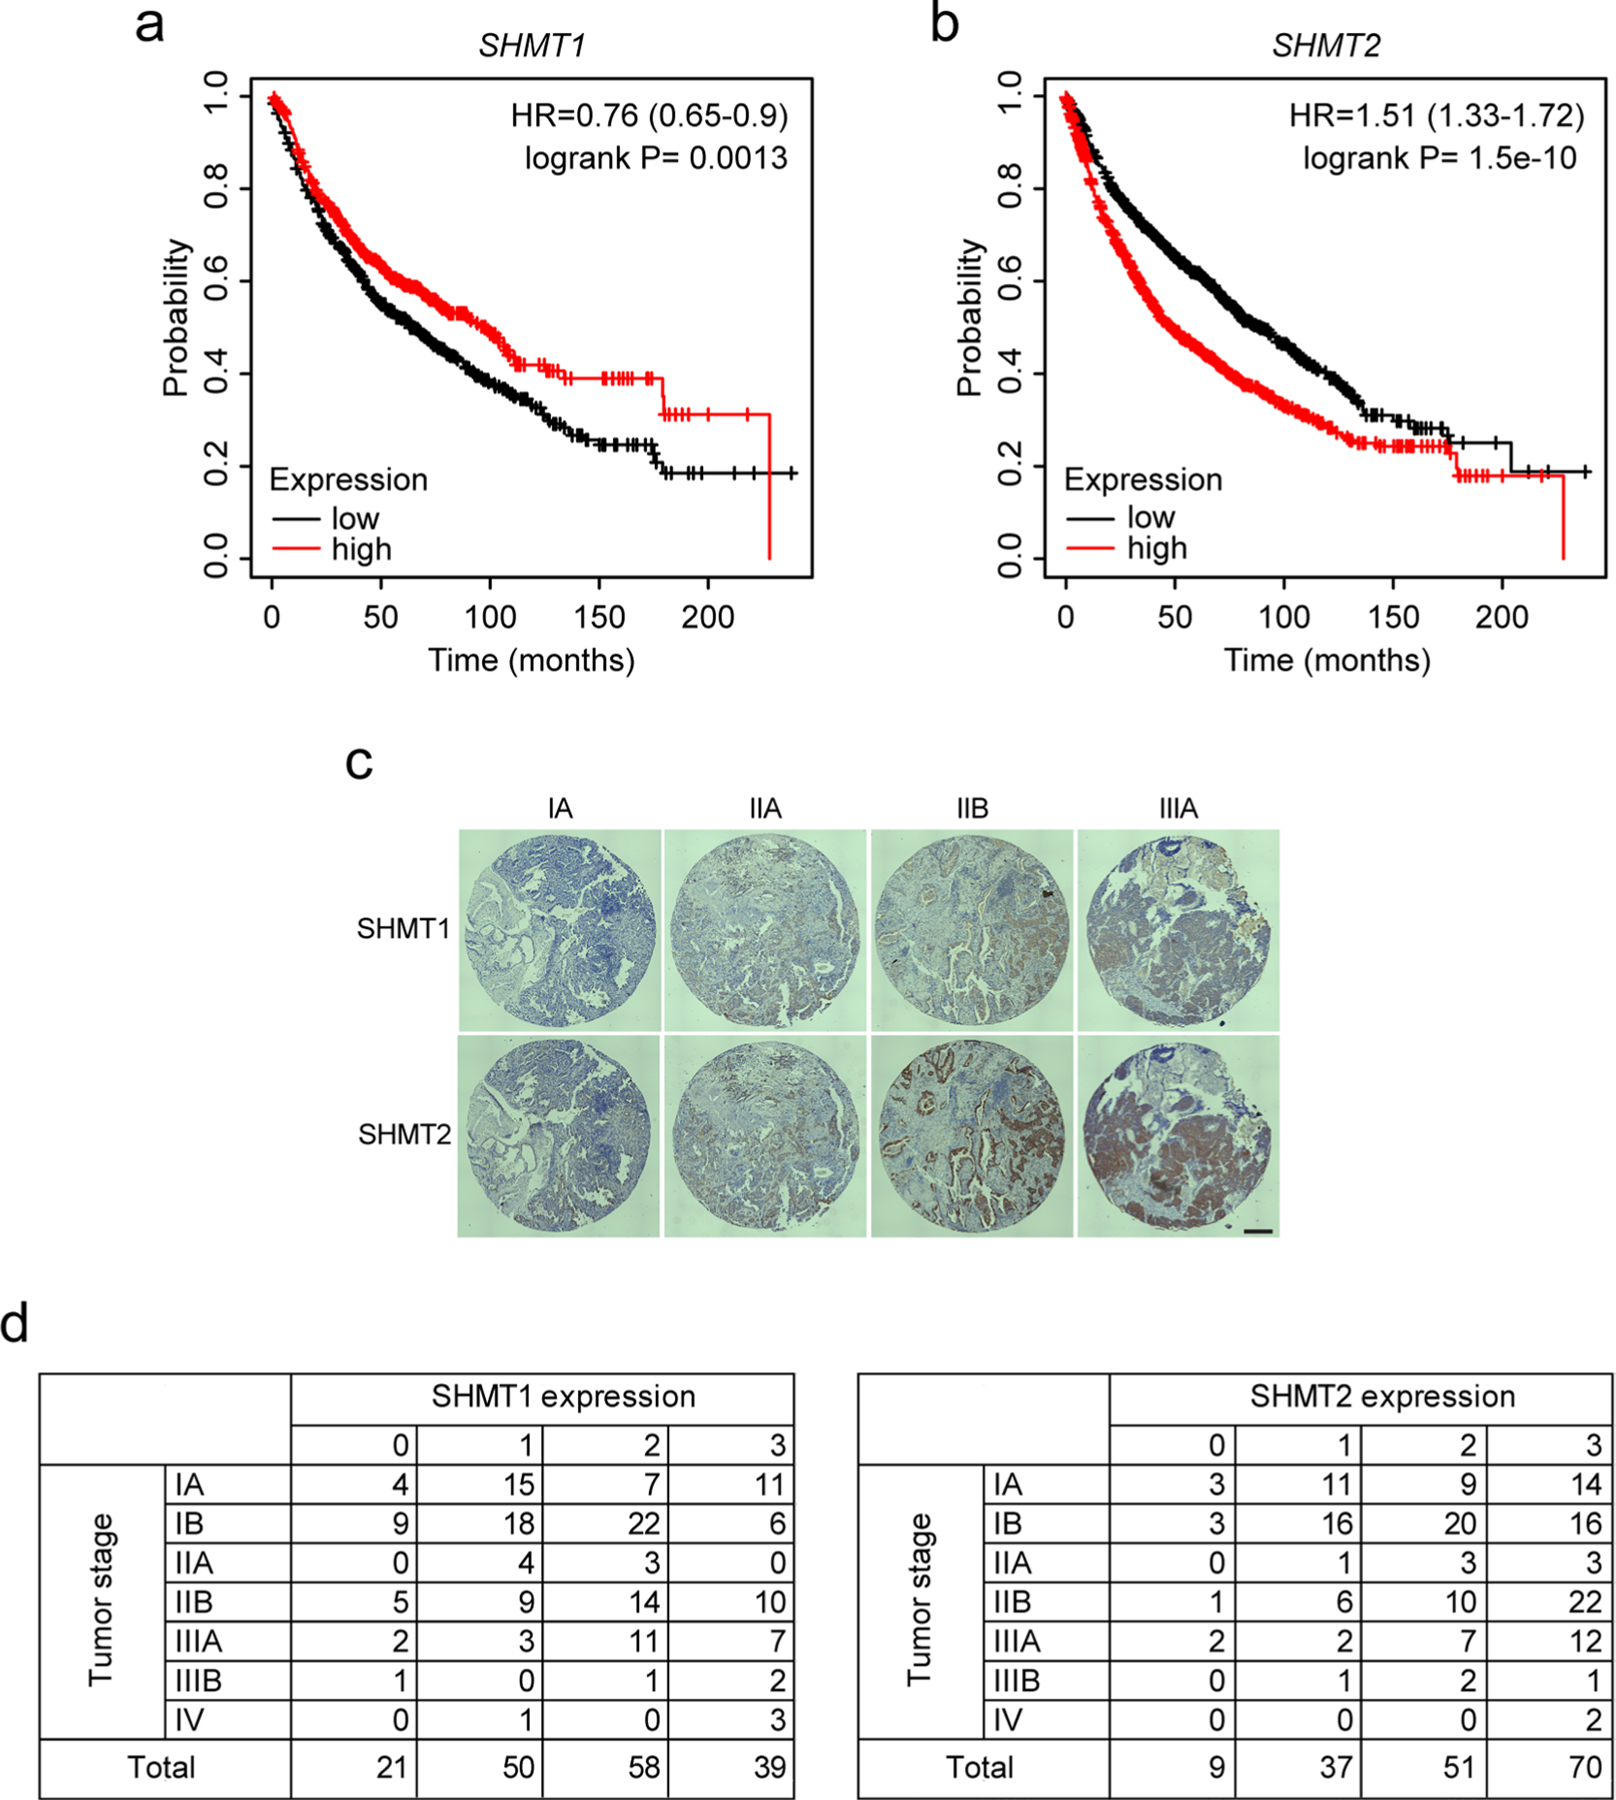
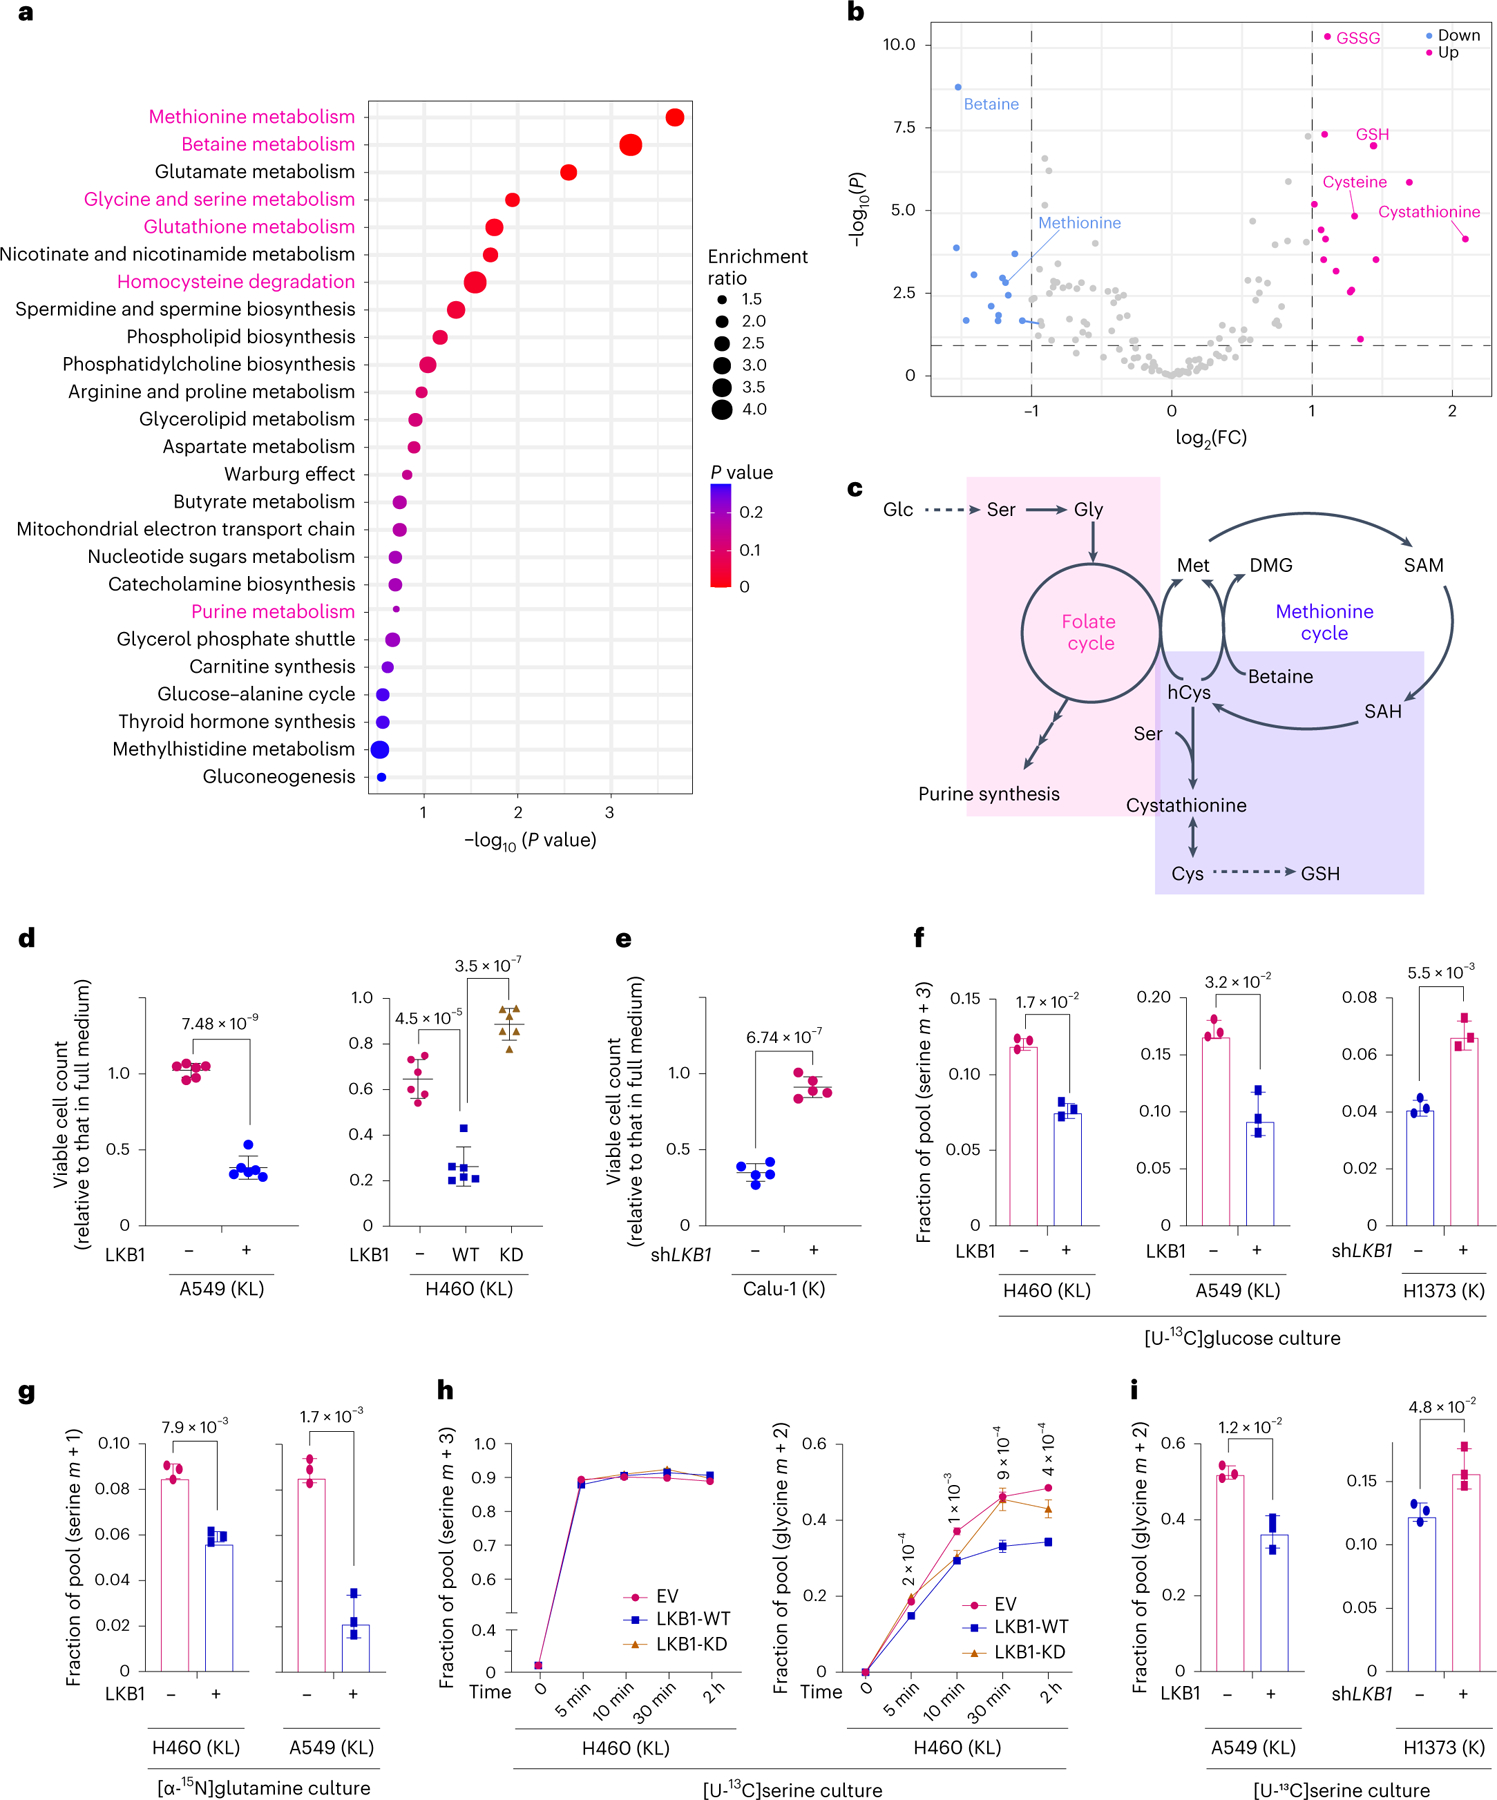
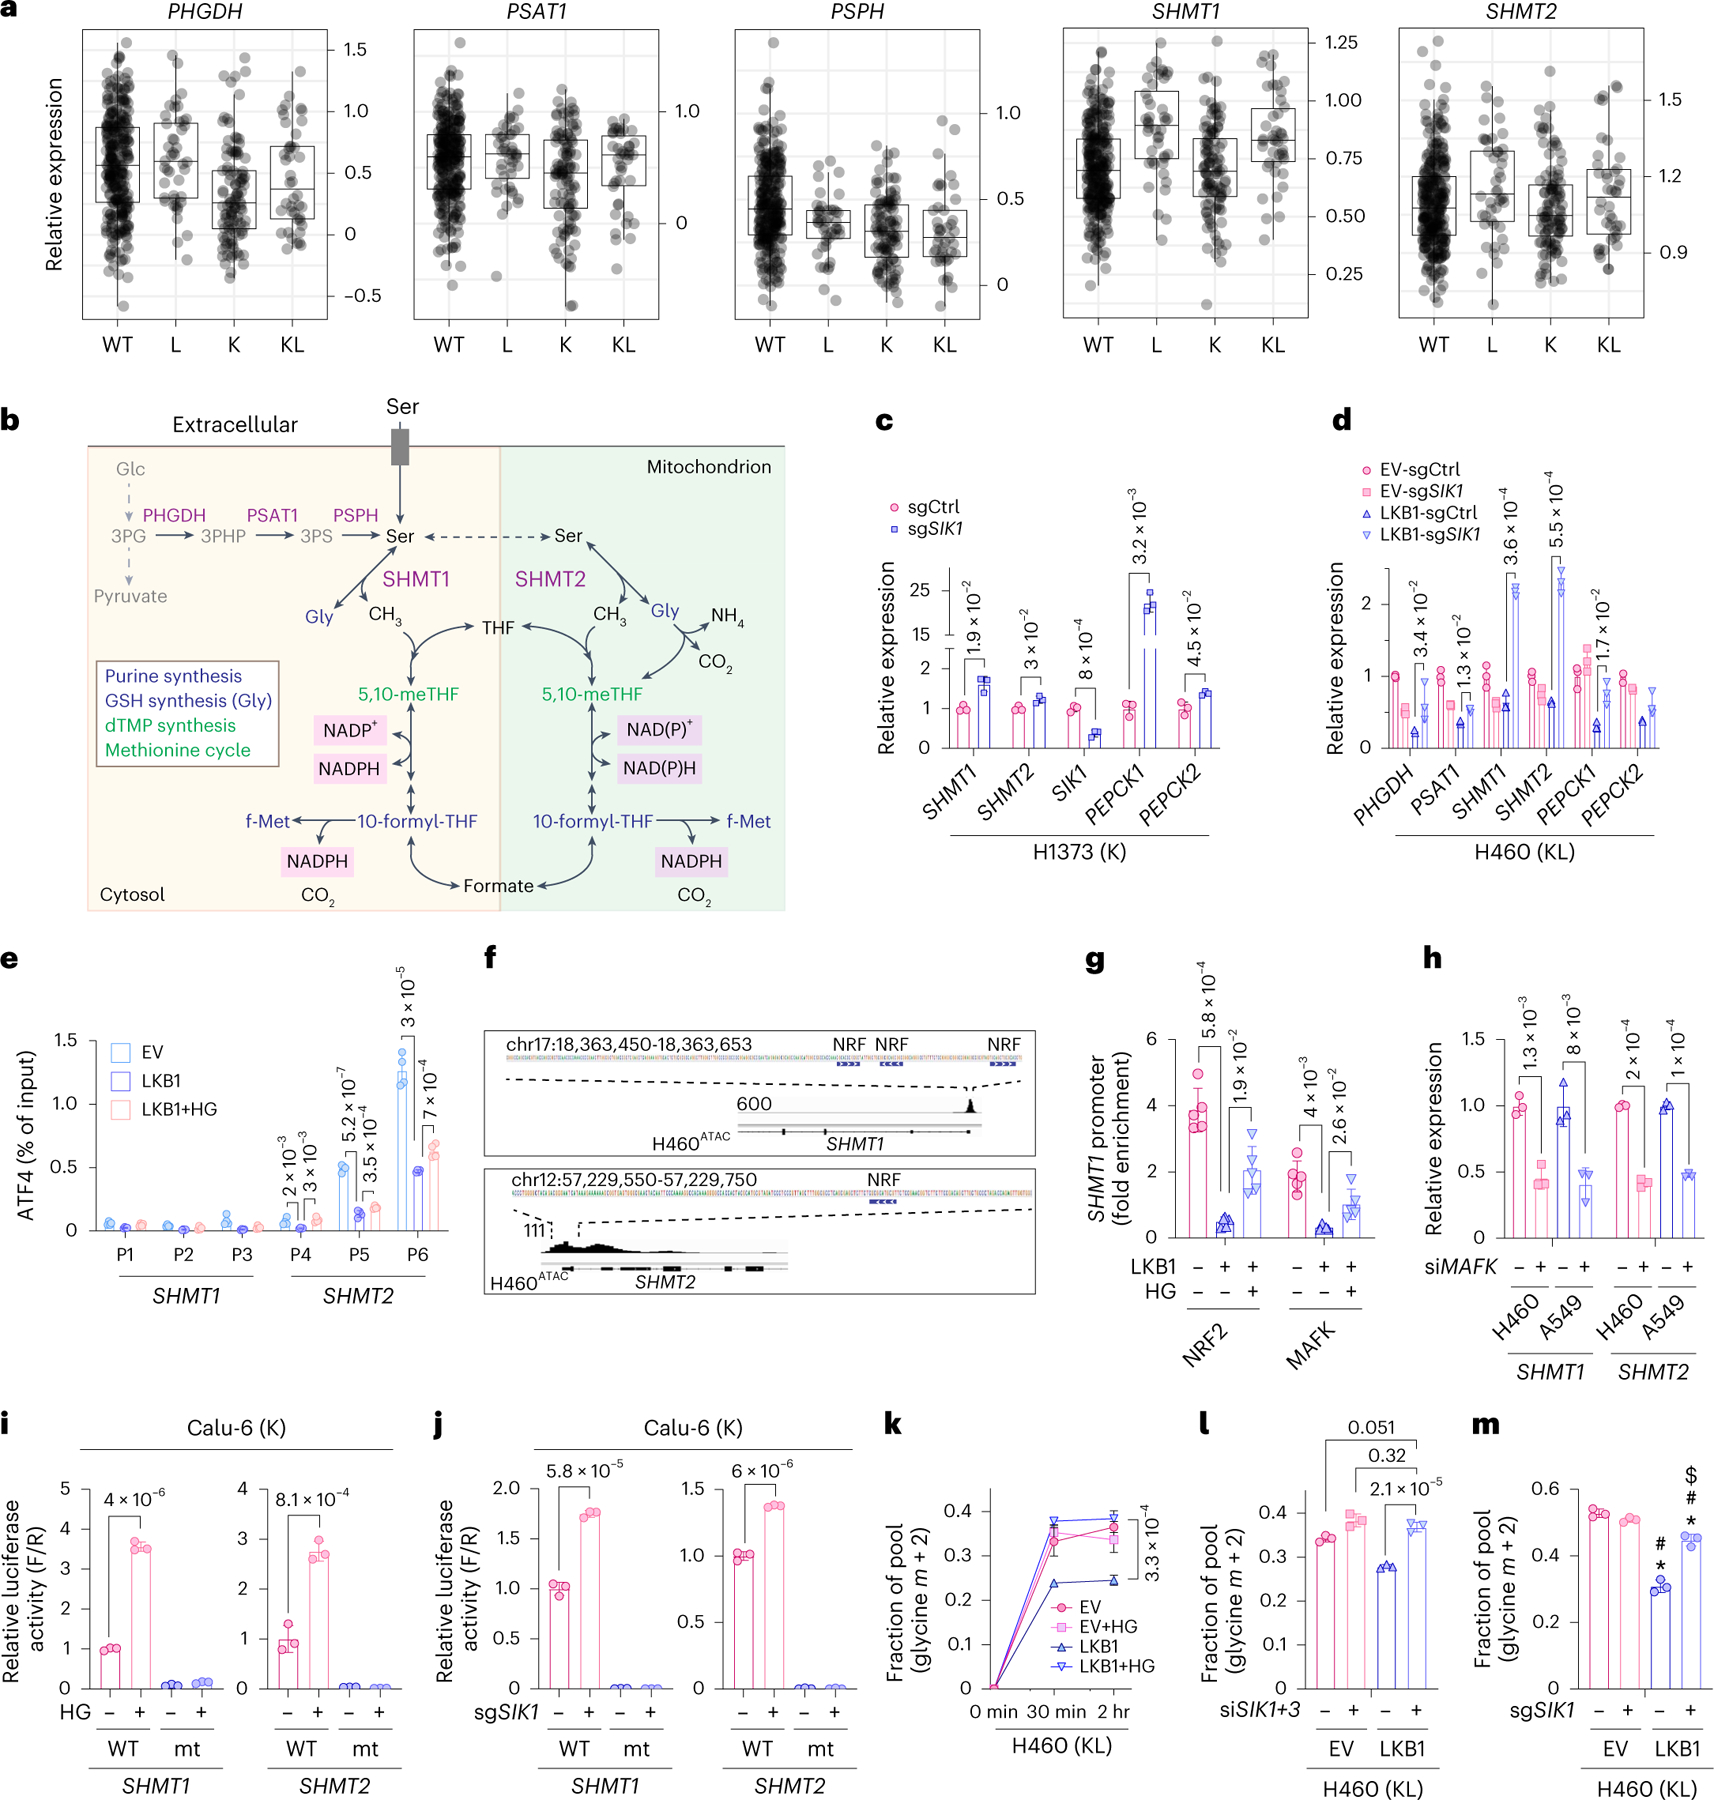
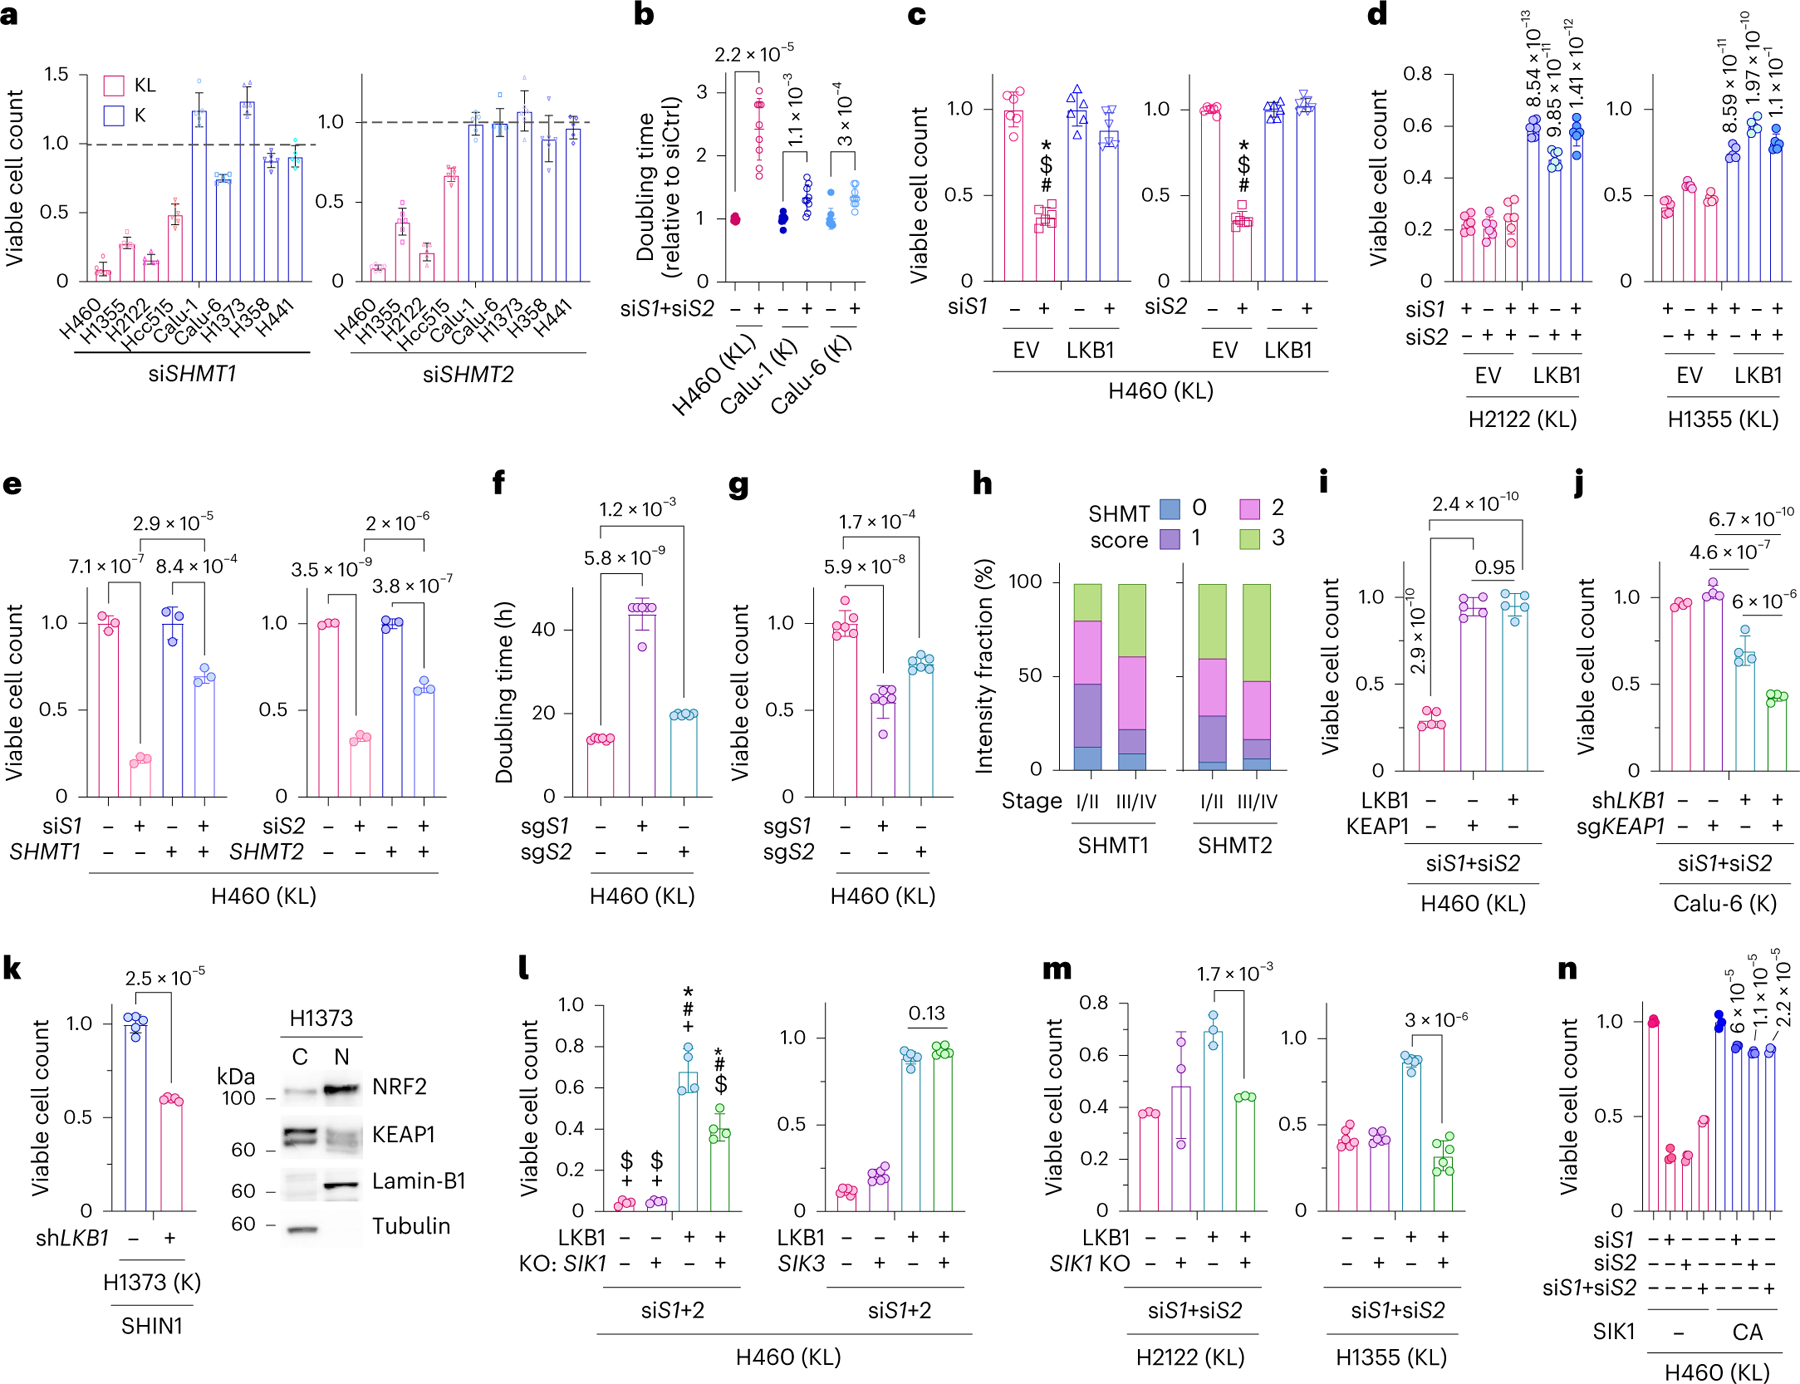
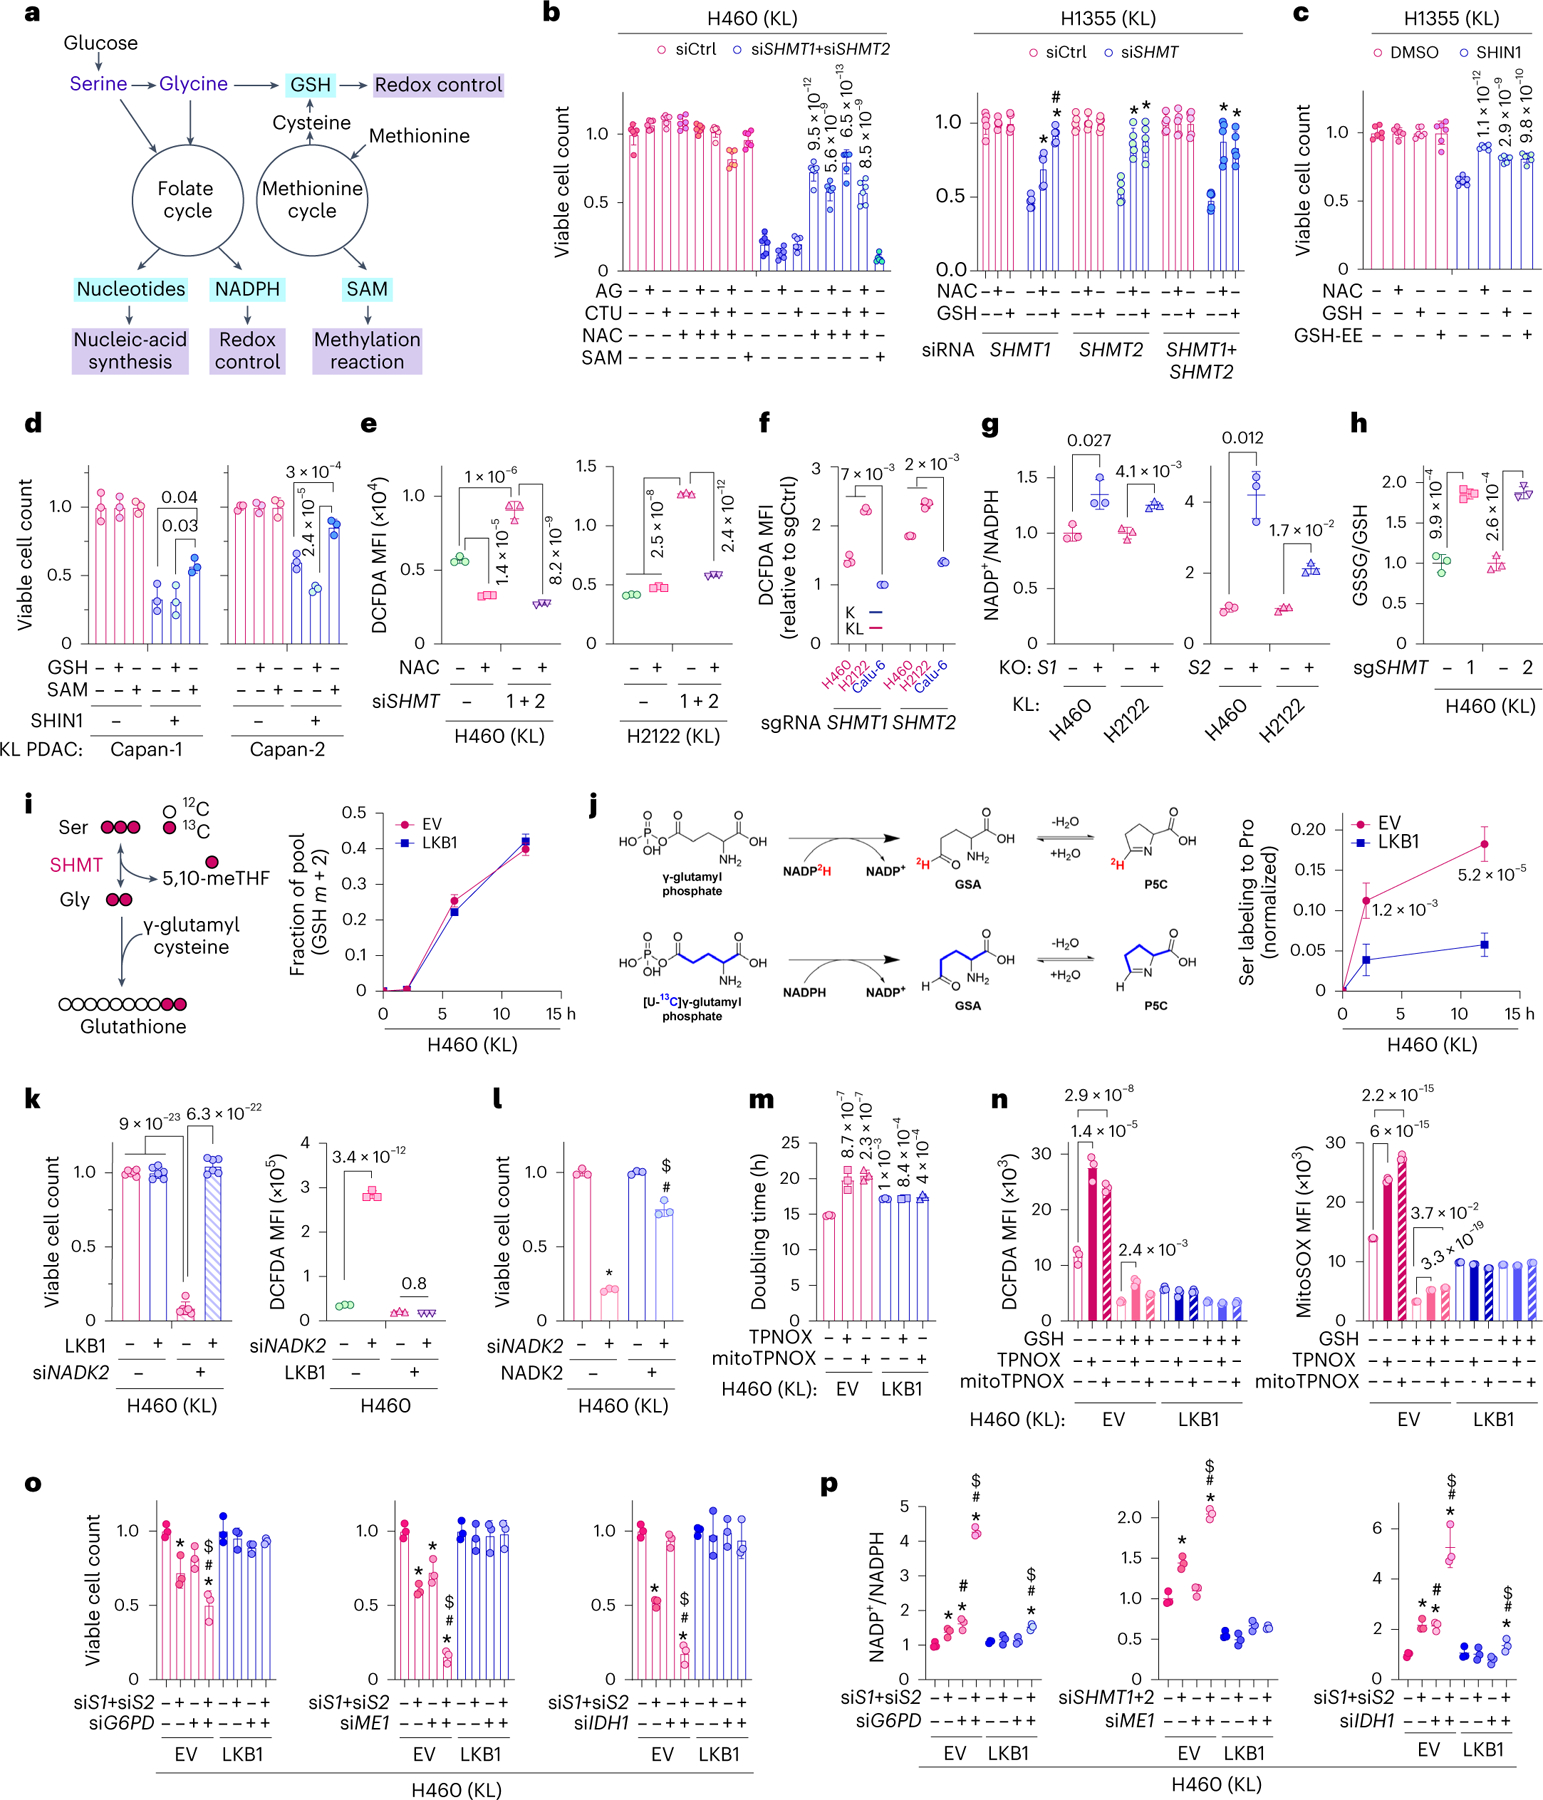
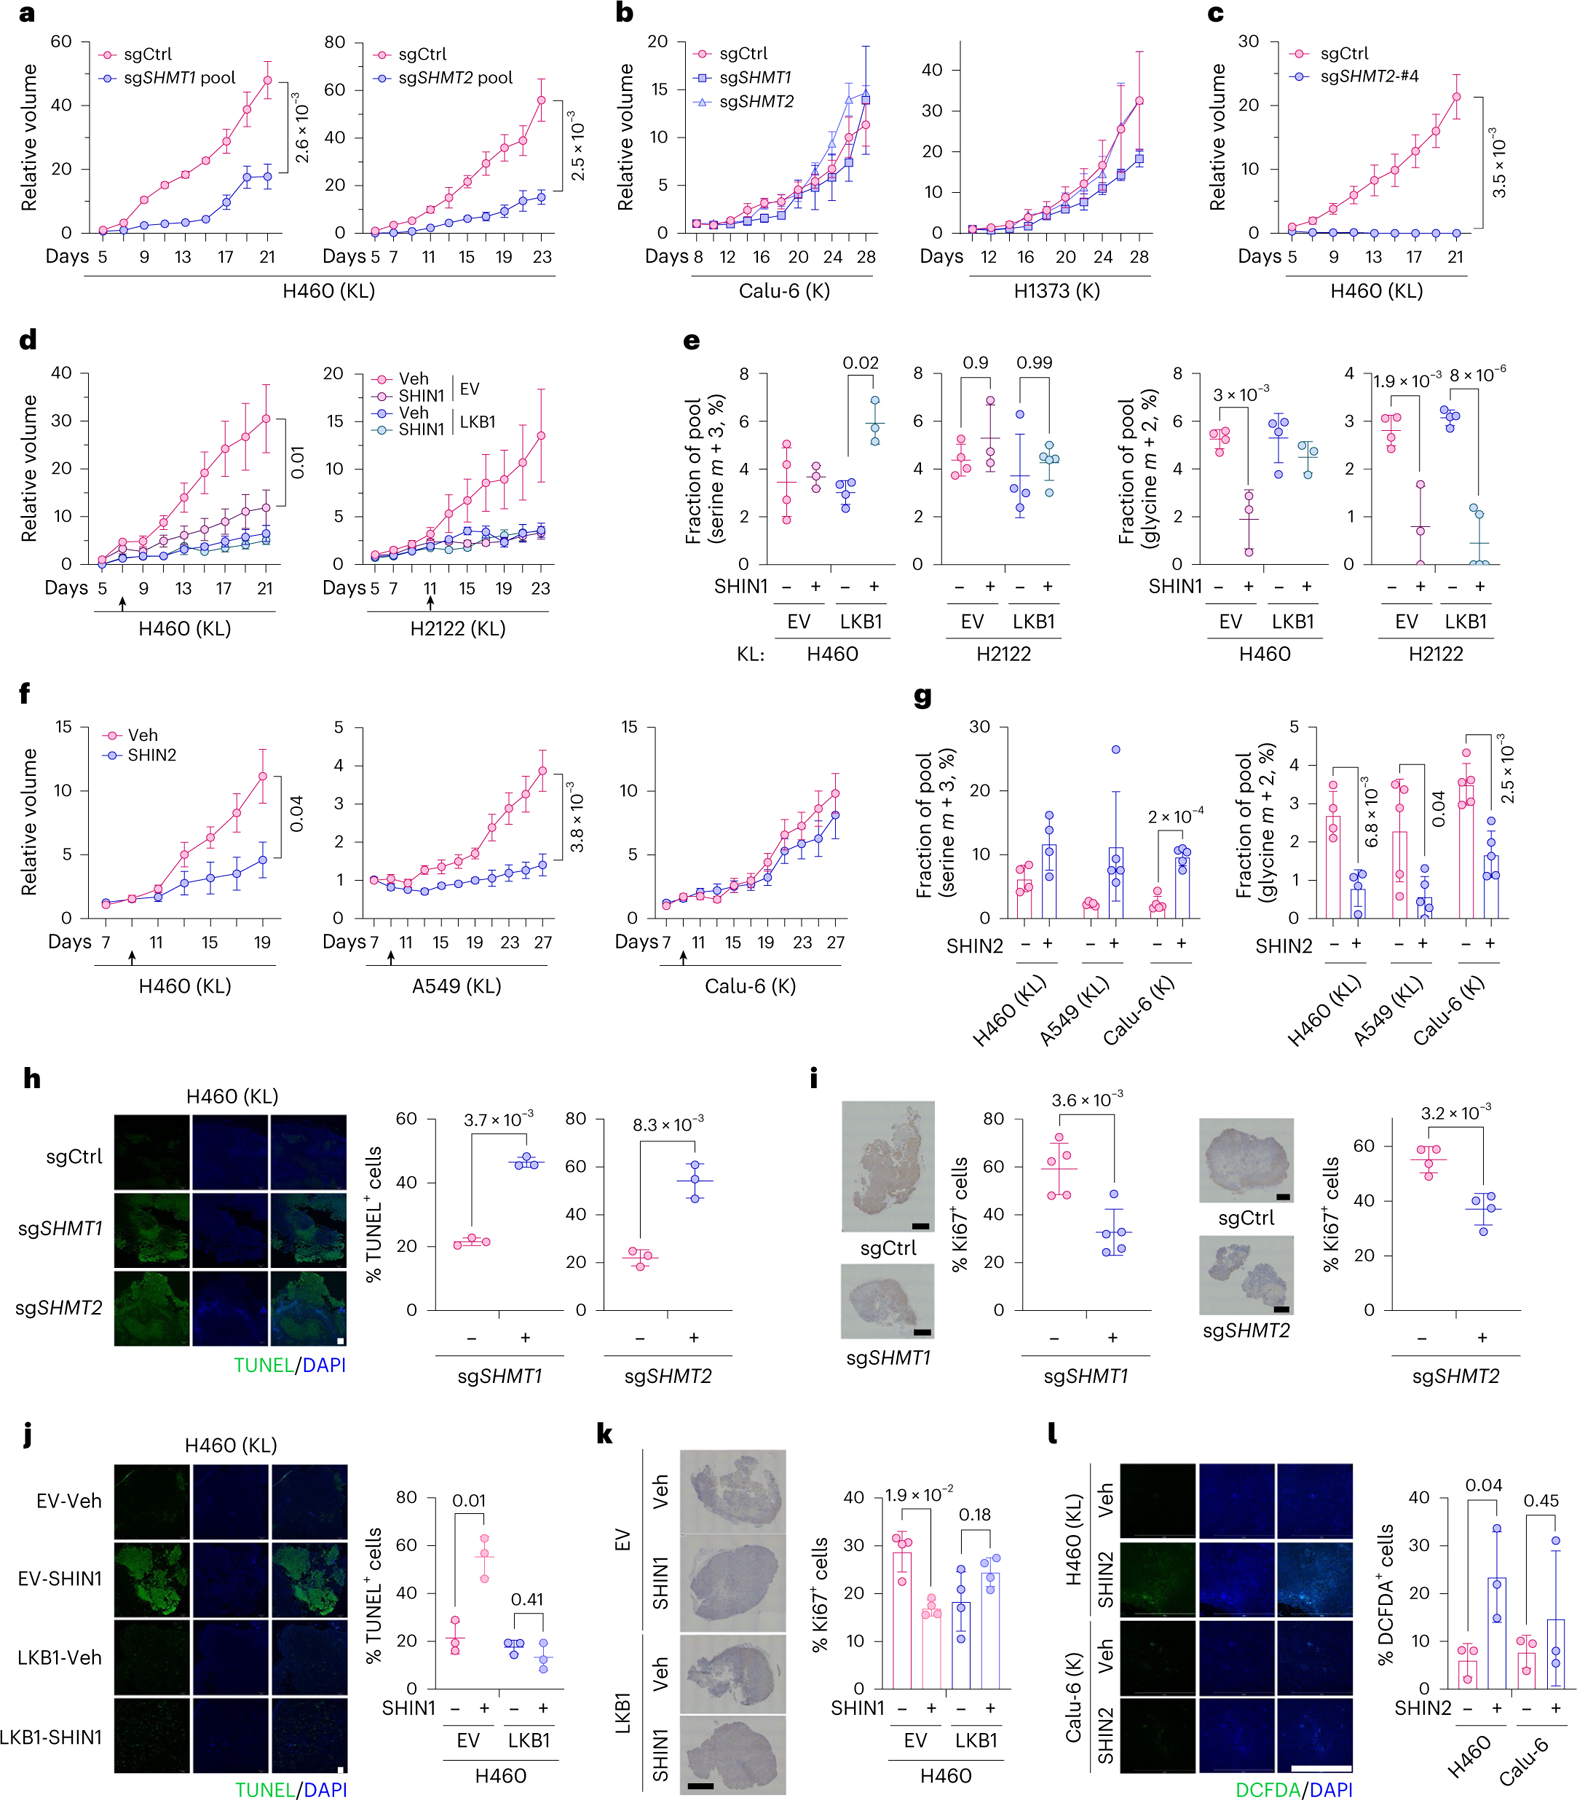
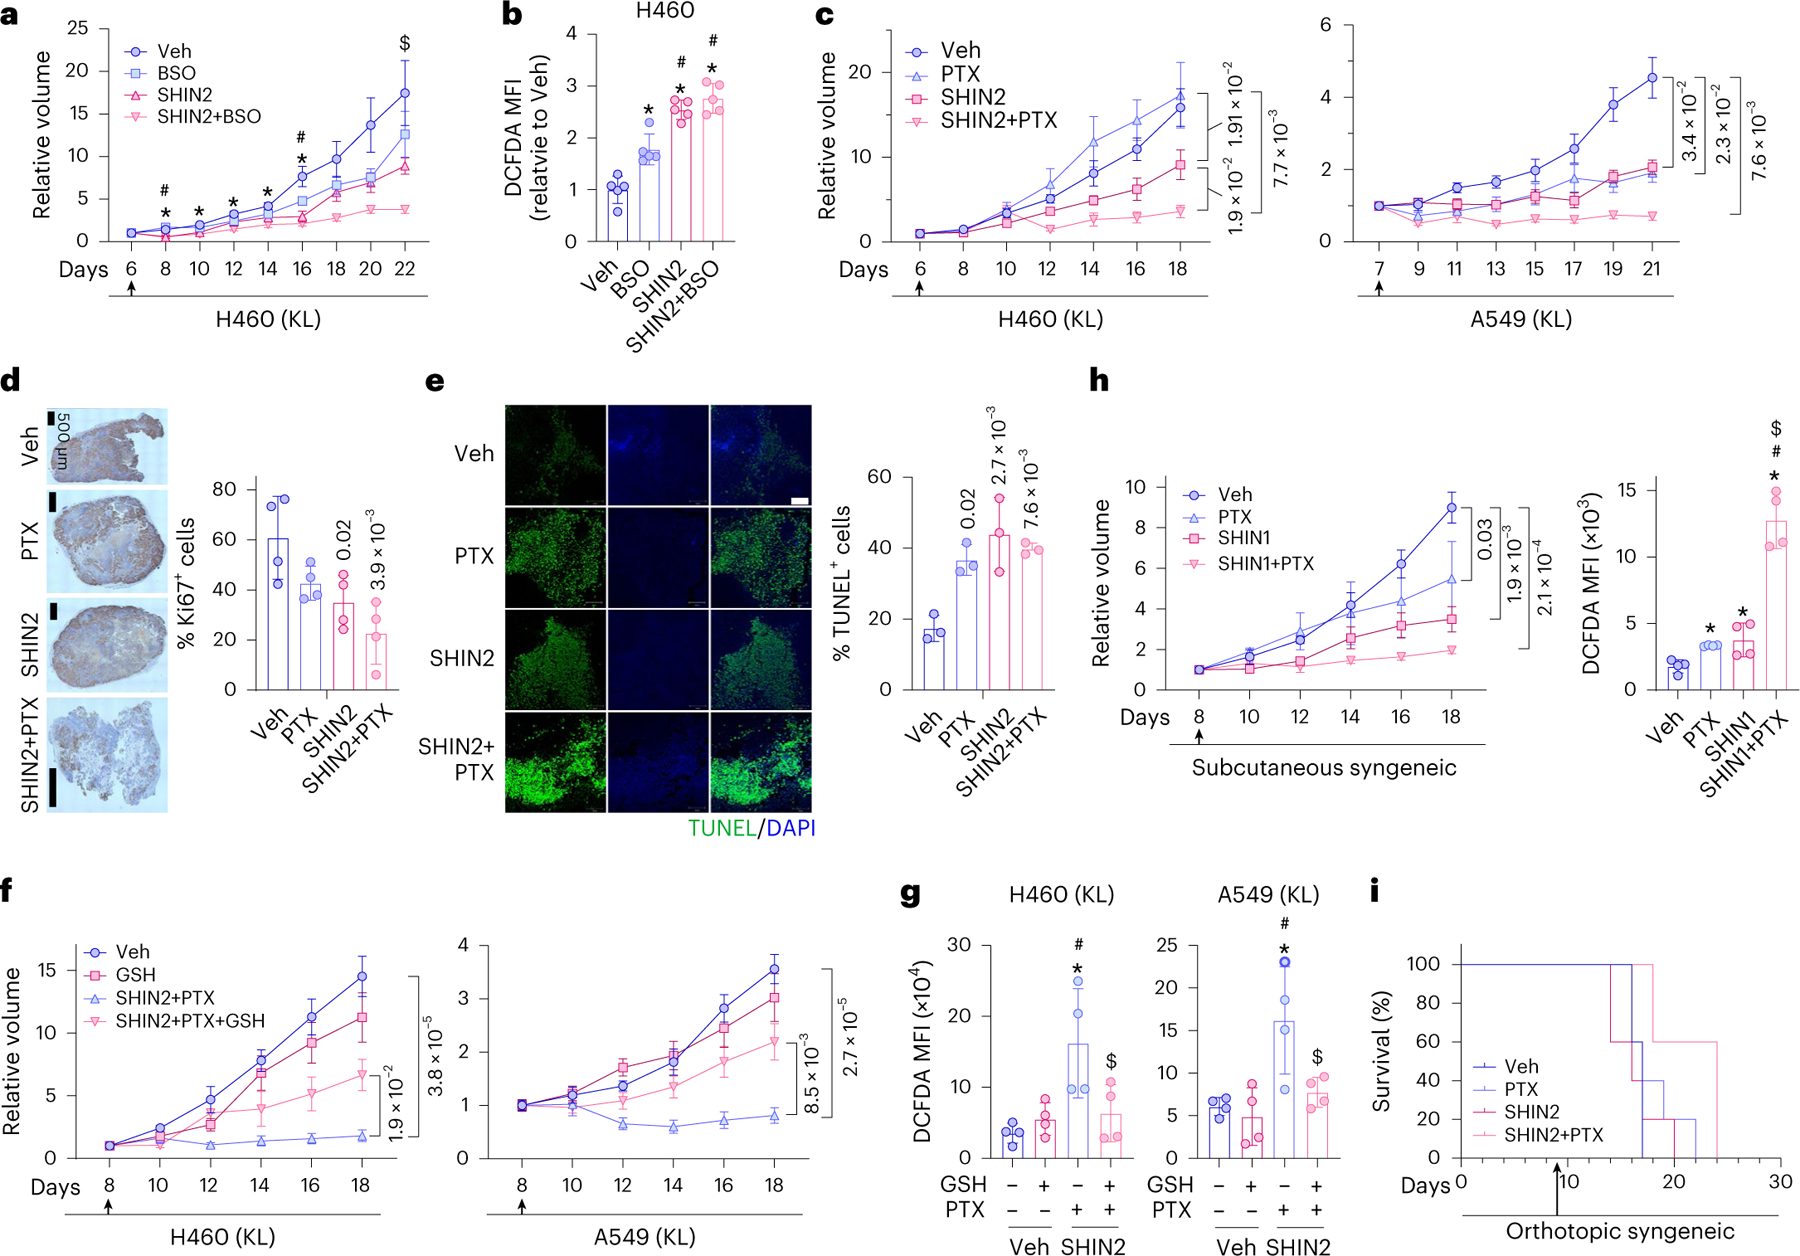
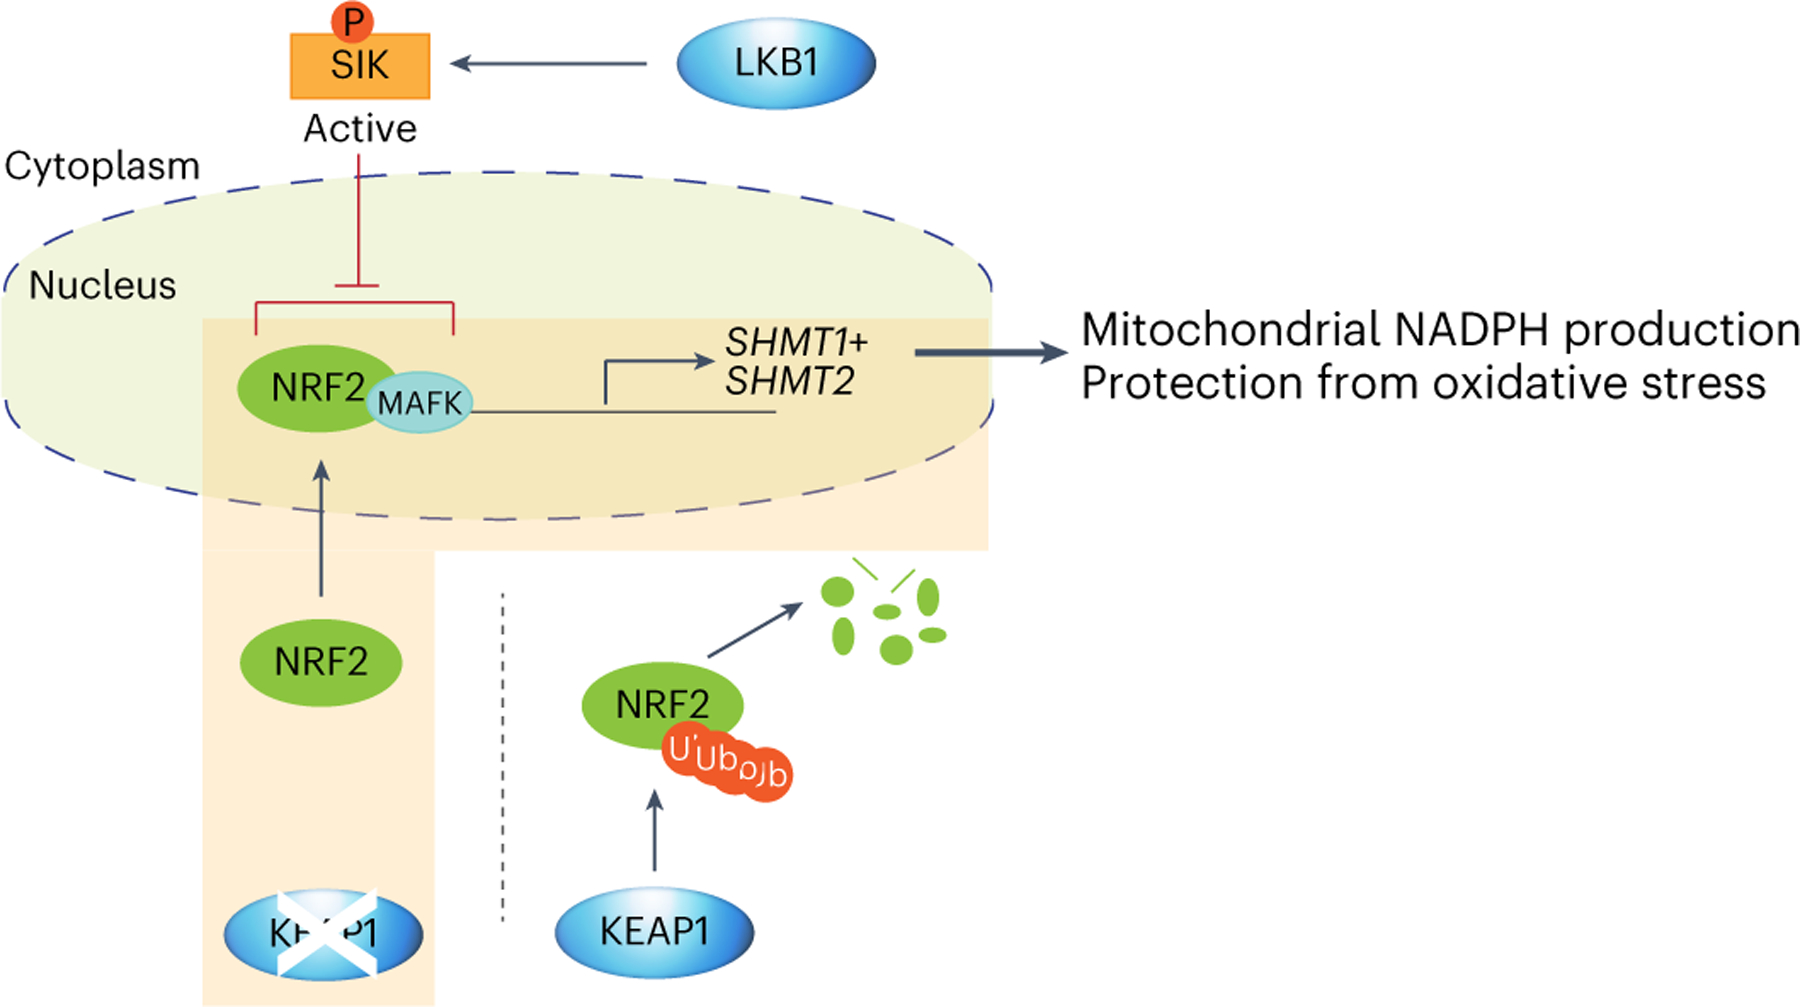
Non-small-cell lung cancer (NSCLC) with concurrent mutations in KRAS and the tumour suppressor LKB1 (KL NSCLC) is refractory to most therapies and has one of the worst predicted outcomes. Here we describe a KL-induced metabolic vulnerability associated with serine-glycine-one-carbon (SGOC) metabolism. Using RNA-seq and metabolomics data from human NSCLC, we uncovered that LKB1 loss enhanced SGOC metabolism via serine hydroxymethyltransferase (SHMT). LKB1 loss, in collaboration with KEAP1 loss, activated SHMT through inactivation of the salt-induced kinase (SIK)-NRF2 axis and satisfied the increased demand for one-carbon units necessary for antioxidant defence. Chemical and genetic SHMT suppression increased cellular sensitivity to oxidative stress and cell death. Further, the SHMT inhibitor enhanced the in vivo therapeutic efficacy of paclitaxel (first-line NSCLC therapy inducing oxidative stress) in KEAP1-mutant KL tumours. The data reveal how this highly aggressive molecular subtype of NSCLC fulfills their metabolic requirements and provides insight into therapeutic strategies.


Conflict of interest statement

Competing interests

W.R.E. and K.O. are employees of the Barer Institute, which is engaged in the clinical development of SHMT inhibitors. H.W. is a consultant for the following pharmaceutical companies: Genentech, Denali Therapeutics, Alector, Surrozen, Cleave Therapeutics, ORIC Pharmaceuticals, Barer Institute, Vincerx, Chinook and Cresenta. J.K. (UTSW) is on the scientific advisory board for Sanofi and is a consultant for Pulmatrix. The other authors declare no competing interests.

Figures

Extended Data Fig. 1 |
Extended Data Fig. 1 |. LKB1 loss in the context of oncogenic KRAS mutations enhances serine and glycine biosynthesis in NSCLC.
a, Metabolite set enrichment analysis using metabolome in an isogenic pair of A549 cells. SGOC metabolism-related pathways are in pink. Dots are colored by enrichment FDR values. b, Volcano plot presenting metabolites whose levels are significantly changed in A549-EV cells compared with A549-LKB1 cells. Blue dots represent metabolite depletion (log2 < -1) and red dots represent metabolite accumulation (log2 > 1) in A549-EV cells. non-SGOC metabolism/folate-methionine cycle intermediates are labeled in grey. c, serine and glycine pool size in H460-EV and -LKB1 cells used for [U-13C]glucose labeling in Fig. 1f. d and e, 13C labeling in glycine in the same set of samples in Fig. 1f (H460 and A549 (d) and H1373 (e) cells). f, Effect of LKB1 on serine m + 2/m + 1 from [U-13C]serine labeling in H460-EV and -LKB1 or H1373-shGFP and -shLKB1. g, Abundance of LKB1 in isogenic pairs of KL NSCLC cells. Vinculin was used as a loading control. h and i, 13C labeling in serine (h) and glycine (i) in a panel of NSCLC cells with different oncogenotypes (K, KRAS mutants; KL, KRAS/LKB1 co-mutants; L, LKB1 mutants)(n = 3 per cell line) cultured with [U-13C]glucose for 6 hours. j, Abundance of LKB1 in EV-, WT LKB1- and KD LKB1-H460 cells. CPS1 was used as a marker for LKB1 activity as reported previously and Actin was used as a loading control. k, 13C labeling in serine in cells used in Fig. 1i and Supplementary Fig. 1 l. l, 13C labeling in glycine in three isogenic pairs of cells cultured with [U-13C]serine for 2 hours. Data are the mean ± s.d. of three independent cultures. Statistical significance was assessed using a two-tailed t-test (c to f, k and l) and a one-way ANOVA (h and i) with the data from each oncogenotype as a group. Metabolomics analysis was done once. All other experiments were repeated three times or more.
Extended Data Fig. 2 |
Extended Data Fig. 2 |. LKB1 loss increases gene expression in serine and glycine biosynthesis pathways.
a and d, Gene expression of serine/glycine biosynthesis enzymes in EV- and LKB1-expressing KL cells (H460 and H2122)(a) and shGFP- and shLKB1-expressing K cells (Calu-6, H1373, and Calu-1)(d) (n = 3). b and c, Abundance of serine/glycine biosynthesis proteins in EV- and LKB1-expressing KL cells (H460 and H2122)(b) and shGFP- and shLKB1-expressing K cells (Calu-1 and H1373)(c). CPS1 was used as a marker of LKB1 expression and Vinculin was used as a loading control. e and f, Gene expression (e) and protein abundance (f) of serine/glycine biosynthesis enzymes in K cells with AMPK silencing. g and h, Gene expression (g) and protein abundance (h) of serine/glycine biosynthesis proteins in EV- and LKB1-expressing KL cells with AMPK silencing. i and j, Gene expression (i) and protein abundance (j) of serine/glycine biosynthesis enzymes in EV- and LKB1-expressing KL cells with Torin treatment (100 nM). k and l, Gene expression (k) and protein abundance (l) of serine/glycine biosynthesis enzymes in EV- and LKB1-expressing KL cells with SIK1 and 3 silencing. Due to lack of good antibodies against SIK1, CRTC2 was used as a surrogate marker for SIK1 silencing. m and n, Gene expression (m) and protein abundance (n) of serine/glycine biosynthesis enzymes in K cells with SIK1 and 3 silencing. CRTC2 was used as a surrogate marker for SIK silencing. o, Gene expression of serine/glycine biosynthesis enzymes in EV- and LKB1-expressing H460 with SIK1 and 3 co-deletion. PEPCK1 and 2 were used as a surrogate marker for SIK1/3 deletion. p, Gene expression of serine/glycine biosynthesis enzymes in EV- and LKB1-expressing H1355 (left) and H2122 (right) with SIK1 deletion. q, Gene expression of SHMT1 and 2 in SIK1-deleted, EV- and LKB1-expressing H460 with or without SIK1 re-expression. Data are the mean ± s.d. of three independent cultures. Statistical significance was assessed using a two-tailed t-test (a, d, e, i and m) and a one-way ANOVA (g, k, o, p and q). All experiments were repeated three times or more.
Extended Data Fig. 3 |
Extended Data Fig. 3 |. SIK1 inhibits SHMT expression through NRF2-MAFK binding to the SHMT promoter region.
a, Chromatin signatures at the SHMT1 and 2 loci in A549 cells. Promoter regions are shaded. b, Chromatin occupancy of NRF2 (left) and MAFK (right) on SHMT2 promoter in EV- and LKB1-expressing H460 cells treated with HG-9-91-01 (n = 5). c, Abundance of MAFK in A549 and H460 cells with MAFK silencing used in Fig. 2h. Vinculin was used as a loading control. d, Promoter design for luciferase assay with wild type (SHMT1 and 2 WT) and ARE-mutated (SHMT1 and 2 mt) promoters of SHMT. ChIP–seq data (H3K27ac ChIP: GSM1003578; MAFK ChIP: GSE127353; H3K4me3 ChIP: GSM2421528) of SHMT1 and 2 loci in A549 cells were used to design the promoter. e, Luciferase assay with ARE-WT and ARE-mt promoters of SHMT1 and 2 in 293 T cells with SIK1 silencing. f, Gene expression of PEPCK1 and SIK1 in SIK1-silenced 293 T cells. PEPCK1 was used as surrogate markers for SIK1 silencing (n = 3). g, Luciferase assay with ARE-WT and ARE-mt promoters of SHMT1 and 2 in 293 T cells with SIK1 overexpression. h, Abundance of FLAG-SIK1 protein in 293 T cells used in g. Vinculin was used as a loading control. i, Gene expression of PEPCK1 and SIK1 with SIK1 deletion in Calu-6. PEPCK1 was used as a surrogate marker for SIK1 deletion (n = 3). j, 13C labeling in glycine in KL cells with A769662 treatment (250 μM) cultured with [U-13C]serine for 2 hours (n = 3). k, Abundance of phospho-ACC in cells used in j. Actin was used as a loading control. l, Left, 13C labeling in glycine in an isogenic pair of H460 cells with AMPKα1/2 deletion cultured with [U-13C]serine for 2 hours (n = 3). Right, Abundance of LKB1 and AMPK in the same set of cells. Vinculin was used as a loading control. m, 13C labeling in glycine in K cells with HG-9-91-01 cultured with [U-13C]serine for 2 hours (n = 3). n, Effect of SIK suppression on m2/m1 serine ratio in H1373 cells. o, 13C labeling in glycine in Calu-6 cells with SIK1 and 3 silencing cultured with [U-13C]serine for 2 hours (n = 3). p, Effect of SIK1 and 3 silencing on m2/m1 serine ratio in Calu-6 cells. Data are the mean ± s.d. of independent cultures indicated in each panel. Statistical significance was assessed using a two-tailed t-test (f, i, j, m to p) and a one-way ANOVA (b, e, g, and l). j and luciferase assay in e were performed twice and all other experiments were repeated three times or more.
Extended Data Fig. 4 |
Extended Data Fig. 4 |. KL NSCLC requires SHMT for survival.
a and b, Abundance of SHMT1 (a) and 2 (b) protein in K (black) and KL (pink) cell lines transfected with a control siRNA or siRNA directed against SHMT1 or 2. Actin and Vinculin were used as a loading control. c, Abundance of SHMT1 (top) and 2 (bottom) protein in EV- and LKB1-expressing H460 cells with SHMT1/2 silencing. Vinculin was used as a loading control. d, Abundance of SHMT1 and SHMT2 protein used in Fig. 3c. Vinculin was used as a loading control. e, Abundance of SHMT2 protein in cells used in Supplementary Fig. 4k. Vinculin was used as a loading control. f and g, Effect of SHMT silencing on KL cell death. Representative dot plots of FACS results/cell lines (f) and quantified data (g) (n = 3). h, Abundance of SHMT1 (top) and 2 (bottom) protein used in Fig. 3d. Vinculin was used as a loading control. i, Left, Effect of SHMT1 (left) and SHMT2 (right) KO on anchorage-independent growth of KL cells (n = 3). Right, Abundance of SHMT1 and 2 in the cells. Vinculin was used as a loading control. j, Effect of siSHMT on an isogenic pair of H460 cell growth (n = 3). k, Effect of SHMT2 re-introduction on anchorage-independent growth of SHMT2 KO H460 cells (n = 6 for control, n = 3 for other conditions). l, Effect of SHIN1 treatment on cell viability in KL cells (n = 5). m, Effect of SHIN1 and 2 on anchorage-independent growth of H460 and A549 (n = 3). n, Effect of SHIN1 and 2 on cell death (n = 3). KL cells are in red-orange whereas K cells are in blue-green. o and p, 13C labeling in glycine in isogenic KL cells with SHIN1 (o) and SHIN2 (p) treatment cultured with [U-13C] serine for 2 hours (n = 3). q, Dose-response curves for two KL PDAC cells with KEAP1 deletion after 72 hours exposure to SHIN1 (n = 6). r, Effect of LKB1 silencing and KEAP1 deletion on siSHMT-induced viability loss in Calu-1 cells (n = 5). s, Effect of AMPK deletion on siSHMT-induced viability loss in two KL cells (n = 6). t, Effect of SHIN2 treatment on cell viability in SIK1 CA-expressing H460 cells (n = 3). u, Abundance of SHMT1, 2 and FLAG protein in the cells used in Fig. 3m. Vinculin was used as a loading control. Data are the mean ± s.d. of independent cultures indicated in each panel. Statistical significance was assessed using a two-tailed t-test (i, j, l and m) and a one-way ANOVA (g, k, n, o, p, and r to t). In t, *p < 0.05 compared to H460-EV with vehicle; #p < 0.05 compared to H460-EV with SHIN2; $p < 0.05 compared to H460-SIK1 CA with vehicle. All experiments were repeated three times or more.
Extended Data Fig. 5 |
Extended Data Fig. 5 |. KL NSCLC requires SHMT for survival.
Abundance of proteins in Fig. 3i (a), 3j (b, right), Supplementary Fig. 4r (b, left), Supplementary Fig. 4n (c, Tubulin was used as a loading control), Supplementary Fig. 4 s (d), Fig. 3l (e), Fig. 3m (f). g, 13C labeling in glycine in EV-, LKB1- and KEAP1-expressing H460 cells cultured with [U-13C]serine for 2 and 6 hours (n = 3). h, Effect of SHMT suppression on NADP+/NADPH ratio in EV-, LKB1- and KEAP1-expressing H460 cells (n = 3). i, Abundance of KEAP1 and LKB1 in the cells used in Supplementary Fig. 5 g. Vinculin was used as a loading control. Statistical significance was assessed using a two-way (g) and a one-way (h) ANOVA. All experiments were repeated twice or more.
Extended Data Fig. 6 |
Extended Data Fig. 6 |. KL NSCLC requires SHMT for redox balance.
a, Effect of metabolic intermediates in SGOC metabolism on SHMT silencing-induced viability loss (n = 6). b, Effect of antioxidants on SHIN1-induced viability loss (n = 5). c, Effect of glycine and formate on SHMT silencing-induced viability loss (n = 5). d, Effect of SHMT silencing on cellular ROS (n = 3). e, Effect of SHIN1 treatment on cellular ROS (n = 3). f, Effect of LKB1 on SHIN1-induced ROS accumulation in two isogenic pair cell lines (n = 3). g, Effect of LKB1 on SHIN1-induced alteration of NADP + /NADPH ratio in two isogenic pair cell lines (n = 3). h, Effect of LKB1 on SHIN1-induced alteration of GSSG/GSH ratio in two isogenic pair cell lines (n = 3). i and j, Relative NADP+ and NADPH levels in SHMT1 (i) and 2 (j) KO KL cells used in Fig. 4g. k and n, Relative NADP+ and NADPH levels in H460 cells (k) and H1373 cells (n) used in Supplementary Fig. 6 g. l and m, Abundance of SHMT1 (l) and 2 (m) protein in cells used in Fig. 4f. Vinculin was used as a loading control. o and p, Relative GSSG and GSH levels in H460 cells (o) and H1373 cells (p) used in Supplementary Fig. 4 h. q, 13C labeling in GSH in an isogenic pair of H460 cells with SHMT silencing cultured with [U-13C]serine for 6 hours (n = 3). r, Effect of MTHFD1 and 2 silencing on cell viability in various K and KL cells (n = 6). s, Abundance of MTHFD1 and 2 protein used in Supplementary Fig. 6r. Vinculin was used as a loading control. t, Time course 13C labeling (left) and 2H labeling (right) in proline in an isogenic pair of H460 cells cultured with [U-13C] glutamine (left) and [2,3,3-2H]serine (right) (n = 3). u, Effect of NADK2 silencing on cell viability in H1355 cells (n = 6). v, Abundance of NADK2 and LKB1 in H460 cells used in Fig. 4k and H1355 used in Supplementary Fig. 6 u. Vinculin was used as a loading control. Data are the mean ± s.d. of independent cultures indicated in each panel. Statistical significance was assessed using a one-way ANOVA (a to k, n to q, and u), and a two-way ANOVA (t). In a, * compared to each siCtrl condition. In b, *p < 0.05 compared to no treatment; #p < 0.05 compared to NAC treatment. In c, *p < 0.05 compared to no treatment; #p < 0.05 compared to glycine treatment; $p < 0.05 compared to formate treatment. In q, *p < 0.05 compared to EV-siCtrl; #p < 0.05 compared to EV-siSHMT1/2; $p < 0.05 compared to LKB1-siCtrl. In u, *p < 0.05 compared to EV-siCtrl; #p < 0.05 compared to LKB1-siCtrl. 13C and 2H labeling (q, t) was performed twice. All other experiments were repeated at least twice or more.
Extended Data Fig. 7 |
Extended Data Fig. 7 |. KL cells require SHMT for antioxidant defenses.
a, Abundance of HA-TPNOX and HA-mitoTPNOX in cells used in Fig. 4m and n. Vinculin was used as a loading control. b and c, Effect of G6PD (left), ME1 (middle), IDH1 (right) silencing on SHMT silencing-induced loss of viability in H2122 cells (b) and H1373 cells (c)(n = 3). d, Abundance of G6PD, ME1, IDH1, SHMT1 and 2 in cells used in Fig. 4o, and p. Vinculin was used as a loading control. e and f, Abundance of G6PD, ME1, IDH1, SHMT1 and 2 in cells used in Supplementary Fig. 7b (e) and c (f). Vinculin was used as a loading control. g and h, Effect of G6PDi (G6PD inhibitor, left), ME1i (ME1 inhibitor, middle), GSK321 (IDH1 inhibitor, right) on SHMT inhibition-induced viability loss in H460 cells (g) and H1373 cells (h)(n = 3). i and j, Effect of G6PDi (left), ME1i (middle), GSK321 (right) on SHMT inhibition-induced alteration of NADP+/NADPH ratio in H460 cells (i) and H1373 cells (j)(n = 3). k, Abundance of NADK2 used in Fig. 4l. Vinculin was used as a loading control. Data are the mean ± s.d. of independent cultures indicated in each panel. Statistical significance was assessed using a one-way ANOVA (b, c, g to j). In b and c, *p < 0.05 compared to EV-siCtrl; #p < 0.05 compared to EV-siSHMT1 + 2; $p < 0.05 compared to EV-siG6PD, ME1 or IDH1. In g to j, *p < 0.05 compared to DMSO; #p < 0.05 compared to SHIN2; $p < 0.05 compared to G6PDi, ME1i or GSK321. All experiments were repeated at least twice or more.
Extended Data Fig. 8 |
Extended Data Fig. 8 |. KL NSCLC requires SHMT for tumor growth in vivo.
a, Growth of H2122 WT (sgCtrl) or SHMT1 KO pools (left) and SHMT2 KO pools (right) xenografts. Relative tumor growth and SEM are shown for each group (n = 5 per group). b, Abundance of SHMT1 and 2 from xenograft tumors with SHMT1 or 2 KO H460 (pools, tumor growth data are shown in Fig. 5a) and H2122 cells (pools, tumor growth data are shown in Supplementary Fig. 8a). Vinculin was used as a loading control. c, Tumor bearing mice in Fig. 5c. d, Abundance of SHMT1 and 2 from xenograft tumors with SHMT1 or 2 KO Calu-6 and H1373 cells (pools, tumor growth data are shown in Fig. 5b). Vinculin was used as a loading control. e, Growth of shGFP- and shLKB1-expressing H1373 xenografts with SHIN1 (100 mg/kg, every day for 16 days); the arrow indicates when SHIN1 was first injected. Relative tumor growth and SEM are shown for each group (n = 5 per group). Data were normalized to first measurement. f, 13C labeling in serine (left) and glycine (right) in mice used in Supplementary Fig. 8e. g, Representative TUNEL staining images of tumor tissues from Fig. 5e. DAPI was used to stain DNA. Scale bars, 100μm. h, TUNEL+ cells in Supplementary Fig. 8 g and total cells/tumor were quantified. i, Left, Representative DCFDA staining images of A549 tumors in the presence and absence of SHIN2 treatment. Right, DCFDA+ cells and total cells/tumor were quantified. Data were normalized to first measurement. Statistical significance was assessed using a two-tailed t-test (h and i), a one-way ANOVA (f), and a two-way ANOVA (a and e). a and d were performed twice. All other experiments are performed once.
Extended Data Fig. 9 |
Extended Data Fig. 9 |. SHMT inhibition enhance therapeutic efficacy of PTX in KL NSCLC in vivo.
a, Growth of A549 xenografts with SHIN2 (100 mg/kg), BSO (20 μM), and SHIN2 plus BSO; the arrow indicates when SHIN2 was first injected. Relative tumor growth and SEM are shown for each group (n = 5 per group). b, Effect of SHIN2 and BSO on cellular ROS in vivo (tissues are from Supplementary Fig. 9a). c, The joint action of combination drug under each model (Response Additive results, Bliss Independence results, and Highest Agent results) is assessed using a combination index. Index score above 0 is considered as a synergy. d, Time course of SHIN2 (left), and PTX (right) concentrations expressed in units of ng/mL of plasma. f, Growth of A549 xenografts treated with SHIN2 (100 mg/kg) plus PTX (10 mg/kg) in the presence and absence of NAC (1 g/L in drinking water); the arrows indicate when SHIN2 was first injected. Tumor volume and SEM are shown for each group (n = 5 per group). g, Left, Representative DCFDA staining images of tumor tissues from Supplementary Fig. 9 f. DAPI was used to stain DNA. Scale bars, 100μm. Right, DCFDA+ cells and total cells/tumor were quantified. e, Growth of H460 (left) and Calu-6 (right) xenografts with SHIN2 (100 mg/kg), MTX (10 mg/kg), and SHIN2 plus MTX; the arrows indicate when SHIN2 was first injected. Relative tumor growth and SEM are shown for each group (n = 5 per group). Data were normalized to first measurement at day 6. h, Left, Dose-response curves for two murine KP and KPL NSCLC cells after 72 hours of exposure to SHIN1 (n = 6). Right, LKB1 status in these cells. Vinculin was used as a loading control. i, Left, Dose-response curves for murine KPL and KPLK NSCLC cells after 72 hours of exposure to SHIN2 (n = 6). Right, KEAP1 and NRF2 status in murine NSCLC cells. Vinculin was used as a loading control. j, Left, BLI signal intensity from H460 cells orthotopically grown with SHIN2 (100 mg/kg), PTX (10 mg/kg) or SHIN2 plus PTX; the arrow indicates when SHIN2 was first injected. Right, mouse body weight in each group. k, Left, Representative Ki67 staining images of orthotopic lung tumors. Scale bar, 2 mm. Right, Ki67+ tumor cells/lung was quantified. l, Left, Full-scan liver H&E images of lung orthotopic tumor xenografts. Scale bar, 2 mm. Right, Tumor area/liver was quantified. m, Left, Representative Ki67 staining images of liver metastases from orthotopic lung tumors. Scale bar, 2 mm. Right, Ki67+ tumor cells/liver was quantified. n, Left, Relative TUNEL staining images of orthotopic syngeneic lung tumors. Scale bar, 100μm. Right, TUNEL+ cells and total cells/tumor were quantified. Data were normalized to first measurement. Statistical significance was assessed using a one-way ANOVA (b, g, k to n) and a two-way ANOVA (a, e, f and j). In a and b, *p < 0.05 compared to vehicle; #p < 0.05 compared to BSO; $p < 0.05 compared to SHIN2. In g, *p < 0.05 compared to vehicle; #p < 0.05 compared to NAC alone; $p < 0.05 compared to SHIN2 plus PTX. j performed three times. All other experiments were performed once.
Extended Data Fig. 10 |
Extended Data Fig. 10 |. KL NSCLC requires SHMT for survival.
a and b, Kaplan–Meier plot associating SHMT1 (a) and SHMT2 (b) mRNA expression with survival. Dataset is from KM Plotter (http://kmplot.com/analysis/index.php?p=service&cancer=lung). c, Representative TMA staining for SHMT1 and 2 shown in Fig. 3h. Scale bars, 200μm. d, Scoring of SHMT1 and 2 expression in TMA samples. Scoring method is described in Methods.
Fig. 1 |
Fig. 1 |. LKB1 loss in the context of oncogenic KRAS mutations enhances serine and glycine biosynthesis in NSCLC.
a, Metabolite set enrichment analysis of human NSCLC tissues harbouring KL mutations compared with those harbouring the K mutation. Metabolic pathways altered in KL human tumours compared with K tumours are shown. SGOC-metabolism-related pathways are shown in pink. Dots are coloured by enrichment false-discovery rate (FDR) P values. b, Volcano plot presenting metabolites whose levels are significantly changed in human KL NSCLC tissues compared with K tumours. Depleted metabolites in KL tumours are shown in blue (log2(fold change (FC) < –1) and enriched metabolites in KL tumours are shown in pink (log2(FC) > 1). c, Schematic diagram of SGOC metabolism. DMG, dimethylglycine; SAM, S-adenosyl methionine; SAH, S-adenosyl homocysteine; Met, methionine; hCys, homocysteine; Glc, glucose; Cys, cysteine. d,e, Sensitivity of isogenic pairs of KL (d, n = 6) and K (e, n = 5) cells to serine and glycine deprivation. f, 13C labelling in serine in isogenic pairs of NSCLC cells cultured with [U-13C]glucose for 6 h (n = 3). g, 15N labelling in serine in isogenic pairs of KL cells cultured with [α-15N]glutamine for 6 h (n = 3). h, Time course of 13C labelling in serine and glycine in H460-EV, H460-LKB1-WT or H460-LKB1-KD cultured with [U-13C]serine (n = 3). i, 13C labelling in glycine in isogenic pairs of NSCLC cells cultured with [U-13C]serine (n = 3). Data represent the mean ± s.d. of the number of independent cultures indicated in each panel. Statistical significance was assessed using a two-tailed t-test (d left,eg,i), a one-way ANOVA (d right) or a two-way ANOVA (h). All experiments were repeated three or more times.
Fig. 2 |
Fig. 2 |. The LKB1–SIK axis inhibits SHMT expression in KRAS-mutant NSCLC.
a, mRNA abundance of PHGDH, PSAT1, PSPH, SHMT1 and SHMT2 in human NSCLC with WT KRAS and LKB1 (WT, n = 285), WT KRAS and mutant LKB1 (L, n = 44), mutant KRAS and WT LKB1 (K, n = 107) and KL mutations (KL, n = 42). Detailed statistical methods are provided in the ‘Statistics’ section of the Methods. Statistical analysis is provided in Supplementary Table 6. Box whiskers extend to the smallest and largest values within 1.5 times the interquartile range (IQR) from the lower and upper hinges, respectively. The box represents IQR, with the lower hinge, upper hinge and centre line corresponding to the 25th, 75th and 50th percentiles. b, Schematic diagram of SGOC metabolism. 5,10-meTHF, 5,10-methylenetetrahydrofolate; 10-formyl-THF, 10-formyltetrahydrofolate; f-Met, N-formylmethionine; 3PG, 3-phospho-D-glycerate; 3PHP, 3-phosphohydroxypyruvate; 3PS, 3-phosphoserine. c,d, Effect of SIK1 KO on SHMT expression in H1373 (c) and H460 (d) cells (n = 3). SIK1 KO efficiency was validated by expression of SIK1, PEPCK1 and PEPCK2, downstream targets of SIK1 (n = 3). sgCtrl, control single guide RNA; sgSIK1, sgRNA targeting SIK1. e, Chromatin occupancy of ATF4 in H460 cells treated with HG-9-91-01 (HG; 250 nM, n = 4). P1–P6 indicates amplicons for promoter regions for ChIP–qPCR. f, Chromatin accessibility at SHMT1 (top) and SHMT2 (bottom) gene loci. Dashed lines represent the genomic regions scanned for DNA motifs of putative bound transcription factors. Blue boxes indicate the presence of NRF motifs. g, Effect of SIK inhibition on chromatin occupancy of NRF2 (left) and MAFK (right) on the SHMT1 promoter (n = 5). h, Effects of siMAFK on SHMT mRNA expression in KL cells (n = 3). i,j, Luciferase assay of ARE-WT and ARE-mutated (mt) promoters of SHMT1 and SHMT2 in K cells treated with HG-9-91-01 (i) or with SIK1 deletion (j) (n = 3). k, Effect of SIK inhibition on the incorporation of [U-13C]serine into glycine in H460 cells (n = 3). l,m, Effects of siSIK1 and siSIK3 treatment (l) or SIK1 deletion (m) on incorporation of [U-13C]serine into glycine in H460 cells (2 h, n = 3). Data represent the mean ± s.d. of the number of independent cultures indicated in each panel. In m, *P < 0.05 compared with EV-sgCtrl; #P < 0.05 compared with EV-sgSIK1; $P < 0.05 compared with LKB1-sgCtrl. Statistical significance was assessed using a two-tailed t-test (c,h), a one-way ANOVA (a,d,e,g,i,j,l and m) or a two-way ANOVA (k). Experiments in e were performed once; those in g–j were performed twice. All other experiments were repeated three or more times.
Fig. 3 |
Fig. 3 |. SHMT is required for KL NSCLC survival.
a, Sensitivity to SHMT1 (left) and SHMT2 (right) silencing in K and KL cells (n = 6). Data are normalized to control siRNA-transfected cells. b, Effect of SHMT silencing on cell growth (n = 9). siSHMT1, siS1; siSHMT2, siS2. Data are normalized to control siRNA-transfected cells. c,d, Effect of LKB1 on siSHMT-induced viability loss in H460 cells (n = 6) (c) and H2122 (n = 6) and H1355 (n = 5) cells (d). Data are normalized to control siRNA-transfected cells. e, Effect of SHMT1 and SHMT2 overexpression on cell-viability loss induced by siSHMT1 (left) or siSHMT2 (right) (n = 3). Data are normalized to control siRNA-transfected cells. f, Effect of SHMT deletion on cell growth, as reflected by doubling time (n = 6). Data are normalized to control sgRNA-infected cells. g, Effect of SHMT deletion on cell viability (n = 6). Data are normalized to control sgRNA-infected cells. h, SHMT1 and SHMT2 expression in tissue microarray tumour samples at different clinical stages (I–IV) (n = 168). Representative tumour staining images are shown in Extended Data Figure 10c. i,j, Effect of LKB1 and KEAP1 on siSHMT-induced viability loss in H460 (i) and Calu-6 (j) cells (n = 5). Data are normalized to control siRNA-transfected cells. k, Left, effect of LKB1 loss on SHIN1-mediated viability loss (n = 5). Right, abundance of NRF2 and KEAP1 in cytosolic (C) and nuclear (N) fractions. LaminB1 was used as a nuclear marker, and tubulin was used as a cytosolic marker. l,m, Effect of SIK deletion on siSHMT-induced viability loss in H460 cells (l, n = 4 for SIK1 KO and n = 6 for SIK3 KO) and two other KL cell lines (m, n = 3 for H2122 and n = 6 for H1355). Data are normalized to control siRNA-transfected cells. n, Effect of SIK1 CA on siSHMT-induced viability loss (n = 3). Data represent the mean ± s.d. of the number of independent cultures indicated in each panel. Statistical significance was assessed using a two-tailed t-test (b,k), a two-tailed Fisher’s exact test (h) or a one-way ANOVA (cg,i,j,ln). In c, *P < 0.05 compared with EV-siCtrl; #P < 0.05 compared with LKB1-siCtrl; $P < 0.05 compared with LKB1-siSHMT. In d and n, P values were calculated through comparison with each EV counterpart in the same condition. In l, *P < 0.05 compared with EV-SIK1 WT with siSHMT; #P < 0.05 compared EV-SIK1 KO with siSHMT; $P < 0.05 compared with LKB1-SIK1 WT with siSHMT; +P < 0.05 compared with LKB1-SIK1 KO with siSHMT. Experiments in b and h were performed once, and all other experiments were repeated three or more times.
Fig. 4 |
Fig. 4 |. KL cells require SHMT for redox homeostasis.
a, Schematic diagram of SGOC metabolism. b, Effect of metabolic intermediates in SGOC metabolism on siSHMT-induced viability loss (n = 6 for H460, n = 5 for H1355). AG, purine nucleosides; CTU, pyrimidine nucleosides. Full description is in Methods. c,d, Effect of metabolites on SHIN1-induced viability loss in KL NSCLC cells (c, n = 6) and two KL PDAC cell lines (d, n = 3). e, Effect of NAC on siSHMT-induced ROS levels (n = 3). DCFDA MFI, mean fluorescence intensity of 2′,7′-dichlorodihydrofluorescein diacetate. f, Effect of SHMT deletion on ROS levels (n = 3). g, Effect of SHMT1 (left) and SHMT2 (right) deletion on the NADP+/NADPH ratio (n = 3). h, Effect of SHMT deletion on the GSSG/GSH ratio (n = 3). i, Left, Schematic of GSH synthesis, illustrating labelling from [U-13C]serine. Right, time course of 13C labelling in GSH from [U-13C]serine (n = 3). j, Left, The committed step of proline biosynthesis is the NADPH-dependent reduction of γ-glutamyl phosphate to pyrolline-5-carboxylate (P5C). Top, incorporation of 2H into P5C. Bottom, 13C incorporation to P5C. GSA, glutamic semialdehyde. Right, 2H labelling of proline from [2,3,3-2H]serine, normalized to 13C labelling of proline from [U-13C]glutamine (n = 3). k, Effect of siNADK2 on cell viability (n = 6, left) and ROS levels (n = 3, right). l, Effect of NADK2 overexpression on siNADK2-induced viability loss (n = 3). m, Effect of TPNOX- or mitoTPNOX-mediated NADPH depletion on cell growth (n = 3). n, Left, Effect of TPNOX- or mitoTPNOX-mediated NADPH depletion on ROS with GSH (n = 3). Right, effect of NADPH depletion on mitochondrial ROS with GSH (n = 3). o,p, Effect of silencing key NADPH-producing enzymes (G6PD, ME1 and IDH1) on siSHMT-induced viability loss (o, n = 3) and on alteration of the NADP+/NADPH ratio (p, n = 3). Data are the mean ± s.d. of the number of independent cultures indicated in each panel. Statistical significance was assessed using a two-tailed t-test (fh,k right), a one-way ANOVA (be,k left,lp) or a two-way ANOVA (i,j). In b (left) and c, the P value was calculated by comparison with each EV counterpart in the same condition. In b (right), *P < 0.05 compared with no treatment, #P < 0.05 compared with NAC treatment. In l, *P < 0.05 compared with H460 with siCtrl; #P < 0.05 compared with H460-EV with siNADK2; $P < 0.05 compared with H460-NADK2 with siCtrl. In o and p, *P < 0.05 compared with siCtrl; #P < 0.05 compared with siSHMT1 and siSHMT2; $P < 0.05 compared with siG6PD, siME1 and siIDH1. DCFDA assays (e,f,k right) and stable-isotope tracing assays (i,j) were performed twice. All other experiments were repeated three or more times.
Fig. 5 |
Fig. 5 |. SHMT suppression inhibits KL NSCLC tumour growth.
a, Growth of H460 sgCtrl or SHMT-KO pools of xenografts (n = 5 per group). b, Growth of sgCtrl or SHMT-KO pools of two K NSCLC xenografts (n = 5). c, Growth of H460 sgCtrl-transfected or SHMT2-KO clone #4 xenografts (n = 5 per group). d, Growth of KL xenografts following treatment with SHIN1 (100 mg kg body−1 weight, QD) or vehicle (Veh). The arrow indicates when SHIN1 was first injected (n = 5 for H460, n = 4 for H2122). e, 13C labelling in serine (left) and glycine (right) in the mice described in d. The discrepancy in numbers between d and e is due to death during infusion. f, Growth of two KL xenografts and one K xenograft following SHIN2 treatment (200 mg kg−1 body weight). The arrow indicates when SHIN2 was first injected (n = 5 for A549, n = 4 for H460, n = 5 for Calu-6). g, 13C labelling in serine (left) and glycine (right) in the mice described in f. The discrepancy in numbers between f and g is due to death during infusion. h, Left, representative TUNEL staining images of the tumour tissues in a. DAPI was used to stain DNA. Scale bar, 100 μm. Right, The percentage of TUNEL+ cells; TUNEL+ cells and total cells per tumour were quantified using Matlab. i, Left, representative Ki67 staining images of the same mouse tissues as in h. Scale bars, 500 μm. Right, the percentage of Ki67+ cells out of the total number cells per tumour. j, Left, Representative TUNEL staining images of tumour tissues in d (H460). DAPI was used to stain DNA. Scale bars, 100 μm. Right, the percentage of TUNEL+ cells out of the total number cells per tumour. k, Left, representative Ki67 staining images of the same mouse tissues as in j. Scale bar, 500 μm. Right, the percentage of Ki67+ cells out of the total number cells per tumour. l, Left, representative DCFDA staining images of the same mouse tissues used in f. DAPI was used to stain DNA. Scale bars, 500 μm. Right, the percentage of DCFDA+ cells out of the total number cells per tumour. Relative tumour growth and s.e.m. are shown for each group, and data were normalized to the first measurement. Statistical significance was assessed using a two tailed t-test (gi), a one-way ANOVA (e,jl) or a two-way ANOVA (ad,f). The mouse xenograft assay (a right,b,c,d right,f) was performed once. Experiments in d (left) were repeated twice, and in a (left) were repeated three times.
Fig. 6 |
Fig. 6 |. SHIN2 and PTX combination treatment more effectively inhibits KL NSCLC tumour growth.
a, Growth of H460 xenografts following treatment with SHIN2 (100 mg kg−1 body weight), BSO (20 μM) or SHIN2 and BSO; the arrow indicates when SHIN2 was first injected (n = 5). b, Effect of SHIN2 and BSO on cellular ROS levels in vivo. c, Growth of KL xenografts following treatment with SHIN2 (100 mg kg−1 body weight), PTX (10 mg kg−1 body weight) or SHIN2 plus PTX; the arrow indicates when SHIN2 or PTX was first injected (n = 5 per group). Data were normalized to the first measurement. d, Left, representative Ki67 staining images of the mouse tissues in c (H460). Scale bars, 500 μm. Right, Ki67+ cells and the total number of cells per tumour were quantified. e, Left, Representative TUNEL staining images of tumour tissues in c (H460). DAPI was used to stain DNA. Scale bar, 100 μm. Right, TUNEL+ cells and the total number of cells per tumour were quantified. f, Growth of KL xenografts treated with SHIN2 (100 mg kg−1 body weight) and PTX (10 mg kg−1 body weight) with or without GSH treatment (5 mM); the arrow indicates when SHIN2 was first injected (n = 5). g, Effect of SHIN2, PTX and GSH on cellular ROS levels in vivo (tissues are those in f). h, Left, growth of subcutaneous syngeneic tumours following treatment with SHIN1 (50 mg kg−1 body weight), PTX (10 mg kg−1 body weight) or SHIN1 and PTX; the arrow indicates when SHIN1 or PTX was first injected (n = 5). Right, effect of SHIN1 and PTX on cellular ROS levels in vivo. i, Survival curves of orthotopic syngeneic mouse models following treatment with SHIN2 (200 mg kg−1 body weight), PTX (10 mg kg−1 body weight) or SHIN2 and PTX; the arrow indicates when SHIN2 or PTX was first injected. Relative tumour growth and s.e.m. are shown for each group and data were normalized to first measurement. Statistical significance was assessed using a one-way ANOVA (b,d,e,g,h right) or a two-way ANOVA (a,c,f,h left). In a, *P < 0.05 between vehicle and combination; #P < 0.05 between BSO and combination; $P < 0.05 between SHIN2 and combination. In b, *P < 0.05 compared with vehicle; #P < 0.05 compared with BSO. In g, *P < 0.05 compared with vehicle; #P < 0.05 compared with GSH; $P < 0.05 compared with PTX and SHIN2. In h, *P < 0.05 compared with vehicle; #P < 0.05 compared with PTX; $P < 0.05 compared with SHIN1 and SHIN2. All experiments were performed once.
Fig. 7 |
Fig. 7 |. Working model.
KEAP1 suppresses NRF2 by ubiquitylation and degradation, and LKB1 regulates NRF2–MAFK-mediated transactivation of SHMT1 and SHMT2 through SIK. Under the condition of concurrent loss of LKB1 and KEAP1, NRF2 is stabilized, enters the nucleus and can transactivate SHMT. Increased SHMT expression and activity contribute to NADPH production for redox balance.

Similar articles

Cited by

References

    1. Lunt SY & Vander Heiden MG Aerobic glycolysis: meeting the metabolic requirements of cell proliferation. Annu. Rev. Cell Dev. Biol 27, 441–464 (2011). - PubMed
    1. Hensley CT, Wasti AT & DeBerardinis RJ Glutamine and cancer: cell biology, physiology, and clinical opportunities. J. Clin. Invest 123, 3678–3684 (2013). - PMC - PubMed
    1. Wallace DC Mitochondria and cancer. Nat. Rev. Cancer 12, 685–698 (2012). - PMC - PubMed
    1. Kim JW et al. Evaluation of myc E-box phylogenetic footprints in glycolytic genes by chromatin immunoprecipitation assays. Mol. Cell. Biol 24, 5923–5936 (2004). - PMC - PubMed
    1. Osthus RC et al. Deregulation of glucose transporter 1 and glycolytic gene expression by c-Myc. J. Biol. Chem 275, 21797–21800 (2000). - PubMed

MeSH terms

Grants and funding