. 2024 Aug;25(8):3456-3485.
doi: 10.1038/s44319-024-00179-6. Epub 2024 Jun 14.

ABIN1 is a negative regulator of effector functions in cytotoxic T cells

Affiliations

ABIN1 is a negative regulator of effector functions in cytotoxic T cells

Sarka Janusova et al. EMBO Rep. 2024 Aug.

Abstract

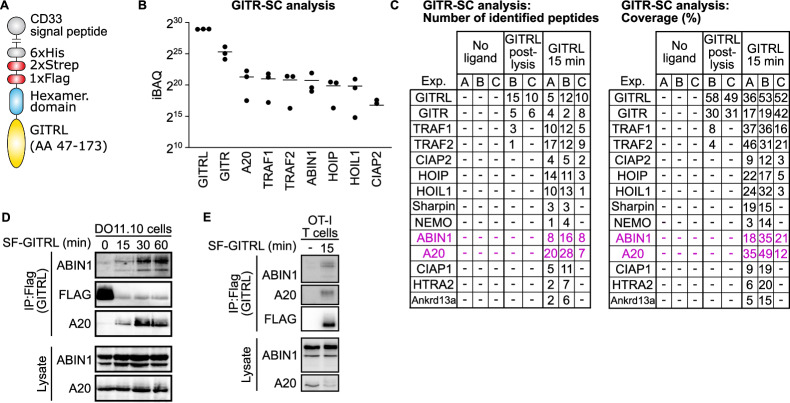
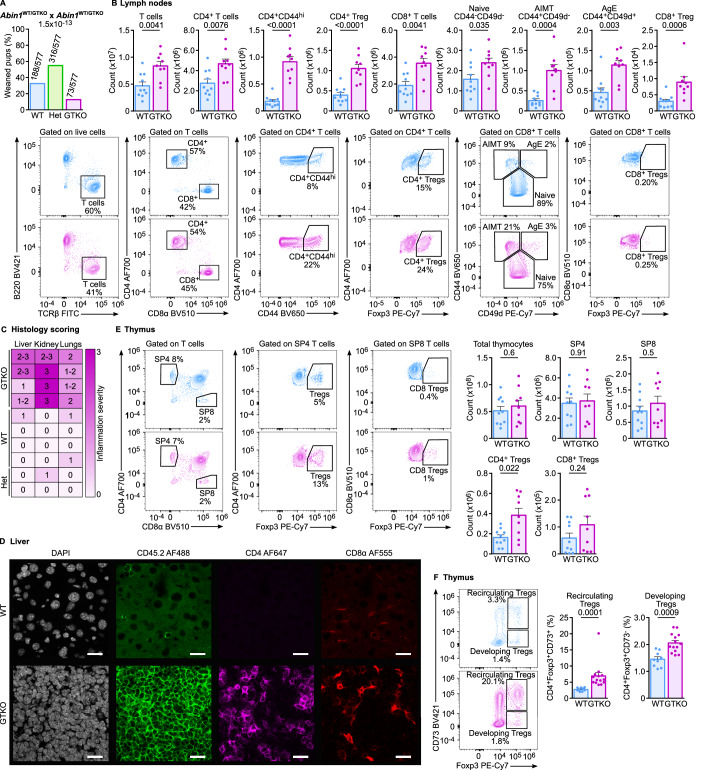
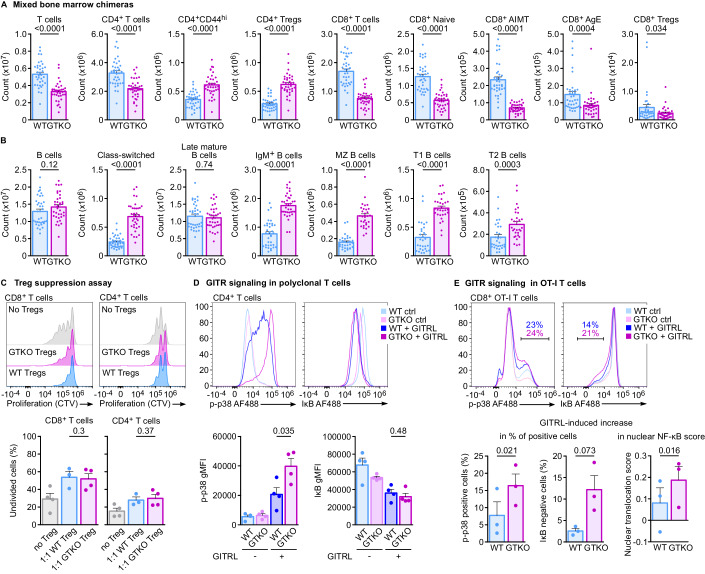
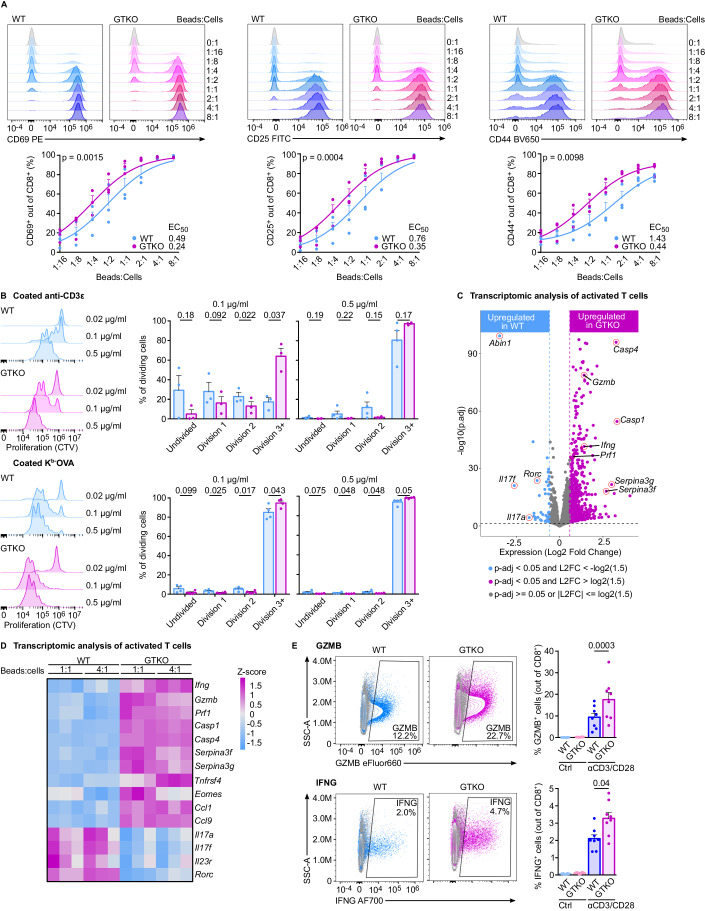
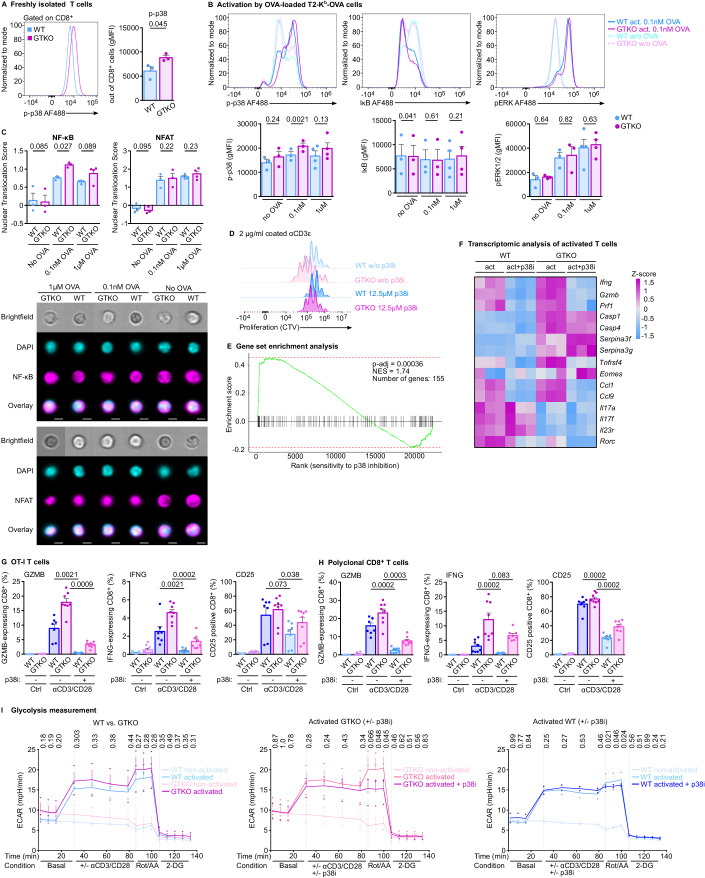
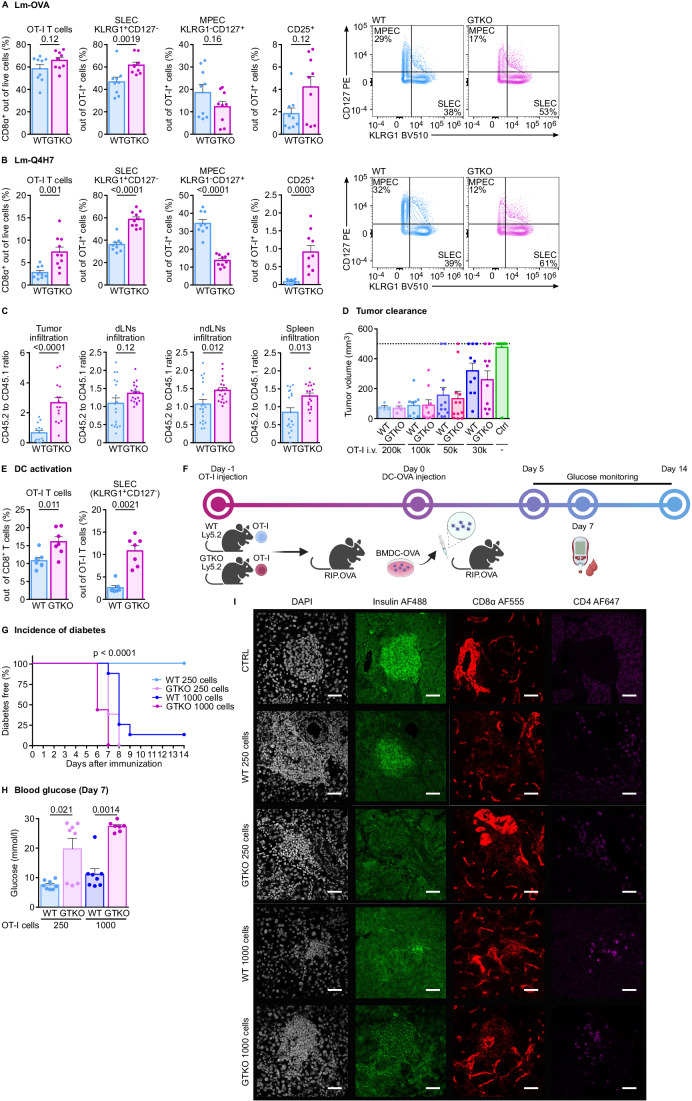
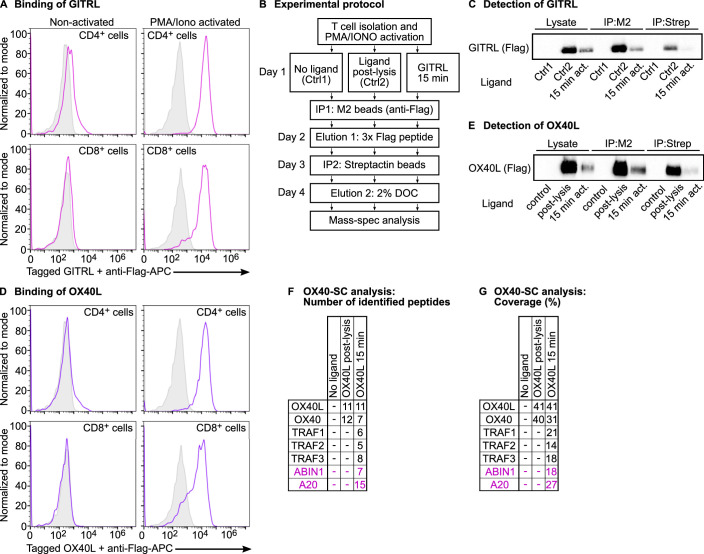
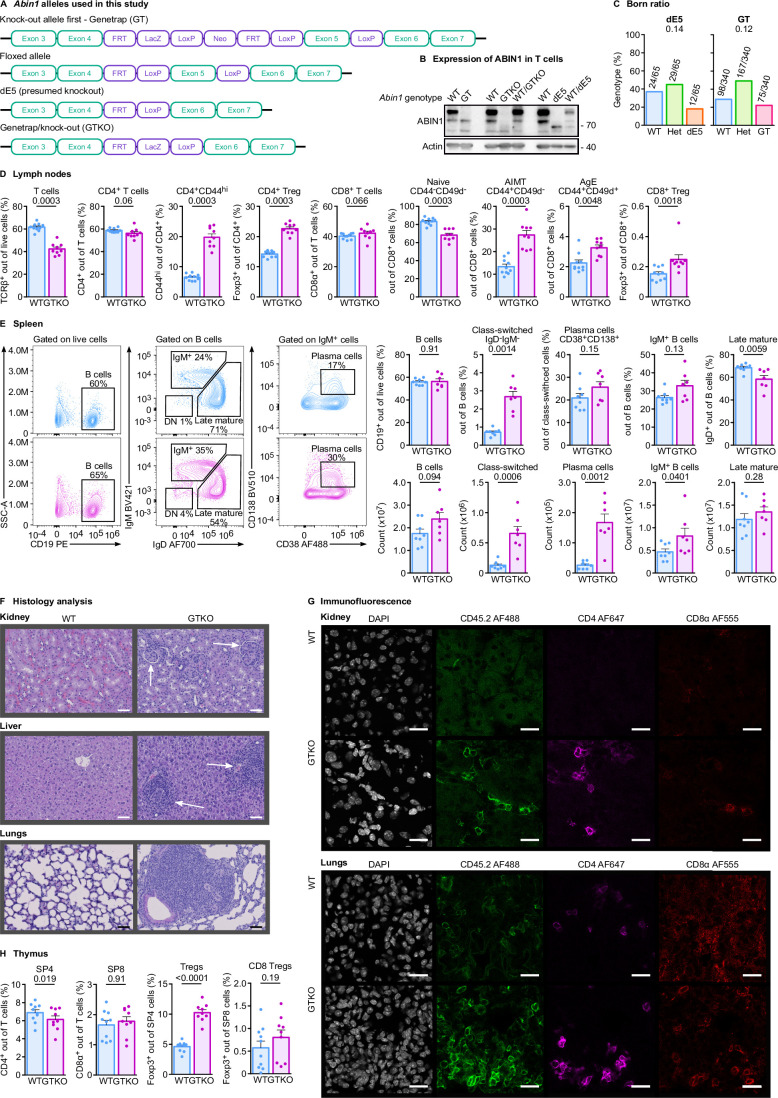
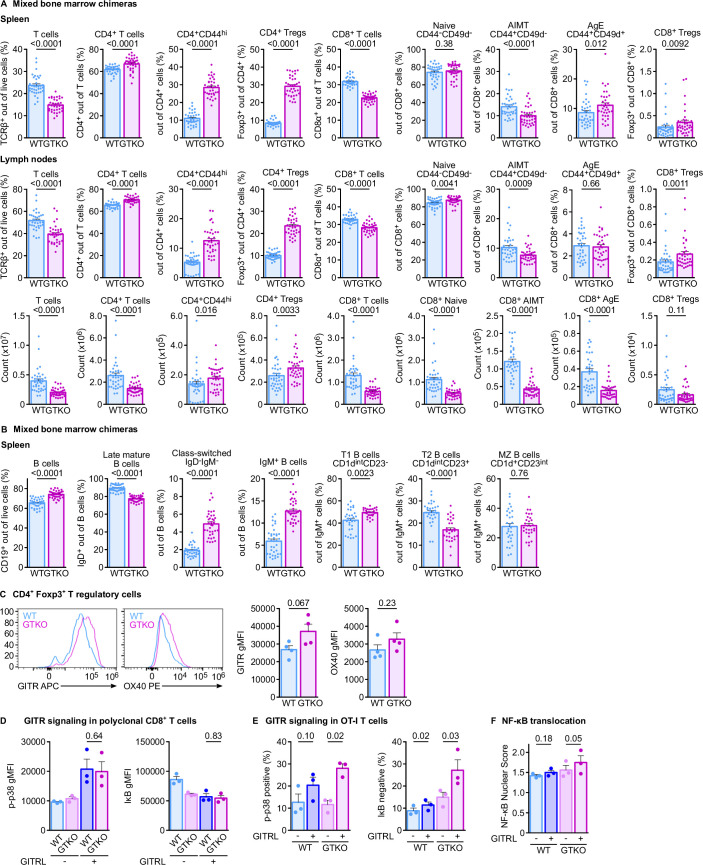
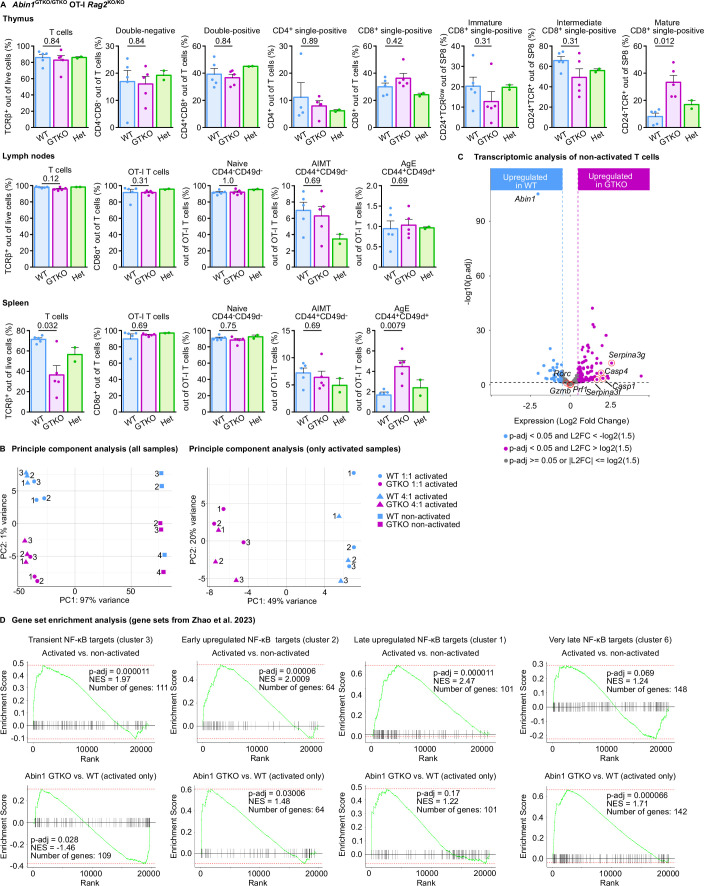
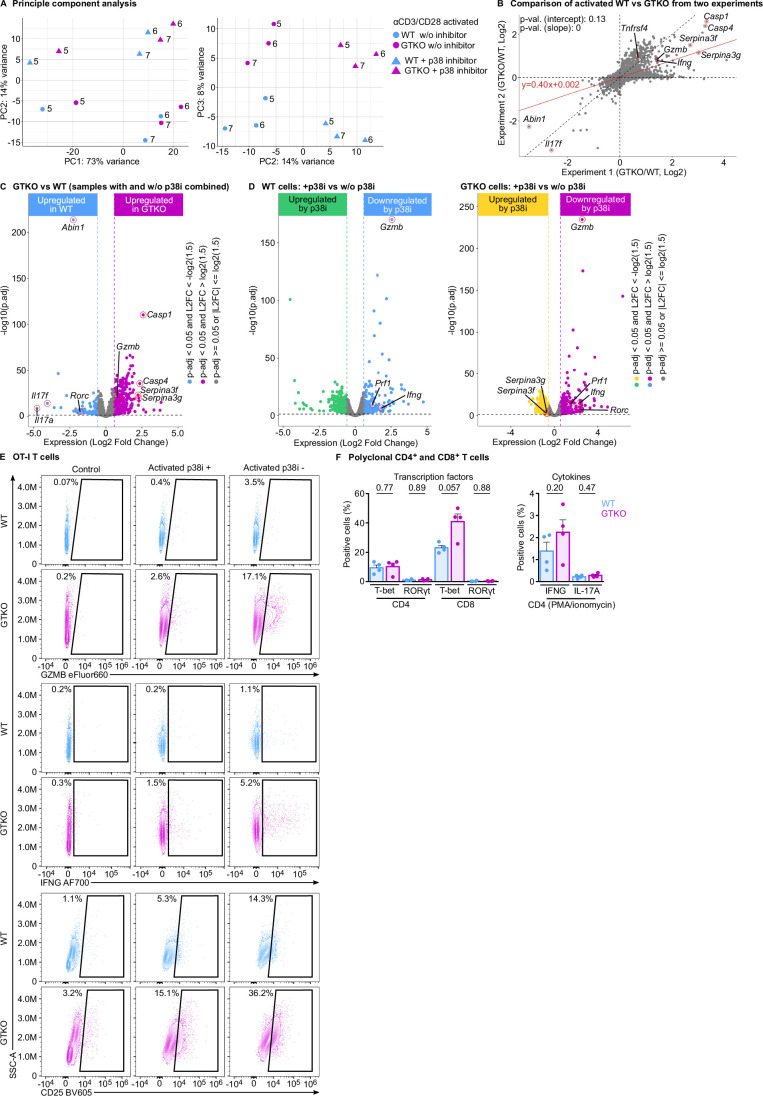
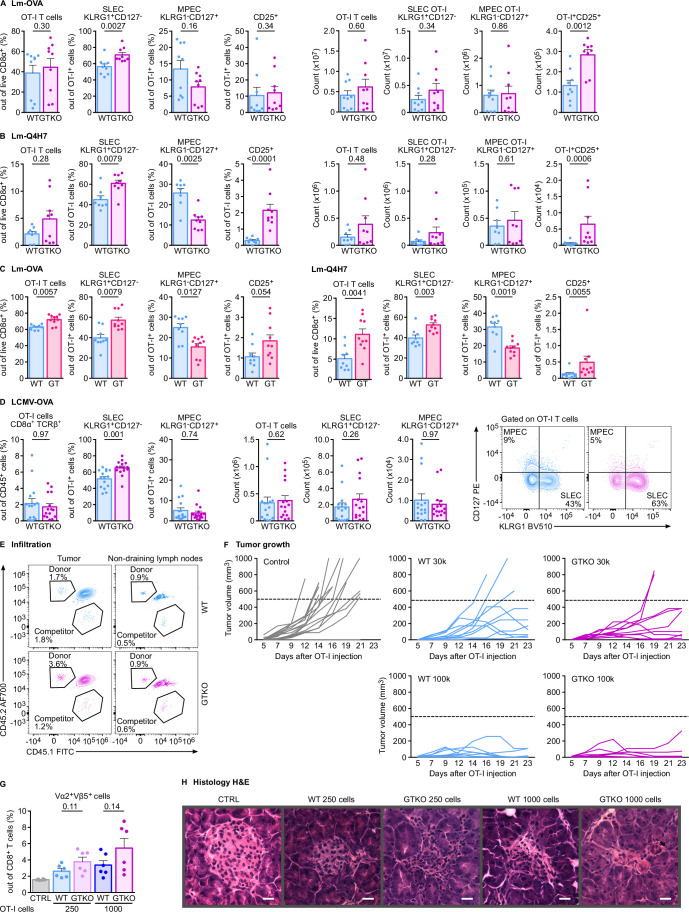
T cells are pivotal in the adaptive immune defense, necessitating a delicate balance between robust response against infections and self-tolerance. Their activation involves intricate cross-talk among signaling pathways triggered by the T-cell antigen receptors (TCR) and co-stimulatory or inhibitory receptors. The molecular regulation of these complex signaling networks is still incompletely understood. Here, we identify the adaptor protein ABIN1 as a component of the signaling complexes of GITR and OX40 co-stimulation receptors. T cells lacking ABIN1 are hyper-responsive ex vivo, exhibit enhanced responses to cognate infections, and superior ability to induce experimental autoimmune diabetes in mice. ABIN1 negatively regulates p38 kinase activation and late NF-κB target genes. P38 is at least partially responsible for the upregulation of the key effector proteins IFNG and GZMB in ABIN1-deficient T cells after TCR stimulation. Our findings reveal the intricate role of ABIN1 in T-cell regulation.

Keywords: ABIN1; Antigen Receptor; Co-stimulation; T Cells; p38.


Conflict of interest statement

The authors declare no competing interests.

Figures

Figure 1
Figure 1. Analysis of the proximal GITR signaling complex (SC).
(A) A schematic depiction of the recombinant GITRL for affinity purification. (B, C) Primary murine T cells were pre-activated with PMA/ionomycin for 72 h and stimulated with the recombinant GITRL for 15 min. The cells were lysed and GITR-SC was isolated via tandem affinity purification and analyzed by mass spectrometry. iBAQ score of GITR-SC proteins identified in all three biological replicates (B) and the number of peptides and coverage of GITR-SC proteins identified in at least two experiments (C) are shown. (D, E) DO11.10 cells (D) or primary mouse OT-I Rag2KO/KO T cells pre-activated with PMA/ionomycin (E) were activated with the SF-GITRL followed by immunoprecipitation and immunoblotting using indicated antibodies. Representative results out of two biological replicates in total are shown. The strong anti-FLAG band in the non-activated control (first lane) (D) is caused by the addition of the SF-GITRL directly to the cell lysate as a control for non-specific post-lysis interactions. Data information: In (B) data are presented as mean. Source data are available online for this figure.
Figure 2
Figure 2. Characterization of the Abin1WT/WT (WT) and Abin1GTKO/GTKO (GTKO) mice.
(A) Heterozygous Abin1WT/GTKO (HET) mice were mated and the genotype of their offspring was determined upon weaning. The frequencies and numbers of pups with particular genotypes are indicated. n = 577 offspring mice in total from 18 breedings. (B) Lymph node cells were stained with indicated antibodies and analyzed by flow cytometry. Representative dot plots and aggregate counts of indicated subsets are shown. n = 10 (WT) or 9 (GTKO) mice per group. (C) Blinded histological scoring of indicated organs of 20–26 week-old mice based on H&E staining. 0—no pathology, 3—very strong leukocyte infiltration and tissue damage. n = 4 (WT and GTKO) or 2 (HET) mice per group. (D) Cryosections of livers of WT and GTKO mice were stained with indicated antibodies and DAPI (nuclei) and analyzed by confocal fluorescence microscopy. Representative sections out of four mice per group in total. (E, F) Fixed and permeabilized thymocytes from WT and GTKO mice were stained with indicated antibodies and analyzed by flow cytometry. (E) Representative dot plots and counts of indicated subsets are shown. n = 10 (WT) or 9 (GTKO) mice per group. (F) Gated SP4 thymocytes are shown. Representative dot plots and the frequencies of indicated subsets among SP4 cells are shown. n = 9 (WT) or 14 (GTKO) mice per group. Data information: In (B, E, F), the data are presented as mean + SEM and P values are indicated. (D) The scale bar represents 20 μm. Statistical significance was determined by a binomial test (A) or two-tailed Mann–Whitney test (B, E, F). AIMT antigen inexperienced memory-like T cells, AE antigen-experienced cells. Source data are available online for this figure.
Figure 3
Figure 3. Intrinsic roles of ABIN1 in T cells.
(A, B) Mixed bone marrow chimeras generated by transplanting Ly5.1/Ly5.2 Abin1WT/WT (WT) and Ly5.2 Abin1GTKO/GTKO (GTKO) bone marrow cells into irradiated Ly5.1 WT hosts, which were analyzed after 8 weeks post transplantation. Splenocytes were stained with the indicated antibodies and analyzed by flow cytometry. Counts of indicated subsets of T cells (A) and B-cell subsets (B) are shown. n = 36 mice per group. (C) CD4+ or CD8+ T cells were labeled with Cell Trace Violet dye (CTV) and FACS-sorted. CD4+ GFP+ (FOXP3+) Treg cells were FACS-sorted from DEREG+ WT or DEREG+ GTKO mice. CTV-loaded CD4+ or CD8+ T cells were mixed with WT Treg or GTKO Treg cells at 1:1 ratio. Cells were co-cultured for 72 h and their proliferation was measured by flow cytometry. As a control, CTV-loaded T cells were cultured alone. Representative histograms and the quantification of undivided cells are shown. n = 3 (WT) or 4 (GTKO) mice per group. (D, E) PMA/ionomycin pre-activated lymph node cells from WT or GTKO mice (D) or WT or GTKO OT-I Rag2KO/KO mice (E) were activated with GITRL or left untreated (controls). Indicated signaling intermediates in CD4+ and CD8+ T cells were analyzed by flow cytometry. (D) Representative histograms and aggregate results of phospho-p38 and IκB levels in CD4+ T cells. n = 4 mice per group. (E) Representative histograms and aggregate results of phospho-p38 and IκB levels in OT-I T cells calculated as the percentage of phospho-p38-positive or IkB-negative cells in the activated sample minus the percentage of respective cells in the non-activated sample. n = 3 mice per group. When applicable, the results are shown as means + SEM and P values are indicated. Statistical significance was determined by two-tailed Mann–Whitney test (A, B). Data information: In (AE) data are presented as mean + SEM and P values are indicated. Statistical significance was determined by two-tailed Mann–Whitney test (A, B), two-tailed Student’s t test (C, D), or two-tailed paired Student’s t test (E). AIMT antigen inexperienced memory-like T cells, AE antigen-experienced cells. Source data are available online for this figure.
Figure 4
Figure 4. ABIN1-deficient T cells are hyper-responsive.
(A) FACS-sorted CD8+ T cells from OT-I Rag2KO/KO Abin1WT/WT (WT) or Abin1GTKO/GTKO (GTKO) mice were activated with anti-CD3/CD28 beads at indicated ratios for 16 h and CD25, CD44, and CD69 was detected by flow cytometry. Representative histograms and aggregate results with log(agonist) vs. response nonlinear regression fits and EC50 values are shown. n = 3 mice per group. (B) Splenocytes and lymph node cells from WT and GTKO mice were FACS-sorted and labeled with Cell Trace Violet Dye. Subsequently, the cells were cultivated in plates coated with indicated concentrations of anti-CD3 antibody or monomeric Kb-OVA for 72 h. Cell proliferation was analyzed by flow cytometry. Representative histograms and quantified frequencies in individual peaks are shown. n = 4 mice per group. (C, D) Lymph node cells from WT or GTKO mice were activated with anti-CD3/CD28 beads at 1:1 or 1:4 ratios for 16 h prior to RNA isolation and RNA sequencing. n = 3 mice per group. (C) A volcano plot. (D) A heatmap showing the differential expression of selected genes. (E) Lymph node cells from WT and GTKO mice were activated with anti-CD3/CD28 beads at 1:1 ratio for 16 h. Expression of GZMB and IFNG was analyzed by flow cytometry. Representative dot plots and aggregate results for indicated groups are shown. n = 8 (WT and GTKO) mice per group. Data information: In (A, B, E), data are presented as mean + SEM and P values are indicated. Statistical significance was determined using the extra sum of squares F test (A), paired t test (B), Wald test with Benjamini–Hochberg multiple testing correction (C), or by two-tailed Mann–Whitney test (E). Source data are available online for this figure.
Figure 5
Figure 5. ABIN1 regulates p38 and NF-κB signaling pathways.
(A) Freshly isolated and immediately fixed and permeabilized splenocytes from Abin1WT/WT OT-I Rag2KO/KO (WT) and Abin1GTKO/GTKO OT-I Rag2KO/KO (GTKO) were stained with anti-phospho-p38 antibody and analyzed by flow cytometry. Representative histograms are shown. n = 3 mice per group. (B, C) OT-I T cells were magnetically sorted (B) or FACS-sorted (C) from the WT and GTKO mice. T2-Kb cells were loaded with indicated concentrations of OVA peptide. Subsequently, CD8+ T cells were activated with T2-Kb cells at 2:1 ratio. (B) Activation of indicated signaling pathways was analyzed by flow cytometry. n = 4 mice per group. Representative histograms are shown. (C) Nuclear translocations of NF-κB p65 and NFAT were analyzed by imaging flow cytometry. The plots show median nuclear translocation scores from 3 (no OVA, 0.1 nM OVA) or 4 (1 μM OVA) mice per group. Representative images are shown. (D) Lymph node cells from WT and GTKO mice were labeled with Cell Trace Violet Dye. Subsequently, the cells were cultured in anti-CD3 coated plates for 72 h with or without p38 MAPK inhibitor SB203580 (12.5 µM) and analyzed by flow cytometry. Representative histograms are shown. n = 4 mice per group. (E, F) Lymph node cells from WT or GTKO mice were activated with anti-CD3/CD28 beads at 1:1 ratio with or without the p38 MAPK inhibitor (12.5 µM) for 16 h prior to RNA isolation and RNA sequencing. n = 3 biological replicates. (E) A gene set enrichment analysis using a set of genes which were upregulated in GTKO vs. WT T cells upon anti-CD3/CD28 in this and the previous set of experiments (Fig. 4C,D; Dataset EV3) and genes ranked according to their sensitivity to p38 inhibition upon activation (irrespective of the genotype). (F) A heatmap showing the differential expression of selected genes. (G, H) Lymph node cells from OT-I WT and GTKO (G) or polyclonal WT and GTKO (H) mice were activated with anti-CD3/CD28 beads at 1:1 ratio with or without the p38 MAPK inhibitor (12.5 µM) for 16 h. Expression of GZMB, IFNG, and CD25 was analyzed by flow cytometry. The frequencies of positive cells are shown. (G) n = 7 (WT), or 8 (GTKO) mice per group. (H) n = 8 mice per group. (I) The glycolysis of OT-I WT and GTKO mice was analyzed by measuring extracellular acidification rate (ECAR) at basal state, after anti-CD3/CD28 activation with or without p38 MAPK inhibitor (12.5 µM), after mitochondrial electron transport chain inhibition by Rotenone/Antimycin A (Rot/AA), and hexokinase inhibition by 2-deoxy-d-glucose (2-DG) as indicated. The p values calculated by two-tailed paired t test are shown for each data point and indicate the comparison between activated WT and GTKO cells (left, n = 3 mice per group), activated GTKO cells with and without p38 inhibition (middle, n = 3), or activated WT cells with and without p38 inhibition (right, n = 2). Data information: In (AC, GI), data are represented as mean + SEM. P value are indicated. (C) The scale bar represents 5 μm. Statistical significance was determined using unpaired t test (A), two-tailed Mann–Whitney test (B, C, G, H) or two-tailed Weighted Kolmogorov–Smirnov test (E), or two-tailed paired t test (I). Source data are available online for this figure.
Figure 6
Figure 6. ABIN1 regulates T-cell responses in vivo.
(A, B) Overall, 1 × 105 T cells from Abin1WT/WT OT-I Rag2KO/KO (WT) or Abin1GTKO/GTKO OT-I Rag2KO/KO (GTKO) were adoptively transferred to Ly5.1 hosts that were infected with Listeria monocytogenes expressing (A) ovalbumin (Lm-OVA) or (B) its lower-affinity variant (Q4H7). Splenocytes were analyzed by flow cytometry on day 6 post infection. Representative dot plots and frequencies of indicated T-cell subsets are shown. (A) n = 9 mice per group. (B) n = 9 (WT) or 10 (GTKO) mice per group. (C) Lymph node cells from Ly5.1 WT OT-I Rag2KO/KO mice were mixed at a 1:1 ratio with cells from Ly5.2 WT or GTKO littermates, and mixed donor cells were adoptively transferred to congenic Ly5.1/Ly5.2 WT mice bearing MC-38 tumors. On day 7 post transfer, the tumors, draining lymph nodes, non-draining lymph nodes, and spleens were analyzed by flow cytometry and the ratio of Ly5.2 (WT or GTKO) to Ly5.1 (WT) donor cells was calculated. n = 18 mice per group. (D) Indicated numbers of lymph node cells from WT and GTKO OT-I mice were adoptively transferred into CD3ε−/− host-bearing MC-38 tumor. No cells were transferred in the control group. The tumor volume was monitored for consecutive 23 days, or up to the endpoint volume of 500 mm3. The maximal tumor volume for each mouse is shown. n = 4 mice for 2 × 105 transferred cells, 9 for 1 × 105 transferred cells, 12 (WT and GTKO) for 5 × 104 transferred cells, 10 for 3 × 104 transferred cells, or 21 for no transfer per group. (E) In total, 1 × 104 WT or GTKO OT-I T cells were adoptively transferred into congenic Ly5.1 mice followed by immunization with 1 × 106 OVA-loaded BMDCs on the next day. The frequency and phenotype of the OT-I T cells was analyzed on day 6 post immunization by flow cytometry. n = 7 mice per group. (FH) Indicated numbers of WT or GTKO OT-I T cells were adoptively transferred to RIP.OVA host mice. On the following day, mice were immunized with OVA-loaded bone marrow-derived dendritic cells. The concentration of glucose in urine was monitored on a daily basis for 14 days and blood glucose was measured on day 7. The mouse was considered diabetic when the concentration of glucose reached 1000 mg/dl in urine. n = 8 mice per group. (F) The scheme of the experiment. (G) Kaplan Meyer curves showing the onset of diabetes. (H) Blood glucose concentration on day 7. (I) In the experimental setup shown in (F), mice have received 250 or 1000 WT or GTKO OT-I T cells as indicated and were sacrificed on day 6. Pancreatic sections of the host mice and control untreated mice were stained with indicated antibodies and DAPI (nuclei) and analyzed by confocal fluorescence microscopy. One pancreatic islet per condition is shown out of four mice per group in total. Please note the background of the anti-CD8α antibody, which is stronger than the specific signal coming from infiltrating CD8+ T cells. Data information: In (AE, H), data are represented as mean + SEM and P values are indicated. (I) The scale bar represents 45 μm. Statistical significance was determined using two-tailed Mann–Whitney test (AC, E, H) or Log-rank (Mantel–Cox) test (G). Source data are available online for this figure.
Figure EV1
Figure EV1. Analysis of the proximal GITR and OX40 signaling complex (SC).
(A) Primary murine T cells were pre-activated with PMA/ionomycin for 72 h or not and stained with the anti-CD4 and anti-CD8 antibodies, recombinant GITRL followed by anti-FLAG antibody. A representative experiment out of 3 biological replicates in total. (B) Illustration of the protocol for the identification of the composition of GITR and OX40 signaling complexes. (C) Detection of the recombinant ligand in the lysate and after the first and second affinity purification step by immunoblotting. A representative experiment out of 3 biological replicates in total. (D) Primary murine T cells were pre-activated with PMA/ionomycin for 72 h or not and stained with the anti-CD4 and anti-CD8 antibodies, recombinant OX40 followed by anti-FLAG antibody. A representative experiment out of 3 biological replicates in total. (EG) Primary murine T cells were pre-activated with PMA/ionomycin for 72 h and stimulated with the recombinant OX40L for 15 min. The cells were lysed and the OX40-SC was isolated via tandem affinity purification and samples were analyzed by mass spectrometry. (E) Detection of the recombinant ligand in the lysate and after the first and second affinity purification step by immunoblotting. Results of the protein identification are shown as the number of peptides (F) and the coverage (G). A single experiment was performed.
Figure EV2
Figure EV2. Characterization of Abin1GT/GT (GT), Abin1dE5/dE5 (dE5), and Abin1GTKO/GTKO (GTKO) mice.
(A) An overview of Abin1 alleles used in this study. (B) Immunoblot analysis of ABIN1 in GT, GTKO, dE5 mice and corresponding littermate controls. A representative experiment is shown. The experiment was performed in 5 (GT), 3 (GTKO), or 2 (dE5) biological replicates. (C) Heterozygous Abin1WT/dE5 or Abin1WT/GT, respectively, were bred and the genotype of the offspring was determined upon weaning. The frequencies and numbers of pups with particular genotypes are indicated. n = 340 (GT) or 65 (dE5) offspring mice per group in total from 16 (GT) or 2 (dE5) breedings. (D) Lymph node cells were stained with indicated antibodies and analyzed by flow cytometry. Aggregate results of the abundance of indicated subsets are shown, n = 10 (WT) or 9 (GTKO) mice per group. (E) Splenocytes were stained with indicated antibodies and analyzed by flow cytometry. Representative dot plots and aggregate results of the frequency of indicated subsets are shown. n = 10 (WT) or 9 (GTKO) mice per group. (F) Histological analysis using H&E staining of indicated organs of 20–26 week-old mice. Arrows pointing to inflammatory foci. Representative staining out of 4 mice per group in total. (G) Cryosections of lungs and kidneys of WT and GTKO mice were stained with indicated antibodies and DAPI (nuclei) and analyzed by confocal fluorescence microscopy. Representative sections out of 4 mice per group in total. (H) Fixed and permeabilized thymocytes from WT and GTKO mice were stained with indicated antibodies and analyzed by flow cytometry. n = 10 (WT) or 9 (GTKO) mice per group. Data information: In (D, E, H), data are represented as mean + SEM and p values are indicated. In (F, G), the scale bars indicate 20 μm and 50 μm, respectively. Statistical significance was determined by a binomial test (A) or two-tailed Mann–Whitney test (D, E, H).
Figure EV3
Figure EV3. Intrinsic roles of ABIN1 in T cells.
(A, B) The experiment shown in Fig. 3A,B. Aggregate results of the frequency and absolute counts of indicated subsets of T cells (A) or B cells (B). n = 36 mice per group. (C) Lymph node cells from WT or Abin1GTKO/GTKO mice were analyzed by flow cytometry. The expression of GITR and OX40 on CD4+ FOXP3+ T cells is shown. Representative histograms and aggregate data are shown. n = 4 mice per group. (D) The experiment shown in Fig. 3D. Lymph node cells from WT or Abin1GTKO/GTKO mice were pre-activated with PMA/ionomycin and stimulated with GITRL or left untreated (controls). Indicated activation pathways were analyzed by flow cytometry. Aggregate results of phospho-p38 and IκB levels in CD8+ T cells. n = 4 mice per group. (E, F) The experiment shown in Fig. 3E. Lymph node cells from WT or Abin1GTKO/GTKO OT-I Rag2KO/KO mice were pre-activated with PMA/ionomycin and stimulated with GITRL or left untreated and analyzed by flow cytometry (E) or flow imaging (F). n = 3 mice per group. (E) The Percentage of phospho-p38 and IκB positive cells is shown. (F) The nuclear translocation score for NF-κB is shown. Data information: In (AE), the data are presented as mean + SEM and P values are indicated. Statistical significance was determined by two-tailed Mann–Whitney test (A, B) or two-tailed Student’s t test (C, D) or one-tailed paired t test (E, F).
Figure EV4
Figure EV4. Characterization of Abin1GTKO/GTKO OT-I mice.
(A) Cells from lymph nodes, spleen, and thymus from Abin1WT/WT OT-I Rag2KO/KO (WT), Abin1GTKO/GTKO OT-I Rag2KO/KO (GTKO), and Abin1WT/GTKO OT-I Rag2KO/KO (HET) were stained with indicated antibodies and analyzed by flow cytometry. Aggregate results of the frequency of indicated subsets are shown. n = 5 (WT and GTKO) or 2 (HET) mice per group. (B) Principal component analysis of the RNAseq experiment shown in Fig. 4C,D. (C) A volcano plot showing the differences in gene expression between non-activated WT and GTKO T cells from the experiment shown in Fig. 4C,D. (D) Four clusters of NF-κB responsive genes with distinct expression kinetics after the antigenic signaling were taken from a study by Zhao et al (Zhao et al, 2023). Using these gene lists, we performed a gene set enrichment analysis for the contrast between activated vs. non-activated OT-I T cells (upper lane) and activated GTKO vs. activated WT OT-I T cells (bottom lane) using the RNAseq data shown in Fig. 4C,D. Data information: In (A), the data are presented as mean + SEM. The statistical significance was calculated using two-tailed Mann–Whitney test (A), Wald test with Benjamini–Hochberg multiple testing correction (C), or Weighted Kolmogorov–Smirnov test (D).
Figure EV5
Figure EV5. Analysis of signaling pathways in ABIN1-deficient T cells.
(AD) The same RNAseq experiment as presented in Fig. 5E,F. n = 3 biological replicates. (A) Principal component analysis of the samples. (B) Comparison of these experiments and the previous set of experiments (presented in Fig. 4C,D) by plotting the fold changes of activated Abin1GTKO/GTKO OT-I Rag2KO/KO (GTKO) vs. Abin1WT/WT OT-I Rag2KO/KO (WT) T cells in both sets of experiments. (C) A volcano plot showing expression changes of activated T cells treated p38 MAPK inhibitor (12.5 µM) for combined WT and GTKO samples. (D) A volcano plot showing expression changes of activated T cells treated or non-treated with p38 MAPK inhibitor (12.5 µM) for WT and GTKO samples separately. (E) Lymph node cells from WT and GTKO OT-I mice from the experiment shown in Fig. 5G. Representative dot plots showing the expression of indicated markers are shown. n = 7 (WT), or 8 (GTKO) mice per group. (F) Lymph node cells from WT or GTKO polyclonal mice were analyzed by flow cytometry for the expression of indicated transcription factors (left) or activated with PMA/ionomycin for 4 h and analyzed by flow cytometry for the production of indicated cytokines (right). n = 4 mice per group. Data information: In (F), data are presented as mean + SEM. The statistical analysis was calculated using two-tailed Wald test with Benjamini–Hochberg multiple testing correction (C, D) or two-tailed Student’s t test (F).
Figure EV6
Figure EV6. ABIN1 regulates T-cell responses in vivo.
(A, B) The experiments as shown in Fig. 6A,B with identical protocol, but using a transfer of 5 × 104 T cells. (A) n = 9 mice per group. (B) n = 8 (WT), or 9 (GTKO) mice per group. Quantified frequencies and counts of indicated subsets of donor cells are shown. (C) 1 × 105 OT-I cells from WT or Abin1GT/GT OT-I Rag2KO/KO (GT) mice were adoptively transferred to Ly5.2 hosts that were infected with Lm-OVA. Splenocytes were analyzed by flow cytometry on day 6 post infection. The frequency of indicated subsets is shown. n = 9 (WT) or 10 (GT) mice per group. (D) 1 × 104 OT-I cells from WT or Abin1GTKO/GTKO OT-I Rag2KO/KO mice were adoptively transferred to the CD3εKO/KO hosts that were infected with LCMV expressing OVA peptide. Splenocytes were analyzed by flow cytometry on day 5 post infection. Representative dot plots and quantified frequencies and absolute counts of indicated subsets of donor cells are shown. n = 15 mice per group. (E) The experiment shown in Fig. 6C. A representative experiment for tumor and non-draining lymph nodes. (F) The experiment shown in Fig. 6D. The tumor growth in individual mice is shown. The dashed line represents the endpoint of the experiment (tumor volume 500 mm3). The genotype and number of transferred OT-I Rag2KO/KO T cells are indicated. (G) In the experimental autoimmune assay (Fig. 6F), splenocytes of the host mice were analyzed by flow cytometry on day 6. The frequency of Vα2+ Vβ5+ cells among all CD8+ T cells was quantified as a proxy for donor OT-I T cells. n = 6 mice per group. (H) Pancreatic cryosections (same experiments as shown in Fig. 6I) were stained with hematoxylin and eosin and imaged by microscopy. Data information: In (AD, G), data are presented as mean + SEM. In (H), the scale bars represent 20 μm. The statistical significance was calculated using two-tailed Mann–Whitney test (AD) or two-tailed Student’s t test (G).

Similar articles

References

    1. Alexander J, Payne JA, Murray R, Frelinger JA, Cresswell P (1989) Differential transport requirements of HLA and H-2 class I glycoproteins. Immunogenetics 29:380–388 10.1007/BF00375866 - DOI - PubMed
    1. Callahan JA, Hammer GE, Agelides A, Duong BH, Oshima S, North J, Advincula R, Shifrin N, Truong HA, Paw J et al (2013) Cutting edge: ABIN-1 protects against psoriasis by restricting MyD88 signals in dendritic cells. J Immunol 191:535–539 10.4049/jimmunol.1203335 - DOI - PMC - PubMed
    1. Chan S, Belmar N, Ho S, Rogers B, Stickler M, Graham M, Lee E, Tran N, Zhang D, Gupta P et al (2022) An anti-PD-1-GITR-L bispecific agonist induces GITR clustering-mediated T cell activation for cancer immunotherapy. Nat Cancer 3:337–354 10.1038/s43018-022-00334-9 - DOI - PMC - PubMed
    1. Connolly KA, Kuchroo M, Venkat A, Khatun A, Wang J, William I, Hornick NI, Fitzgerald BL, Damo M, Kasmani MY et al (2021) A reservoir of stem-like CD8(+) T cells in the tumor-draining lymph node preserves the ongoing antitumor immune response. Sci Immunol 6:eabg7836 10.1126/sciimmunol.abg7836 - DOI - PMC - PubMed
    1. Cox J, Hein MY, Luber CA, Paron I, Nagaraj N, Mann M (2014) Accurate proteome-wide label-free quantification by delayed normalization and maximal peptide ratio extraction, termed MaxLFQ. Mol Cell Proteom 13:2513–2526 10.1074/mcp.M113.031591 - DOI - PMC - PubMed

MeSH terms

Substances