. 2024 Jul;25(7):1270-1282.
doi: 10.1038/s41590-024-01862-5. Epub 2024 Jun 14.

Genetic and environmental interactions contribute to immune variation in rewilded mice

Affiliations

Genetic and environmental interactions contribute to immune variation in rewilded mice

Oyebola Oyesola et al. Nat Immunol. 2024 Jul.

Abstract

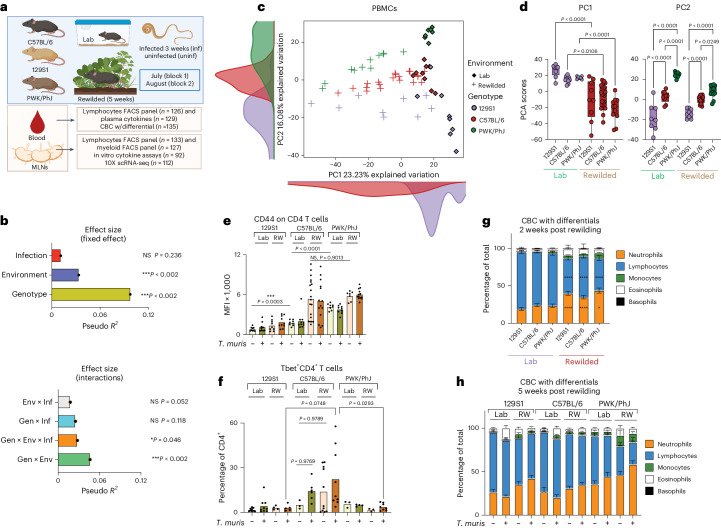
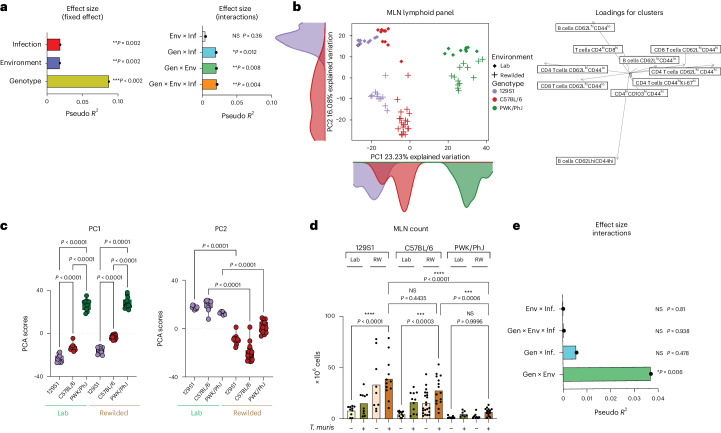
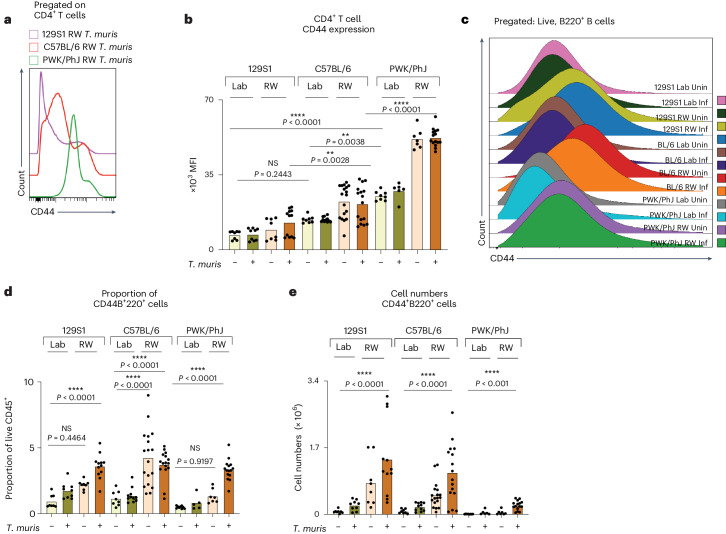
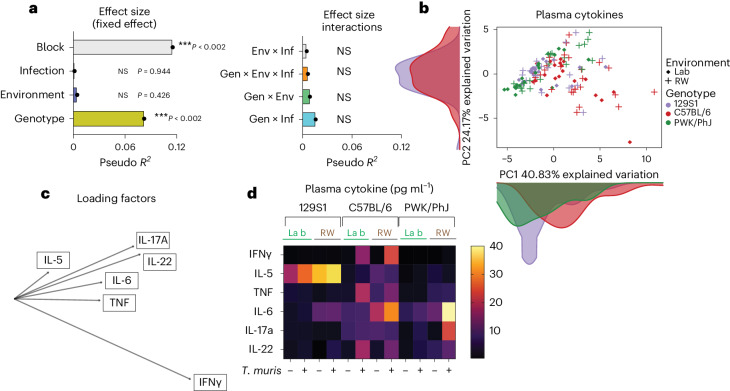
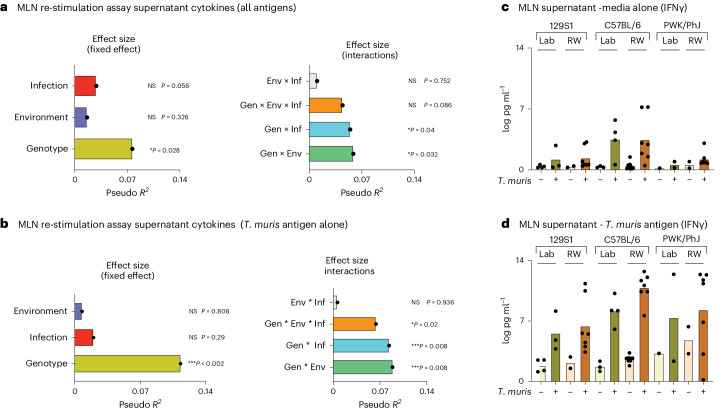
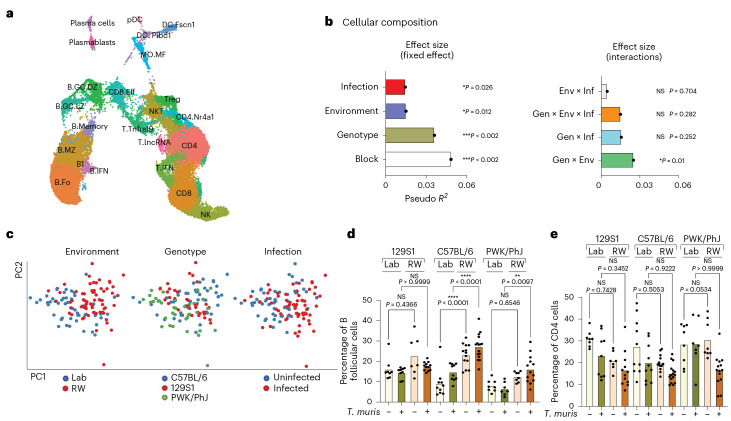
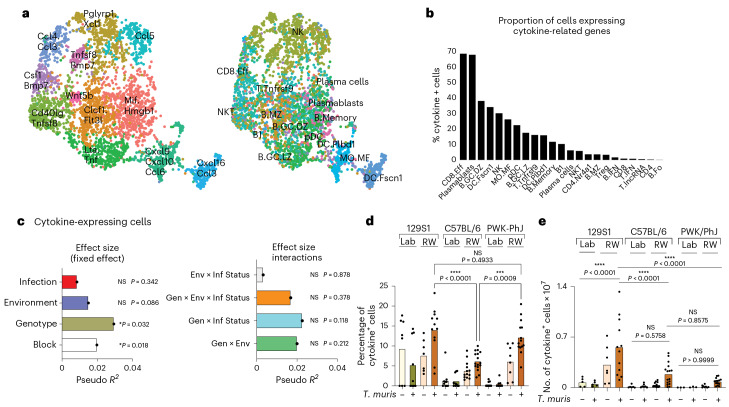
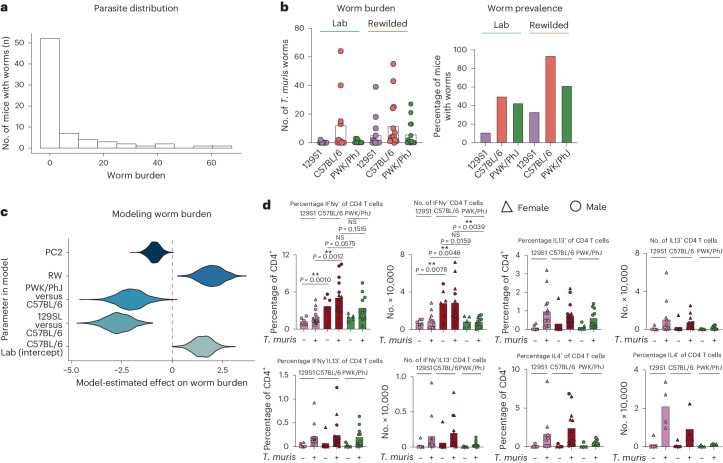
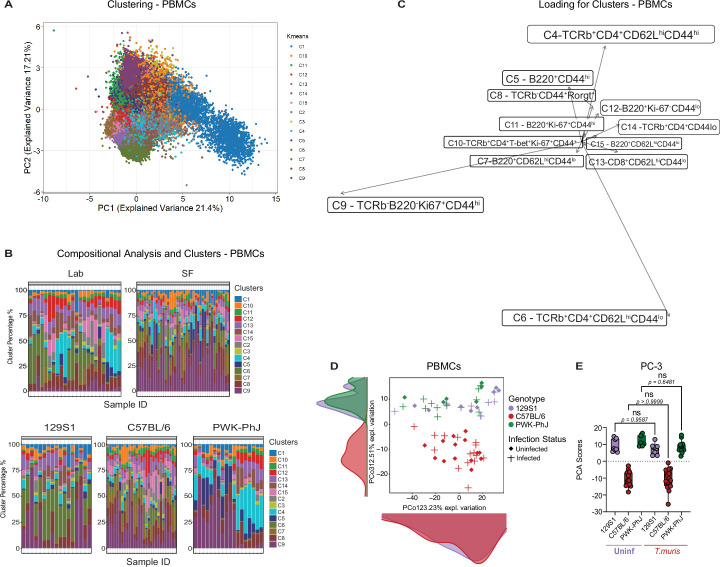
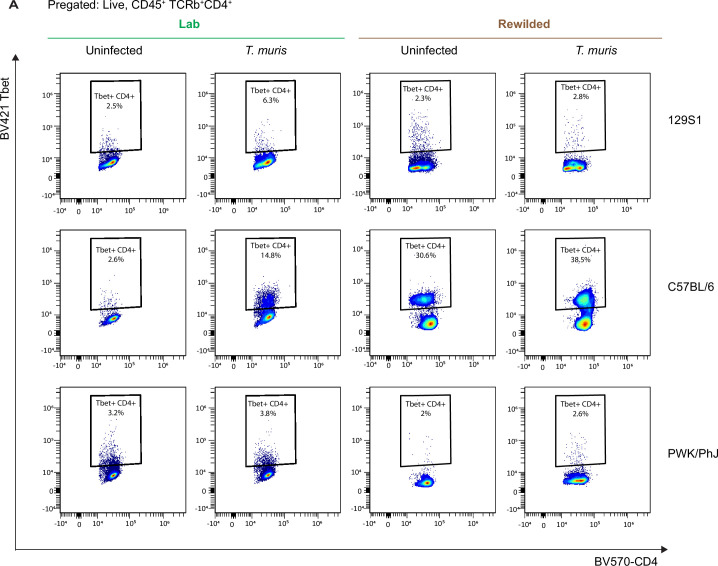
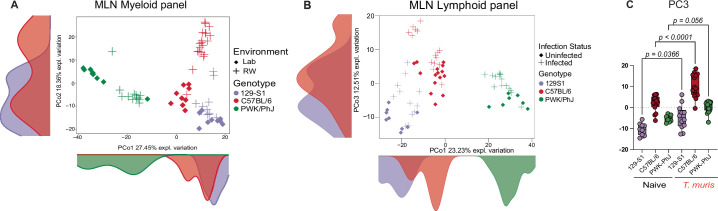
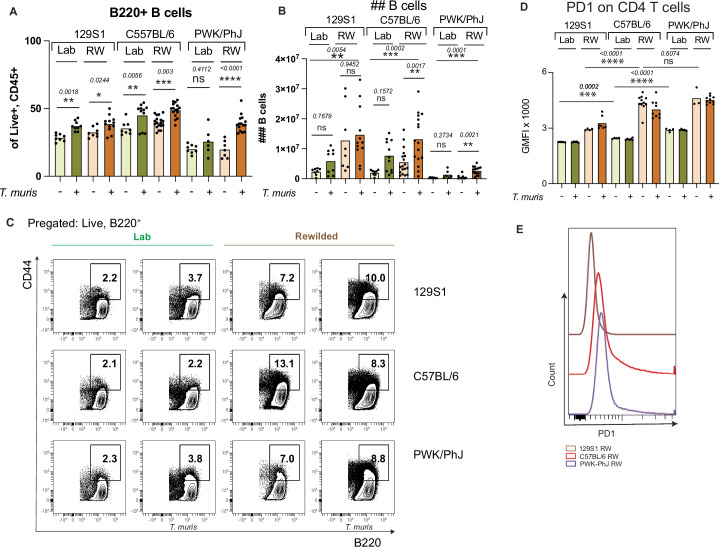
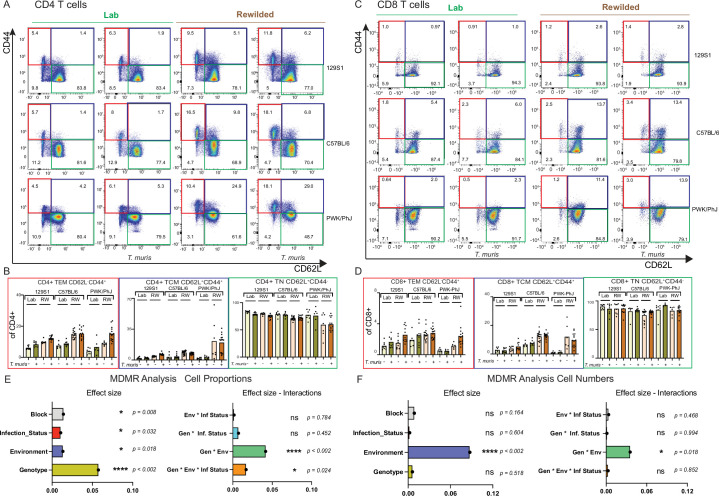
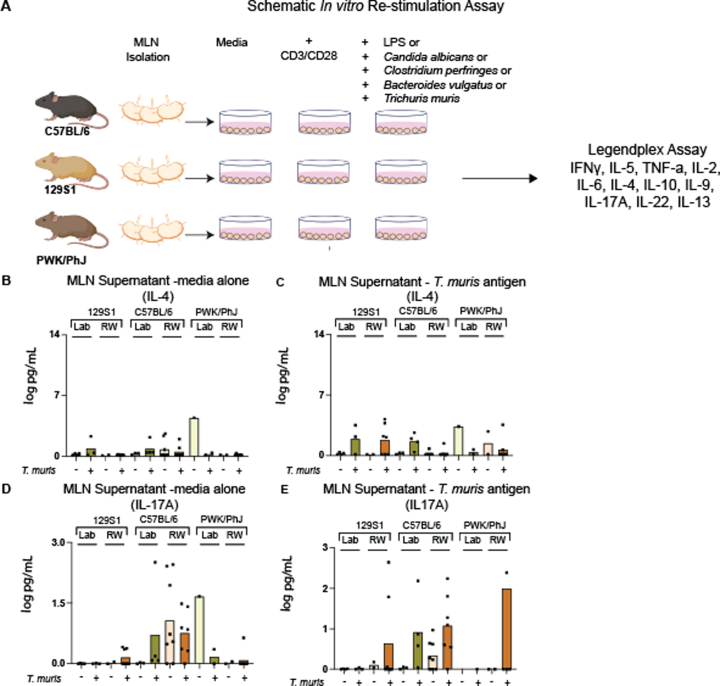
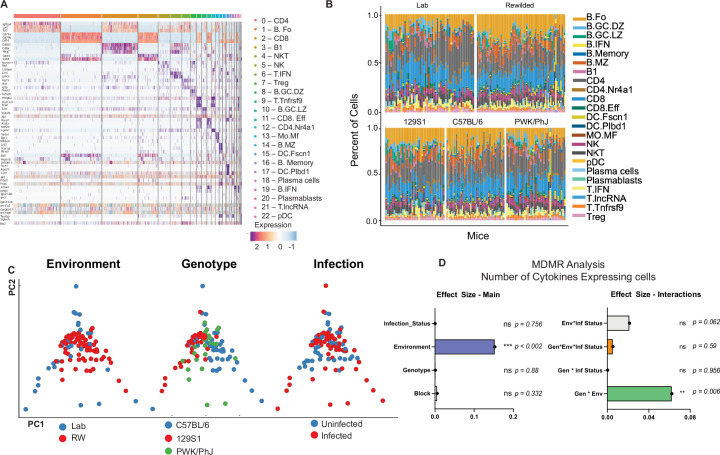
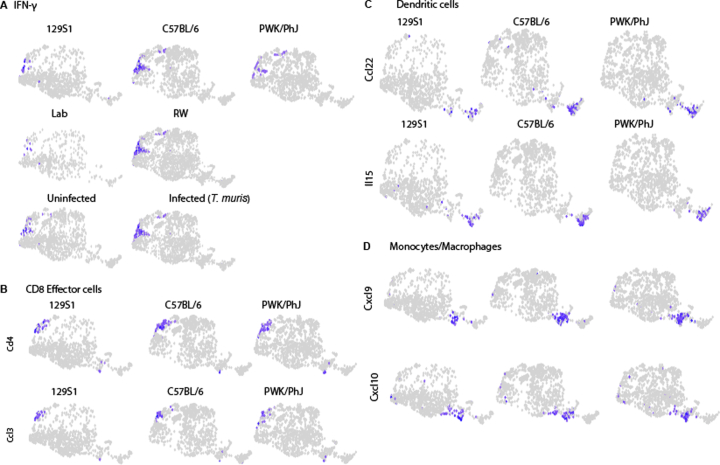
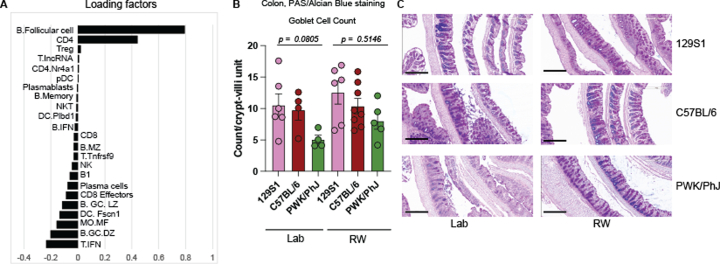
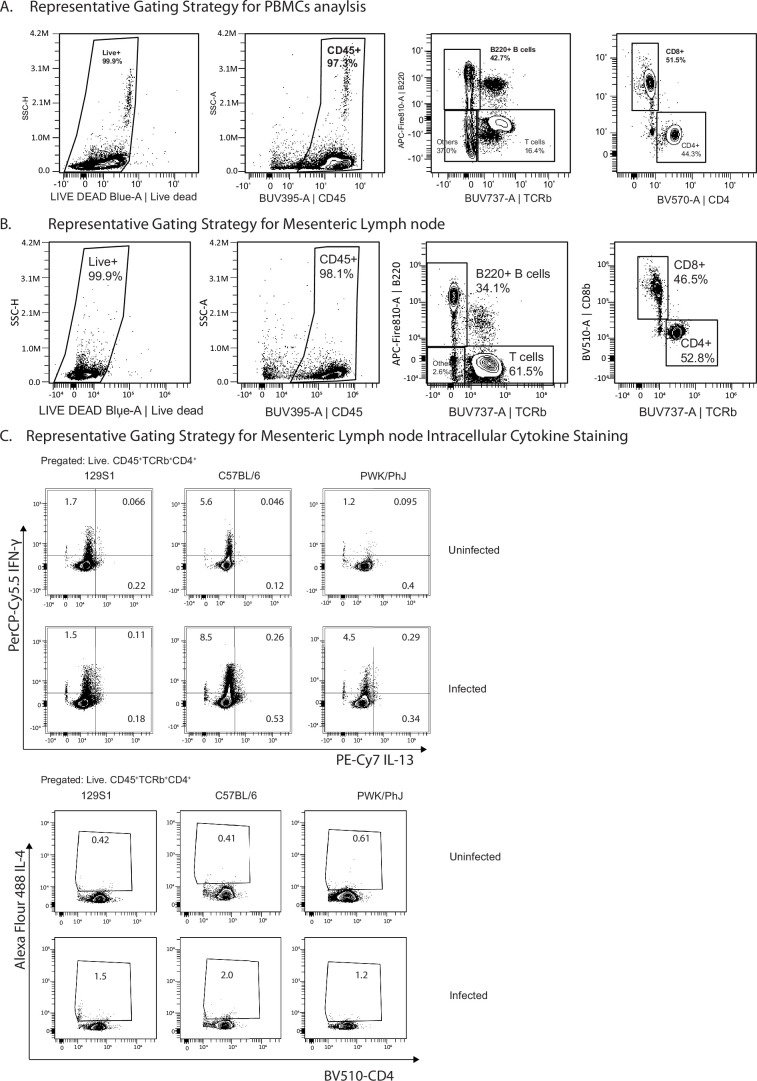
The relative and synergistic contributions of genetics and environment to interindividual immune response variation remain unclear, despite implications in evolutionary biology and medicine. Here we quantify interactive effects of genotype and environment on immune traits by investigating C57BL/6, 129S1 and PWK/PhJ inbred mice, rewilded in an outdoor enclosure and infected with the parasite Trichuris muris. Whereas cellular composition was shaped by interactions between genotype and environment, cytokine response heterogeneity including IFNγ concentrations was primarily driven by genotype with consequence on worm burden. In addition, we show that other traits, such as expression of CD44, were explained mostly by genetics on T cells, whereas expression of CD44 on B cells was explained more by environment across all strains. Notably, genetic differences under laboratory conditions were decreased following rewilding. These results indicate that nonheritable influences interact with genetic factors to shape immune variation and parasite burden.


Conflict of interest statement

K.C. has received research funding from Pfizer, Takeda, Pacific Biosciences, Genentech and Abbvie, and P.L. has received research funding from Pfizer. K.C. has consulted for or received an honorarium from Puretech Health, Genentech and Abbvie. K.C. is an inventor on US patent 10,722,600 and provisional patents 62/935,035 and 63/157,225. S.B.K. acknowledges funding from Micreos and KymeraTx in the past 3 years. P.L. and O.O. are federal employees. The other authors declare no competing interests.

Figures

Fig. 1
Fig. 1. Gen × Env interactions drive PBMC immune variation.
a, Experimental design. b, Bar plots showing the pseudo R2 measure of effect size of predictor variables and interactions as calculated by MDMR (n = 64; 17 129S1, 29 C57BL/6 and 18 PWK/PhJ mice). c, PCA of immune cell clusters identified by unsupervised clustering (n = 64; 17 129S1, 29 C57BL/6 and 18 PWK/PhJ mice) in the blood. d, Box plot showing variance on PC1 and PC2 axes of PCA plots in c. The box plot center line represents median, the boundaries represent IQR, with the whiskers representing the upper and lower quartiles ±1.5 × interquartile range (IQR); all individual data points are shown (129S1 Lab = 8, C57BL/6 = 9, PWK/PhJ Lab = 7, 129S1 RW = 9, C57BL/6 RW = 20, PWK RW = 11). e,f, Bar plots showing GMFI of CD44 on blood CD4+ T cells (e), and percentage of Tbet+ CD4 T cells of Live, CD4+ T cells (f) (Block 2 only, n = 64). g,h, Bar plots showing percentages of neutrophils, lymphocytes, monocytes, eosinophils and basophils out of total at 2 weeks post rewilding (n = 139, 40 129S1, 52 C57BL/6, 47 PWK/PhJ over two experimental blocks), *P < 0.05, ****P < 0.0001 (see details in the Source Data) (g), and 5 weeks post rewilding based on assessment by CBC with differentials (n = 135, 41 129S1, 51 C57BL/6, 43 PWK/PhJ over two experimental blocks) (h) (full raw dataset can be found in Supplementary Data 4). Statistical significance was determined based on MDMR analysis with R package (b) or based on one-way ANOVA one-tailed test between different groups with GraphPad software (df). For e and f, direct comparison was done between groups of interest with one-way ANOVA test. For g, two-way ANOVA with Tukey’s multiple comparison was done to calculate column effect. Data are displayed as mean ± s.e.m. and for d, e and f bar plots dots represent individual mice. Not significant (NS) P > 0.05; *P < 0.05; **P < 0.01; ***P < 0.001; ****P < 0.0001. MFI, mean fluorescence intensity; RW, rewilded. Source data
Fig. 2
Fig. 2. Gen × Env × Inf interactions drive MLN variation.
a, Bar plots showing the pseudo R2 measure of effect size of predictor variables and interactions as calculated by MDMR. Block 2 (n = 73; 21 129S1, 30 C57BL/6 and 22 PWK/PhJ mice). b, PCA of immune cell clusters identified by unsupervised clustering in the MLN with the lymphoid panel and the loading factor of each population along the PCA. Block 2 (n = 73; 21 129S1, 30 C57BL/6 and 22 PWK/PhJ mice). c, Box plot showing variance on PC1 and PC2 axes of PCA plots in a. The box plot center line represents median, the boundaries represent IQR, with the whiskers representing the upper and lower quartiles ±1.5 × IQR; all individual data points are shown (129S1 Lab = 10, C57BL/6 = 10, PWK/PhJ Lab = 9, 129S1 RW = 11, C57BL/6 RW = 20, PWK/PhJ RW = 13). d, MLN cell count from each mouse group, n = 136, 129S1 Lab Uninfected = 10, 129S1 Lab T. muris = 10, 129S1 RW Uninfected = 9, 129S1 RW T. muris = 12, C57BL/6 Lab Uninfected = 11, C57BL/6 Lab T. muris = 11, C57BL/6 RW Uninfected = 21, C57BL/6 RW T. muris = 15, PWK/PhJ Lab Uninfected = 8, PWK/PhJ Lab T. muris = 7, PWK/PhJ RW Uninfected = 8, PWK/PhJ RW T. muris = 14. e, Pseudo R2 measure of effect size of predictor variables and interactions as calculated by MDMR analysis based on MLN cell count (n = 136 over two experimental blocks, 129S1 = 41, C57BL/6 = 58, PWK/PhJ = 37). Statistical significance was determined based on MDMR analysis with R package for a and e or based on one-way ANOVA test between different groups with GraphPad software for c and d. Data are displayed as mean ± s.e.m. in bar plots and dots represent individual mice. NS P > 0.05; *P < 0.05; **P < 0.01; ***P < 0.001; ****P < 0.0001. Source data
Fig. 3
Fig. 3. Genotype and environment drive immune variation in T and B cell responses.
a, Representative histogram from Blocks 1 and 2 showing concatenated files from T. muris-infected and rewilded mice of each mice strain. b, Bar plots depicting MFI of CD44 on MLN CD4+ T cells. ce, Representative histogram showing concatenated files from different groups of mice in Block 2 (c) with corresponding bar plots depicting proportion (d) and numbers (e) of B cells expressing CD44 on MLN cells. For b, d and e, n = 126; 129S1 Lab Uninfected = 8, 129S1 Lab T. muris = 9, 129S1 RW Uninfected = 8, 129S1 RW T. muris = 12, C57BL/6 Lab Uninfected = 8, C57BL/6 Lab T. muris = 11, C57BL/6 RW Uninfected = 18, C57BL/6 RW T. muris = 16, PWK/PhJ Lab Uninfected = 8, PWK/PhJ Lab T. muris = 6, PWK/PhJ RW Uninfected = 7, PWK/PhJ RW T. muris = 15 over two experimental blocks. For b, d and e one-way ANOVA test was used to test statistical significance between the different groups of interest. Data are displayed as mean ± s.e.m. and for b, d and e bar plots dots represent individual mice. NS P > 0.05; *P < 0.05; **P < 0.01; ***P < 0.001; ****P < 0.0001. Inf, infected; RW, rewilded; Uninf, uninfected. Source data
Fig. 4
Fig. 4. Genotype has a bigger effect on plasma cytokine responses.
a, Bar plots showing the pseudo R2 measure of effect size of predictor variables (left) and interactions (right) as calculated by MDMR from plasma cytokine data, n = 129; over two experimental blocks. b,c, PCA showing circulating plasma cytokine levels (b), raw data (Supplementary Data 6) and their loading factors (c). d, Heatmap depicting circulating plasma cytokine levels in n = 129; 48 129S1, 39 C57BL/6 and 42 PWK/PhJ mice over two experimental blocks, Block 1 and Block 2. Data were transformed to ensure normality before analysis. NS P > 0.05; *P < 0.05; **P < 0.01; ***P < 0.001; ****P < 0.0001. Source data
Fig. 5
Fig. 5. Gen × Env interaction has a bigger effect on supernatant cytokine responses.
a, Bar plots showing the pseudo R2 measure of effect size of predictor variables and interactions as calculated by MDMR from cytokine supernatant data of MLN cells stimulated with CD3/CD28 beads, lipopolysaccharide (LPS), C. albicans, Clostridium perfringes, B. vulgatus or T. muris antigens. b, Bar plots showing the pseudo R2 measure of effect size of predictor variables and interactions as calculated by MDMR from cytokine supernatant data of MLN cells stimulated with T. muris antigen. For a and b, n = 50; 16 129S1, 22 C57BL/6 and 15 PWK/PhJ mice in one experimental block, Block 2; raw data, Supplementary Data 8. c,d, Bar plots showing transformed IFNγ cytokine levels in the supernatant for controls (c) as well as following stimulation with T. muris antigen (d). For c and d, n = 50; 129S1 Lab Uninfected = 4, 129S1 Lab T. muris = 3, 129S1 RW Uninfected = 2, 129S1 RW T. muris = 7, C57BL/6 Lab Uninfected = 3, C57BL/6 Lab T. muris = 4, C57BL/6 RW Uninfected = 8, C57BL/6 RW T. muris = 7, PWK/PhJ Lab Uninfected = 1, PWK/PhJ Lab T. muris = 2, PWK/PhJ RW Uninfected = 2, PWK/PhJ RW T. muris = 7 over one experimental block, Block 2. Statistical significance was determined based on MDMR analysis with R package for a and b. Data included samples from Block 2 alone due to technical problems with stimulation assays from Block 1. Data below limit of detection were excluded. Data are displayed as mean ± s.e.m. and for c and d bar plots dots represent individual mice. Source data
Fig. 6
Fig. 6. Single-cell sequencing analysis for assessing immune variation in cellular composition.
a, UMAP visualization of scRNA-seq data identifying 23 major immune cell subsets, Block 1 and Block 2. b, Bar plots showing the pseudo R2 measure of effect size of predictor variables and interactions as calculated by MDMR analysis based on cellular composition of cells identified in a in each mouse (Supplementary Data 7) (Block 1, n = 51, 17 129S1, 21 C57BL/6, 13 PWK/PhJ; Block 2, n = 71, 19 129S1, 28 C57BL/6 and 24 PWK/PhJ mice). c, PCA of MLN cellular compositional data as determined by scRNA-seq analysis. d,e, Bar plots showing percentages of B follicular cells (d) and CD4 T cells (e) based on the scRNA-seq identified in a. For d and e, n = 122; 129S1 Lab Uninfected = 8, 129S1 Lab T. muris = 9, 129S1 RW Uninfected = 7, 129S1 RW T. muris = 12, C57BL/6 Lab Uninfected = 10, C57BL/6 Lab T. muris = 10, C57BL/6 RW Uninfected = 13, C57BL/6 RW T. muris = 16, PWK/PhJ Lab Uninfected = 8, PWK/PhJ Lab T. muris = 7, PWK/PhJ RW Uninfected = 10, PWK/PhJ RW T. muris = 10 over two experimental blocks. Statistical significance was determined based on MDMR analysis with R package for b; for d and e, one-way ANOVA test with comparison by Tukey’s multiple analysis was used to test statistical significance between the different groups of interest. Data are displayed as mean ± s.e.m. and for d and e bar plots dots represent individual mice. NS P > 0.05; *P < 0.05; **P < 0.01; ***P < 0.001; ****P < 0.0001. Source data
Fig. 7
Fig. 7. Single-cell sequencing analysis for assessing immune variation in cytokine profiles.
a, Cytokine-expressing cell clusters. b, Proportion of cells expressing cytokine-related genes of those identified in a. c, Bar plots showing the pseudo R2 measure of effect size of predictor variables and interactions as calculated by MDMR analysis based on data from proportion of cytokine-expressing cells identified in a. d,e, Bar plots showing proportion (d) and numbers (e) of cytokine-expressing cells identified in a, For c, d and e, n = 99; 129S1 Lab Uninfected = 5, 129S1 Lab T. muris = 5, 129S1 RW Uninfected = 7, 129S1 RW T. muris = 12, C57BL/6 Lab Uninfected = 6, C57BL/6 Lab T. muris = 7, C57BL/6 RW Uninfected = 13, C57BL/6 RW T. muris = 16, PWK/PhJ Lab Uninfected = 3, PWK/PhJ Lab T. muris = 3, PWK/PhJ RW Uninfected = 8, PWK/PhJ RW T. muris = 14 over two experimental blocks. Statistical significance was determined on MDMR analysis with R package for c. For d and e, one-way ANOVA test with comparison by Tukey’s multiple analysis was used to test statistical significance between the different groups of interest. Data are displayed as mean ± s.e.m. and for d and e bar plots dots represent individual mice. NS P > 0.05; *P < 0.05; **P < 0.01; ***P < 0.001; ****P < 0.0001. Source data
Fig. 8
Fig. 8. Genetics and environmental factors predict outcomes during exposure with T. muris parasite.
Significant variation in worm burden among exposed mice, 3 weeks after inoculation with 200 eggs of T. muris per host, Block 1 and Block 2, Supplementary Data 12. a, Worm burden (number of nematodes remaining in the cecum at that timepoint) followed a negative binomial distribution. b, Worm burden depicted as number of worms per mouse (left, n = 75, C57BL/6 Lab = 11, 129S1 Lab = 11, PWK/PhJ Lab = 9, C57BL/6 RW = 16, 129S1 RW = 14, PWK/PhJ RW = 14, dots represent individual mice) and percentage of mice (Prevalence) still infected by worms (right). Each was predicted by a combination of genetic and environmental effects, including Gen × Env for worm burden (see text). c, When we used PC2 from the scRNA-seq data (Fig. 3b) as an index of immune variation among individuals in our statistical models, we found that Gen × Env was no longer significant. Instead, the best model included main effects of host strain (C57BL/6 versus 129SL versus PWK/PhJ), environment (Lab versus RW) and PC2. The figure depicts 1,000 model-estimated values for the effect of each predictor on worm burden. The three different inbred strains of mice, 129S1, C57BL/6 and PWK/PhJ mice, were infected with T. muris under laboratory conditions, and at day 14 post infection, MLN cells were collected and stimulated with PMA/ION. d, The proportion and numbers of CD4+ T cells producing IFNγ, IL-13 and IL-4 at day 14 following infection with T. muris are calculated and displayed as mean ± s.e.m.; dots represent individual mice. NS P > 0.05; **P < 0.01; females (triangular dots), males (circle dots). For IFNγ, IL-13, n = 48; 129S1 Uninfected = 6, 129S1 T. muris = 14, C57BL/6 Uninfected = 6, C57BL/6 T. muris = 16, PWK/PhJ Uninfected = 5, PWK/PhJ T. muris = 11 over 5 experiments, For IL-4, n = 44; 129S1 Uninfected = 5, 129S1 T. muris = 10, C57BL/6 Uninfected = 5, C57BL/6 T. muris = 12, PWK/PhJ Uninfected = 4, PWK/PhJ T. muris = 8 over 4–5 experiments. PMA/ION, phorbol myristate acetate/ionomycin. Source data
Extended Data Fig. 1
Extended Data Fig. 1. Unsupervised Clustering of murine PBMC cells.
(A) PCA Plot showing clusters generated following unsupervised clustering of PBMCs cells (n = 64; 17 129S1, 29 C57BL/6 and 18 PWK/PhJ mice) (B) Bar plot showing cluster percentage in different groups on a per mice basis. (C) the loading factors of immune clusters for PCA plot of PBMC cells showing PC1 and PC2 axis (D) PCA showing PC1 and PC3 axis of immune cell clusters identified by unsupervised clustering in the PBMCs cells and (E) Box plot showing variance on PC3 axis of PCA plots in (D). The box plot center line represents median, the boundaries represent IQR with the whiskers representing the upper and lower quartiles ±1.5 Interquartile Range (IQR), all individual data points are shown (129S1 Uninf = 8, C57BL/6 = 14, PWK-PhJ Lab = 6, 129S1 RW = 9, C57BL/6 RW = 15, PWK RW = 12). Statistical significance in (E) was determined by one-way ANOVA test between different groups with Graph-Pad Software. ns p > 0.05. Source data
Extended Data Fig. 2
Extended Data Fig. 2. Gating strategy for identification of Tbet+ CD4+ T cells.
(A) Cells are pre-gated as singlets, Live+CD45+TCRb+CD4+ and representative contour lots showing percentage of Tbet+ CD4+ T cell of CD4+ cells in PBMCs are shown. Source data
Extended Data Fig. 3
Extended Data Fig. 3. Genotype, Environment and Infection interactions determine immune composition in murine MLNs.
(A) PCA of immune cell clusters identified by unsupervised clustering in the MLN with the myeloid panel. (n = 73; 21 129S1, 30 C57BL/6 and 22 PWK/PhJ mice) (B) PCA of immune cell clusters identified by unsupervised clustering in the MLN (n = 73; 21 129S1, 30 C57BL/6 and 22 PWK/PhJ mice) with the lymphoid panel reflecting PC1 and PC3 with (C) Box plot showing the variance on PC3 axis of PCA plots. The box plot center line represents median, the boundaries represent IQR with the whiskers representing the upper and lower quartiles ±1.5 Interquartile Range (IQR), all individual data points are shown (129S1 Uninfected = 9, C57BL/6 Uninfected= 16, PWK-PhJ Lab Uninfected = 7, 129S1 T. muris = 12, C57BL/6 T. muris = 15, PWK-PhJ T. muris = 15). Statistical significance was determined by one-way ANOVA one tailed test between different groups of interest with Graph-Pad Software (C). Source data
Extended Data Fig. 4
Extended Data Fig. 4. Genetics and Environmental effects on B cell and T cell phenotype.
Bar plots showing (A) frequencies and (B) numbers of B cells in the mesenteric lymph node, For (A) and (B) n = 126, 129S1 Lab Uninfected = 8, 129S1 Lab T. muris = 9, 129S1 RW Uninfected = 8, 129S1 RW T. muris = 12, C57BL/6 Lab Uninfected = 8, C57BL/6 Lab T. muris = 11, C57BL/6 RW Uninfected = 18, C57BL/6 RW T. muris = 16, PWK/PhJ Lab Uninfected = 8, PWK/PhJ Lab T. muris = 6, PWK/PhJ RW Uninfected = 7, PWK/PhJ RW T. muris = 15 over two experimental blocks; each dot represent individual mice. (C) Representative FACS plots showing percentage of CD44 high B cells in the mesenteric lymph node. (D) Bar plots depicting GMFI of PD1 on MLN CD4 + T cells,) n = 73, 129S1 Lab Uninfected = 5, 129S1 Lab T. muris = 5, 129S1 RW Uninfected = 4, 129S1 RW T. muris = 7, C57BL/6 Lab Uninfected = 4, C57BL/6 Lab T. muris = 6, C57BL/6 RW Uninfected = 11, C57BL/6 RW T. muris = 9, PWK/PhJ Lab Uninfected = 4, PWK/PhJ Lab T. muris = 5, PWK/PhJ RW Uninfected = 3, PWK/PhJ RW T. muris = 10 over one experimental block, Block = 2 (E) Representative Histogram showing concatenated files from rewilded uninfected mice of each mice strain. Statistical significance was determined by one-way ANOVA one tailed test between different groups of interest with Graph-Pad Software (A), (B) and (D). For (A) and (B) direct comparison was done within each genotype; for (D), comparison was done between genotypes in the same environment with one-way ANOVA one tailed test. Data are displayed as mean ± SEM. ns p > 0.05; * p < 0.05; ** p < 0.01; *** p < 0.001; **** p < 0.0001. RW, Rewilded. Source data
Extended Data Fig. 5
Extended Data Fig. 5. Genetics by Environment Interactions determine variation in T cell phenotype.
MLN cells from different strains of mice in the laboratory and rewilded conditions were harvested and the proportion of the Naïve and memory CD4 and CD8 T cell subset were determined by flow cytometric analysis. Representative flow cytometry plots and quantification of CD62LhiCD44lo, CD62LhiCD44hi, and CD62LloCD44hi CD4 T cells in CD4 T cells (A), (B) and the CD8 T cell (C) and (D) cellular population. For (B) and (D), n = 117; 129S1 Lab Uninfected = 8, 129S1 Lab T. muris = 9, 129S1 RW Uninfected = 8, 129S1 RW T. muris = 12, C57BL/6 Lab Uninfected = 6, C57BL/6 Lab T. muris = 9, C57BL/6 RW Uninfected = 17, C57BL/6 RW T. muris = 15, PWK/PhJ Lab Uninfected = 7, PWK/PhJ Lab T. muris = 5 PWK/PhJ RW Uninfected = 6, PWK/PhJ RW T. muris = 15 over two experimental blocks. Grubb’s outlier test was done to remove outliers. Bar plots showing the pseudo R2 measure of effect size of predictor variables and interactions as calculated by multivariate distance matrix regression analysis (MDMR) in based on (E) proportions and (F) cell numbers from the CD4 and CD8 T cell lymphoid cells CD4 T cell clusters harvested from the MLN. Raw data – Data File S6. Source data
Extended Data Fig. 6
Extended Data Fig. 6. Schematic diagram of MLN in-vitro restimulation assay and cytokine levels with Legend plex cytokine assay.
(A) MLN cells from lab and rewilded of the different strains of mice were ex-vivo cultured with LPS, C. albicans, C. perfringes, B. vulgatus, T. muris or CD3/CD28 beads for 48 hours and supernatant was assayed for 11 cytokines IFN-γ, IL-5, TNF-α, IL-2, IL-6, IL-4, IL-10, IL-9, IL-17a, IL-22, IL-13. Bar plot showing transformed IL-4 and IL-17A cytokine levels in the supernatant for controls(B, D) as well as following stimulation with T. muris antigen (C, D), For (B), (C), (D) and (E), n = 50; 129S1 Lab Uninfected = 4, 129S1 Lab T. muris = 3, 129S1 RW Uninfected = 2, 129S1 RW T. muris = 7, C57BL/6 Lab Uninfected = 3, C57BL/6 Lab T. muris = 4, C57BL/6 RW Uninfected = 8, C57BL/6 RW T. muris = 7, PWK/PhJ Lab Uninfected = 1, PWK/PhJ Lab T. muris = 2, PWK/PhJ RW Uninfected = 2, PWK/PhJ RW T. muris = 7 over one experimental block, Block 2. Data were transformed to ensure normality before analysis. (Data File S8). Source data
Extended Data Fig. 7
Extended Data Fig. 7. Single Cell Sequencing Analysis for assessing immune variation in cellular composition and cytokine profiles.
(A) Heat map depicting cluster defining genes used for cell type calling in Fig. 6a (B) Proportion of cell types identified in Fig. 3a on an individual mice basis (Block 1, n = 51, 17 129S1, 21 C57BL/6, 13 PWK/PhJ; Block 2, n = 71, 19 129S1, 28 C57BL/6 and 24 PWK/PhJ mice) (C) PCA of proportion of cytokine expressing cells as determined by scRNAseq analysis (Data File S9). (D) Bar plots showing the pseudo R2 measure of effect size of interactions as calculated by multivariate distance matrix regression analysis (MDMR) for number of cells with cytokine activity. Source data
Extended Data Fig. 8
Extended Data Fig. 8. Genotype influences expression of genes with cytokine activity.
(A) Feature plot showing scRNA-seq IFN-γ transcripts based on mice strain, environment, and infection. Feature plot showing scRNA-seq cytokine transcripts based on mice genotype in different cellular clusters (B) CD8 Effector cells (C) Dendritic cells (D) Monocytes/Macrophages. Source data
Extended Data Fig. 9
Extended Data Fig. 9. Genetics and Environmental factors predict outcomes during exposure with T. muris parasite.
(A) Loading Factors for PC2 of the scRNAseq dataset. (B) PAS/Alcian Blue-positive cells in the distal ileum were quantified from histological sections. n = 34, 129S1 Lab = 6, C57BL/6 = 4, PWK/PhJ = 4, 129S1 = 6, C57BL/6 = 8 and PWK/PhJ = 5. Data in (B) is mean ± SEM. Statistical significance was determined by one-way ANOVA one tailed test between different groups with Graph-Pad Software (C) Representative images from PAS/Alcian Blue staining of histological sections from the distal ileum (200X), Scale bar = 300μM. Source data
Extended Data Fig. 10
Extended Data Fig. 10. Gating Strategy for the different populations.
(A) Peripheral Blood Mononuclear cells (PBMCs), (B) Mesenteric Lymph node (MLN) and (C) MLN cells following PMA/ION stimulation. Source data

Update of

Similar articles

Cited by

References

    1. Aguirre-Gamboa R, et al. Differential effects of environmental and genetic factors on T and B cell immune traits. Cell Rep. 2016;17:2474–2487. - PMC - PubMed
    1. Ter Horst R, et al. Host and environmental factors influencing individual human cytokine responses. Cell. 2016;167:1111–1124.e1113. - PMC - PubMed
    1. Gause WC, Rothlin C, Loke PN. Heterogeneity in the initiation, development and function of type 2 immunity. Nat. Rev. Immunol. 2020;20:603–614. - PMC - PubMed
    1. Oyesola OO, Souza COS, Loke PN. The influence of genetic and environmental factors and their interactions on immune response to helminth infections. Front. Immunol. 2022;13:869163. - PMC - PubMed
    1. Poon MML, et al. Heterogeneity of human anti-viral immunity shaped by virus, tissue, age, and sex. Cell Rep. 2021;37:110071. - PMC - PubMed

LinkOut - more resources