. 2024 Jul;9(7):1752-1763.
doi: 10.1038/s41564-024-01731-9. Epub 2024 Jun 14.

GprC of the nematode-trapping fungus Arthrobotrys flagrans activates mitochondria and reprograms fungal cells for nematode hunting

Affiliations

GprC of the nematode-trapping fungus Arthrobotrys flagrans activates mitochondria and reprograms fungal cells for nematode hunting

Xiaodi Hu et al. Nat Microbiol. 2024 Jul.

Abstract

Initiation of development requires differential gene expression and metabolic adaptations. Here we show in the nematode-trapping fungus, Arthrobotrys flagrans, that both are achieved through a dual-function G-protein-coupled receptor (GPCR). A. flagrans develops adhesive traps and recognizes its prey, Caenorhabditis elegans, through nematode-specific pheromones (ascarosides). Gene-expression analyses revealed that ascarosides activate the fungal GPCR, GprC, at the plasma membrane and together with the G-protein alpha subunit GasA, reprograms the cell. However, GprC and GasA also reside in mitochondria and boost respiration. This dual localization of GprC in A. flagrans resembles the localization of the cannabinoid receptor CB1 in humans. The C. elegans ascaroside-sensing GPCR, SRBC66 and GPCRs of many fungi are also predicted for dual localization, suggesting broad evolutionary conservation. An SRBC64/66-GprC chimaeric protein was functional in A. flagrans, and C. elegans SRBC64/66 and DAF38 share ascaroside-binding sites with the fungal GprC receptor, suggesting 400-million-year convergent evolution.


Conflict of interest statement

The authors declare no competing interests.

Figures
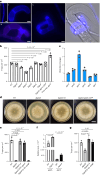
Fig. 1
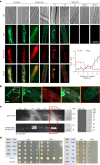
Fig. 1. Analysis of the role of GPCR receptors and G-proteins in the control of trap formation in A. flagrans.
a, Trap formation: (i) vegetative hypha, (ii and iii) different stages of trap formation, (iv and v) trap with immobilized C. elegans. The cell wall of the fungus was stained with calcofluor white. Scale bar, 5 µm. Microscopic images are representative of three independent repeats. b, Quantification of the number of traps in WT and six different GPCR receptor mutants, together with the recomplemented strain of the gprC mutant by C-terminally GFP-fused GprC under the native promoter and the gprC-overexpressing strain (mean ± s.d., n = 3 biological replicates; noted P values are from two-sided unpaired Student’s t-test compared to WT). c, Comparison of the expression of the six GPCR-encoding genes in control hyphae and hyphae induced with nematodes by RT–qPCR. The y axis shows the fold change of the expression of the gprA, gprB, gprC, gprD, gprE and gprF genes in the WT strain induced by nematodes for 6 h relative to 0 h. Each dot indicates one replicate. Bars and error bars indicate means ± s.d. of 3 biological replicates. The gamma actin orthologue DFL_002353 was used for normalization. d, Colonies of WT, the gasA-deletion strain and the gasA-deletion strain recomplemented with GasA (re) or GFP-GasA expressed from the native promoter. Scale bar, 1 cm. e,g, Quantification of trap formation of the indicated strains. 8’-Br-cAMP was used at a concentration of 5 mM. Data are expressed as mean ± s.d. (n = 3 biological replicates). P values were determined using a two-sided unpaired t-test compared to WT. f, Expression analysis of gasA and gprC in the indicated strains by RT–qPCR (mean ± s.d., n = 3 biological replicates; noted P values are from a two-sided unpaired Student’s t-test compared to WT). Source data
Fig. 2
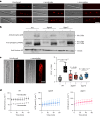
Fig. 2. GprC and GasA reside and interact in the cytoplasmic membrane and in mitochondria.
a, Left: localization of GprC after overexpression (Overexp.) or with native expression (Native exp.). Mitochondria were stained with mitotracker. Left pictures show hyphal tips (t) and right pictures areas away from the tip (b). Right: visualization of GprC–GasA interaction. gprC and gasA were expressed from their own promoters. The left pictures show a hyphal tip (t) and the hypha further back (b) after induction with nematodes (+N). The right pictures show uninduced hyphae (UI) or control hyphae with only one of the constructs expressed (Split 1 and Split 2). Scale bar, 5 µm. Bottom right: quantification of GprC-GFP in a hypha from tip to back (550 µm). The hypha was divided into 11 sections and fluorescence quantified at 3 to 7 places in each section. The mean of the values is displayed (mean ± s.d., n = 3–7 biological replicates). b, Localization of GprC-GFP in a trap. The yellow-boxed area shows mitochondrial and the red box cytoplasmic membrane localization. Scale bar, 5 µm. Microscopic images are representative of three independent repeats. c, Cell fractionation of WT, GprC-GFP- and CitA(N)-GFP-expressing strains. Crude extract (CE), supernatants (S1 and 2), pellets (P1, 2 and 3) and the digested pellet 1 by proteinase K (P1 + K) (red box) were analysed with an anti-GFP antibody. Crude extract of WT was used as negative control. Blots are representative of three independent repeats. d, Left: interaction of GprC or the tail of GprC (111 amino acids) with GasA confirmed with Y2H analysis. LW, SD medium without leucine and tryptophan; TDO, triple dropout medium (SD medium without leucine, tryptophan and histidine). Right: single gene controls . Source data
Fig. 3
Fig. 3. GprC and GasA-dependent signalling.
a, Expression of artA in a promoter–reporter assay. Microscopy of hyphae, uninduced or induced with nematodes or ascaroside #18, of WT and a ∆gasA and a ∆gprC mutant. Scale bar, 10 µm. Microscopic images are representative of three independent repeats. b, Phosphorylation analysis of HogA, MakA and MakB (molecular masses of 48.2, 47.6 and 40.7 kDa, respectively) and the histone H3 control (15 kDa) in control (−) and induced (+) mycelia. Conidia (106) were grown on cellophane on LNA plates for 5 days before 10,000 N2 nematodes were added for 3 h followed by fungal protein extraction. Protein (35 µg) were analysed using western blot. Blots are representative of three independent repeats. c, Visualization and quantification of the ROS signals in mitochondria of uninduced and nematodes-induced hyphae stained by CellROX orange. Scale bar, 3 µm. Five fluorescent signals were quantified with Fiji software in three hyphae (n = 15 from three biological replicates). Boxplots show median (centre line), 25th to 75th percentiles (box limits), the minimum and maximum values (whiskers) and individual values as points superimposed on the graph. For P values, a two-sided unpaired Student’s t-test was performed to compare uninduced and induced hyphae. d, Oxygen consumption rate of mycelia of indicated strains grown in liquid LN medium. Curves in light colours (grey, light blue and pink) indicate uninduced mycelia, while dark colours (black, dark blue and dark red) represent nematode-induced mycelia (mean ± s.d., n = 3 biological replicates). Source data
Fig. 4
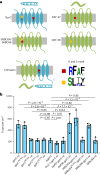
Fig. 4. Structural and functional comparison of A. flagrans and C. elegans ascaroside-sensing GPCRs.
a, Scheme of GprC, DAF37, DAF38, SRBC64/66 and a chimaeric protein. The conserved R and S motifs are indicated. b, Biological activity of A. flagransC. elegans chimaeric receptor proteins and of different gprC mutant alleles. The trap production of varied rescuing strains was compared to the gprC mutant strain. Strains are (from left to right): gprC recomplemented strain (1), recomplemented strains with mutated gprC genes (gprCN2.53A-re (2), gprCR6.45A-re (3), gprCS2.41A-re (4) and gprCN2.57A-re (5), the gprC mutant (6)), and the chimaeric protein recomplemented strains Octr-1-gprC-re (7), DAF37-gprC-re (8), DAF38-gprC-re (9) and SRBC64-gprC-re (10), mutated SRNC64N2.60A-gprC-re (11), SRBC66-gprC-re (12), and the strain SRBC66-re (13) including full length of nematode receptor SRBC66-encoding gene (mean ± s.d., n = 3 biological replicates; noted P values are from two-sided unpaired Student’s t-test compared to gprC mutant).
Fig. 5
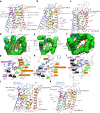
Fig. 5. Docking models for different ascarosides and different GPCRs.
ac, Twenty-five binding poses of ascarosides #1, #2, #3, #5 and #18 (yellow) docked into different receptor models. A highly conserved Asp residue in TM2 is shown in green. Extracellular side on top, intracellular side at the bottom. df, Binding pose of ascaroside #1 from extracellular view showing conical arrangement of the receptor. Extracellular loop 2 is shown in blue. gi, Binding pose of ascaroside #1 with all residues within 3.5 Å not considering glycine, proline or backbone atoms. j,k, Twenty-five binding poses of the five ascarosides (yellow) docked into chimaeric receptors.
Fig. 6
Fig. 6. Model of GprC and GasA functioning at the cytoplasmic membrane and in mitochondria.
GprC and GasA reside at the cytoplasmic membrane, interact with nematode-derived ascarosides and transmit the signal to the nucleus for gene regulation. In addition, both proteins localize at mitochondria for respiration control.
Extended Data Fig. 1
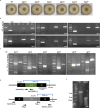
Extended Data Fig. 1. Deletion of six GPCR genes in A. flagrans.
(a) Colonies of WT and gprA-F-deletion strains. Scale bar, 1 cm. (b) Confirmation of mutants by PCR. ORF fragments were amplified with primers of gprX ORF_f and ORF_r (or ORFin_r), L (left flanking borders) with ko_up_for (or ex_for) and hyg_rev, and R (right flanking borders) with hyg_for and ko_down_rev (or ex_rev). PCR gel pictures are representative of three independent repeats. (c) Confirmation of mutants by PCR. Left lanes show bands from the WT strain and right ones from the corresponding mutants. Fragments of gprA were amplified with primers of gprA_ex_for and gprA_ex_rev, gprB with gprB_ex_for and gprB_orf_rev or hyg_rev, gprC with gprCORF_for, gprCORF_rev, hyg_for and hyg_rev, gprD with gprD_ex_for and gprD_orf_rev or hyg_rev, gprE with gprEORF_for, gprEORF_rev, hyg_for and hyg_rev, gprF with gprF_ex_for and gprF_ex_rev. PCR gel pictures are representative of three independent repeats. (d) Scheme of the deletion strategy of gprC. Arrows and the dark blue line indicate the used oligonucleotides for PCR and the probe for the Southern blot. (e) Southern blot analysis of WT and the ∆gprC mutant. Genomic DNA was digested with EcoRV and the blot hybridized with the probe indicated in (d). The blot is representative of three independent repeats.
Extended Data Fig. 2
Extended Data Fig. 2. Deletion of gasA and expression analysis.
(a) Scheme of the deletion strategy of gasA. (b) Confirmation of gasA deletion by PCR and Southern blot. The fragments after digestion of the genomic DNA with XbaI and the probe are indicated in (a). PCR gel picture and blot are representative of three independent repeats. (c) Scheme of the deletion strategy of gasB. (d) Confirmation of gasB deletion by PCR and Southern blot. The expected fragments and the probe are indicated in (c). PCR gel picture and blot are representative of three independent repeats. (e) The expression changes of the artA-gene cluster in nematode-induced hyphae of WT and the gasA-deletion strain compared with un−induced hyphae. RT–qPCR results are displayed as fold change. Bars and error bars indicate means ± s.d. of three biological replicates. The gamma actin orthologue DFL_002353 was used for normalization. (f) Confirmation of gprC re−complemented strains by RT–PCR and the amplified fragments of 374 bp showing the expression of various versions of mutated gprC genes. Strains are from left to right: (1) WT, (2) gprC mutant, (3) gprC re-complemented strain and the chimeric protein re-complemented strains (4) SRBC64-gprC-re, (5) SRBC64N2.60A-gprC-re, (6) full length SRBC66-re with an unspecific band, (7) SRBC66-gprC-re, (8) DAF37-gprC-re, (9) DAF38-gprC-re, (10) Octr-1-gprC-re, and (11) mutated gprCR6.45A-re, (12) gprCS2.41A-re, (13) gprCN2.57A-re and (14) gprCN2.53A-re. The PCR gel picture is representative of three independent repeats.
Extended Data Fig. 3
Extended Data Fig. 3. GprC resides in mitochondria and the cytoplasmic membrane.
The GprC-GFP and CitA(N)-GFP expressing strains were cultivated overnight in PDB medium and harvested for cellular fractionation. Crude extract (CE), supernatants (S1 & 2), pellets (P1, 2 & 3) and the proteinase K digested pellets (P1 + K, P2 + K and P3 + K) were analyzed in a Western blot using an anti-GFP antibody. GprC-GFP is about 90 kDa. CitA(N)-GFP appeared as cytoplasmic fusion protein (around 33.2 kDa) and a shorter imported version (around 30.2 kDa) in the mitochondria which remained after protease K digestion, plus a smaller degradation product. Both membranes were stained with Ponceau S (PS) before the Western blot. Blots are representative of three independent repeats.

Similar articles

Cited by

References

    1. Lefkowitz RJ. A brief history of G-protein coupled receptors (Nobel lecture) Angew. Chem. Int. Ed. Engl. 2013;52:6366–6378. doi: 10.1002/anie.201301924. - DOI - PubMed
    1. Yang D, et al. G protein-coupled receptors: structure- and function-based drug discovery. Signal Transduct. Target. Ther. 2021;6:7. doi: 10.1038/s41392-020-00435-w. - DOI - PMC - PubMed
    1. Weis WI, Kobilka BK. The molecular basis of G protein-coupled receptor activation. Annu. Rev. Biochem. 2018;87:897–919. doi: 10.1146/annurev-biochem-060614-033910. - DOI - PMC - PubMed
    1. Benard G, et al. Mitochondrial CB1 receptors regulate neuronal energy metabolism. Nat. Neurosci. 2012;15:558–564. doi: 10.1038/nn.3053. - DOI - PubMed
    1. Versele M, Lemaire K, Thevelein JM. Sex and sugar in yeast: two distinct GPCR systems. EMBO Rep. 2001;2:574–579. doi: 10.1093/embo-reports/kve132. - DOI - PMC - PubMed

MeSH terms