. 2024 Jun 14;7(1):728.
doi: 10.1038/s42003-024-06417-w.

An ultra-short-acting benzodiazepine in thalamic nucleus reuniens undermines fear extinction via intermediation of hippocamposeptal circuits

Affiliations

An ultra-short-acting benzodiazepine in thalamic nucleus reuniens undermines fear extinction via intermediation of hippocamposeptal circuits

Hoiyin Cheung et al. Commun Biol. .

Abstract

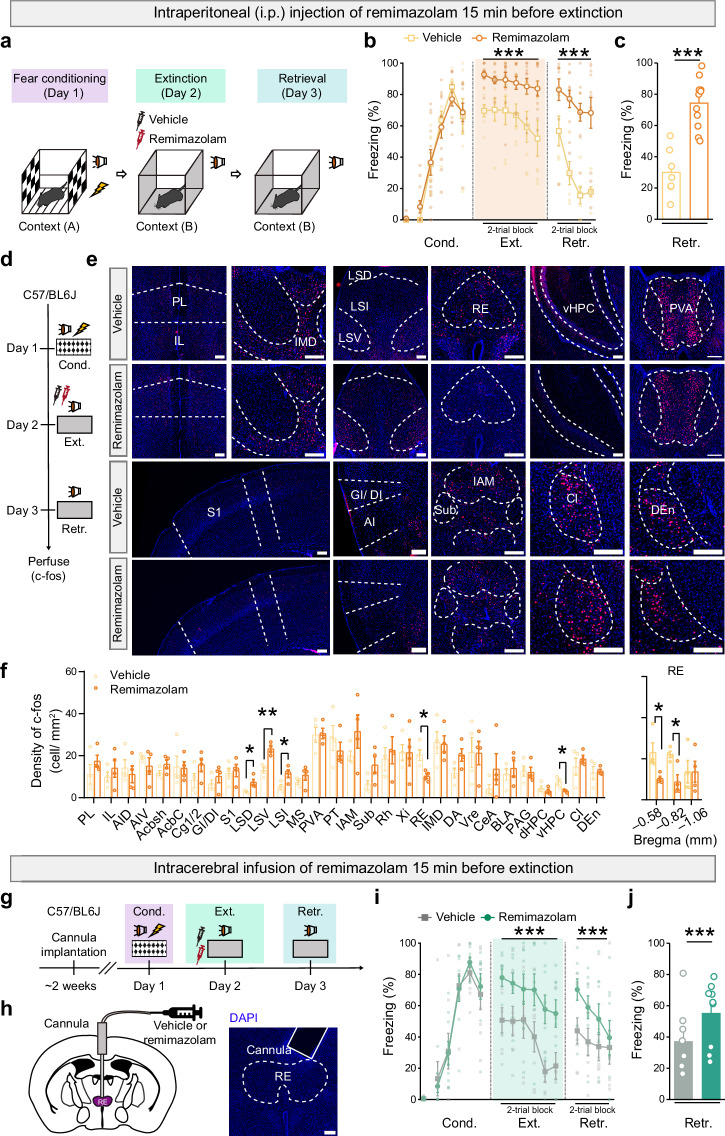
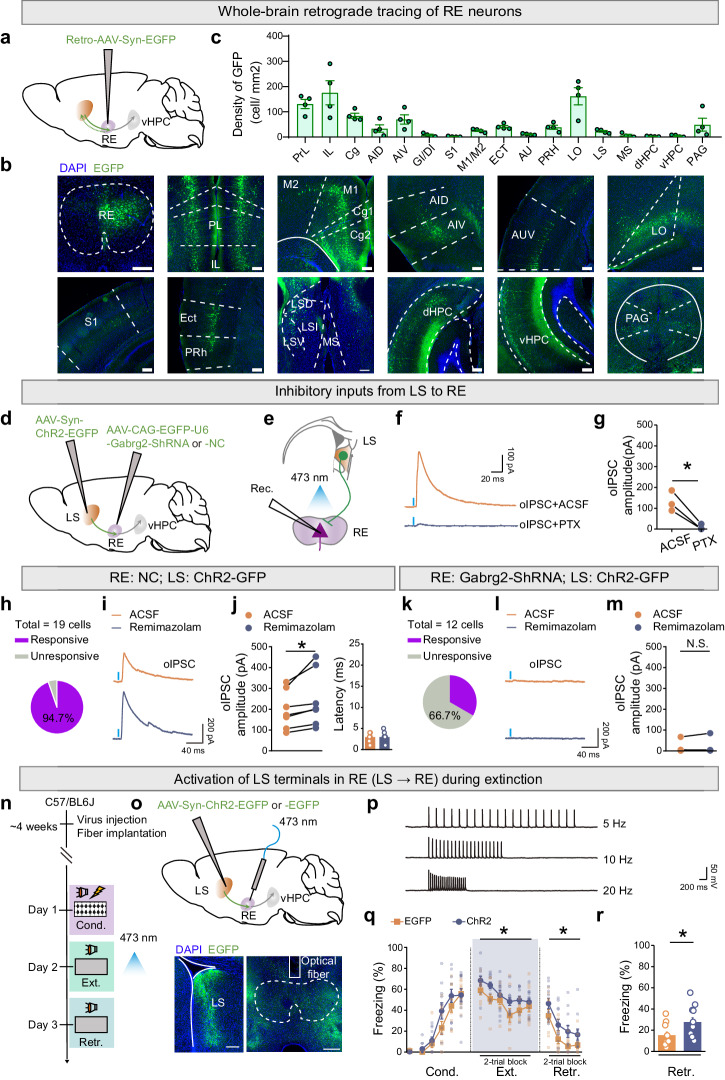
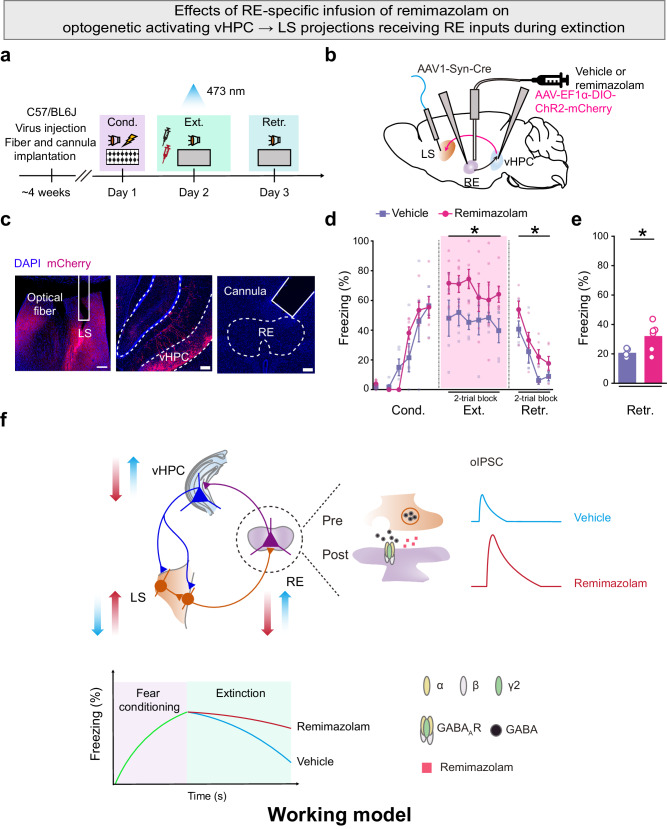
Benzodiazepines, commonly used for anxiolytics, hinder conditioned fear extinction, and the underlying circuit mechanisms are unclear. Utilizing remimazolam, an ultra-short-acting benzodiazepine, here we reveal its impact on the thalamic nucleus reuniens (RE) and interconnected hippocamposeptal circuits during fear extinction. Systemic or RE-specific administration of remimazolam impedes fear extinction by reducing RE activation through A type GABA receptors. Remimazolam enhances long-range GABAergic inhibition from lateral septum (LS) to RE, underlying the compromised fear extinction. RE projects to ventral hippocampus (vHPC), which in turn sends projections characterized by feed-forward inhibition to the GABAergic neurons of the LS. This is coupled with long-range GABAergic projections from the LS to RE, collectively constituting an overall positive feedback circuit construct that promotes fear extinction. RE-specific remimazolam negates the facilitation of fear extinction by disrupting this circuit. Thus, remimazolam in RE disrupts fear extinction caused by hippocamposeptal intermediation, offering mechanistic insights for the dilemma of combining anxiolytics with extinction-based exposure therapy.


Conflict of interest statement

The authors declare no competing interests.

Figures

Fig. 1
Fig. 1. Remimazolam inhibits fear extinction and alters the activity of associated brain areas.
a, d, g Experimental design. Either systemic or RE-specific remimazolam (4 mg in 5 ml saline per kg body weight of mice, i.p., a, d; 100 μM, 0.5 μl in ACSF, with a single central intracerebral injection allowing bilateral infusion, g) were given 15 min before fear extinction. h Left, Schematics of cannula implantation. Right, Representative image of implantation sites in RE. Scale bar, 200 μm. b, c, i, j Time course of freezing responses to the CS. c, j Freezing responses during extinction retrieval. b, c Vehicle group, n = 7 mice; Remimazolam group, n = 11 mice. b Statistics: two-way repeated measures ANOVA, Cond.: F(1, 16) = 0.0002063, P = 0.9887; Ext.: F(1, 16) = 27.64, ***P < 0.0001; Retr.: F(1, 16) = 34.91, ***P < 0.0001. c, Statistics: two-tailed unpaired Student’s t-test, t(16) = 5.909, ***P < 0.0001. i, j Vehicle group, n = 7 mice; Remimazolam group, n = 9 mice. i Statistics: two-way repeated measures ANOVA, Cond.: F(1, 14) = 0.01148, P = 0.9162; Ext.: F(1, 14) = 20.59, ***P = 0.0005; Retr.: F(1, 14) = 7.195, *P = 0.0179. j Statistics: two-tailed unpaired Student’s t test, t(14) = 2.682, *P = 0.0179. e Representative images of c-fos+ (red) cell immunofluorescence. Scale bar, 200 μm. f Quantification of c-fos positive neurons. Statistics: two-tailed unpaired Student’s t test, *P < 0.05, **P < 0.01, ***P < 0.001. n = 4 mice per group. PL prelimbic cortex; IL infralimbic cortex; Cg cingulate cortex; AID agranular insular cortex, dorsal part; AIV agranular insular cortex, ventral part; GI granular insular cortex; DI dysgranular insular cortex, S1 primary somatosensory cortex, Acbsh accumbens nucleus shell, Acbc accumbens nucleus, core, LSD lateral septal nucleus, dorsal part, LSV lateral septal nucleus, ventral part, LSI lateral septal nucleus, intermediate part, MS medial septal nucleus, PVA paraventricular thalamic nucleus, anterior part, PT paratenial thalamic nucleus, IAM interanteromedial thalamic nucleus, IMD intermediodorsal thalamic nucleus, RE reuniens thalamic nucleus, Vre ventral reuniens thalamic nucleus, Xi xiphoid thalamic nucleus, Rh rhomboid thalamic nucleus, Sub submedius thalamic nucleus, dHPC hippocampus, dorsal part, vHPC hippocampus, ventral part, CeA central amygdaloid nucleus, BLA basolateral amygdaloid nucleus, anterior part, PAG periaqueductal gray, DA dorsal hypothalamic area, Cl claustrum, DEn dorsal endopiriform nucleus. Data are presented as mean ± SEM.
Fig. 2
Fig. 2. Effects of remimazolam on synaptic transmission and excitability of RE neurons.
a, h Schematic diagram of whole-cell patch clamp recording. Example traces of eIPSCs (b, holding = 0 mV) and eEPSCs (e, holding = –70 mV). Statistical analysis of the amplitude (c, f) and decay time (d, g) of eIPSCs and eEPSCs. Statistics: two-tailed paired Student’s t test, (c) t(10) = 3.657, **P = 0.0044; (d) t(10) = 3.888, *P = 0.0179, n = 11 cells; (f) t(12) = 1.612, P = 0.1330; (g) t(12) = 0.6396, P = 0.5344. n = 13 cells. i Statistical analysis of the rheobase of ramping current injection-induced action potentials. Statistics: two-tailed paired Student’s t test, t(5) = 3.084, *P = 0.0273. n = 6 cells. j Example traces of stepping current injection induced action potentials treated before (Left) and after (Right) bath application of remimazolam (100 μM). k The frequency of action potential discharge as a function of step-current intensity (–25 to 250 pA, 500 ms). Statistics: two-way repeated measures ANOVA, F(1, 18) = 10.48, **P = 0.0046. n = 10 cells. Data are presented as mean ± SEM.
Fig. 3
Fig. 3. Effects of remimazolam on fear extinction in mice with RE-specific genetic knockdown of γ2-GABAAR (Gabrg2) subunit.
a Experimental design. b Left, Schematics of AAV injections. Right, Representative image of EGFP expression in RE. Scale bar, 200 μm. cg, hl Whole-cell patch clamp recordings. RE-NC group, n = 7 cells; RE-Gabrg2-ShRNA group, n = 8 cells. c, h Example traces of eIPSCs (holding = 0 mV). d, i Statistics: two-tailed paired Student’s t test, d t(6) = 5.364, **P = 0.0017; i t(7) = 0.05885, P = 0.9547. e, j Example traces of stepping current injection-induced action potentials before (Upper) and after (Lower) application of remimazolam (100 μM). f, k Statistical analysis of the rheobase of ramping current injection-induced action potentials. Statistics: two-tailed paired Student’s t test, f, t(6) = 3.177, *P = 0.0192; (k) t(7) = 1.790, P = 0.1166. The frequency of AP discharge as a function of step-current intensity (–25 to 250 pA, 500 ms). Statistics: two-way repeated measures ANOVA, g F(1, 12) = 5.263, *P = 0.0406; l F(1, 16) = 0.01144, P = 0.9162. mp Effects of remimazolam (4 mg in 5 ml saline per kg body weight of mice, i.p.) on fear extinction in mice with RE expressing NC (m, n, Vehicle group, n = 10 mice; remimazolam group, n = 9 mice) or Gabrg2-ShRNA (o and p, Vehicle group, n = 10 mice; remimazolam group, n = 9 mice). Time course of freezing responses to the CS. Statistics are as follows: two-way repeated measures ANOVA, m Cond.: F(1, 17) = 0.2737, P = 0.6076; Ext.: F(1, 17) = 8.478, **P = 0.0097; Retr.: F(1, 17) = 5.692, *P = 0.0289. o Cond.: F(1, 17) = 1.117, P = 0.3054; Ext.: F(1, 17) = 0.1975, P = 0.6624; Retr.: F(1, 17) = 0.1346, P = 0.7182. Freezing responses during extinction retrieval. Statistics are as follows: two-tailed unpaired Student’s t-test, n t(17) = 2.386, *P = 0.0289; p t(17) = 0.3669, P = 0.7182. Data are presented as mean ± SEM.
Fig. 4
Fig. 4. Reinstatement of Gabrg2 expression in RE-vHPC projectors restores remimazolam responsiveness in RE Gabrg2 knockdown mice.
a Experimental design. b Left, Schematics of AAV injections. Right, Representative images showing the expression of EGFP (green) and mCherry (red) in RE or vHPC. Scale bar, 200 μm. The inset shows local magnification of a cell in RE (scale bar, 5 μm). ch Whole-cell patch clamp recording of RE neurons. ce RE Gabrg2 knockdown group, n = 8 cells. fh RE Gabrg2 knockdown compensating RE-vHPC projectors with Gabrg2, n = 7 cells. c, f Example traces of stepping current injection induced action potentials before (Upper) and after (Lower) bath application of remimazolam (100 μM). d, g The frequency of AP discharge as a function of step-current intensity (–25 to 250 pA, 500 ms). Statistics are as follows: two-way repeated measures ANOVA and two-tailed unpaired Student’s t test, (d) F(1, 14) = 0.009198, P = 0.9250, (i) F(1, 12) = 1.867, P = 0.1968. e, h Statistical analysis of the rheobase of ramping current injection induced action potentials. Statistics: two-tailed paired Student’s t test, e t(7) = 1.440, P = 0.1931; h t(5) = 3.450, *P = 0.0182. il Effects of remimazolam (4 mg in 5 ml saline per kg body weight of mice, i.p.) on fear extinction in mice with RE Gabrg2 knockdown (i, j Vehicle group, n = 8 mice, remimazolam group, n = 7 mice) or those compensating RE-vHPC projectors with Gabrg2 mice (k, l Vehicle group, n = 8 mice, remimazolam group, n = 7 mice) on fear extinction. i, k Time course of freezing responses to the CS. Statistics are as follows: two-way repeated measures ANOVA, i Cond.: F(1, 13) = 0.3489, P = 0.5649; Ext.: F(1, 13) = 0.04041, P = 0.8438; Retr.: F(1, 13) = 0.2116, P = 0.6531. k Cond.: F(1, 13) = 1.176, P = 0.2978; Ext.: F(1, 13) = 10.48, **P = 0.0065; Retr.: F(1, 13) = 5.271, *P = 0.0390. j, l Freezing responses during extinction retrieval. Statistics are as follows: two-tailed unpaired Student’s t test, j t(13) = 0.4600, P = 0.6531; l t(13) = 2.296, *P = 0.0390. Data are presented as mean ± SEM.
Fig. 5
Fig. 5. Remimazolam enhances long-range GABAergic inhibition from LS to RE-vHPC projectors, impairing fear extinction.
a, d Schematic of AAV injections. b Representative images. Scale bar, 200 μm. c Quantification of EGFP+ neurons. n = 4 mice. PL prelimbic cortex; IL infralimbic cortex; Cg cingulate cortex; AID agranular insular cortex, dorsal part; AIV agranular insular cortex, ventral part; DI dysgranular insular cortex; GI granular insular cortex; S1 primary somatosensory cortex; M1 primary motor cortex; M2 secondary motor cortex; ECT ectorhinal cortex; AU auditory cortex; PRH perirhinal cortex; LO lateral orbital cortex; LSD lateral septal nucleus, dorsal part; LSI lateral septal nucleus, intermediate part; LSV lateral septal nucleus, ventral part; PAG periaqueductal gray. e Schematic of whole-cell patch clamp recording. f Example traces of oIPSC at LS → RE projections before (Upper) and after (Lower) bath application of picrotoxin (PTX, 100 μM). g Statistical analysis. Statistics are as follows: two-tailed paired Student’s t test, t(2) = 5.742, *P = 0.0290, n = 3 cells. hm Example traces of oIPSC at LS → RE projections (i, l) and statistical analysis of the percentage of cells with oIPSC (h, k) and the amplitude of oIPSC (j, m) before and after bath application of remimazolam (100 μM). Statistics are as follows: two-tailed paired Student’s t test, j, Left, t(6) = 2.806, *P = 0.0309; Right, t(6) = 0.000, *P > 0.9999, n = 7 cells; m t(6) = 0.9343, P = 0.3862, n = 7 cells. n Experimental design. o Schematics of AAV injections (Upper) and representative images (Lower) of EGFP expression (green) and fiber implantations in LS and RE, respectively. Scale bar, 200 μm. p Example traces of action potentials of RE neurons evoked by 473 nm blue light at a frequency of 5 Hz, 10 Hz, and 20 Hz. q, r Effects of activation of LS terminals in RE on fear extinction. EGFP group, n = 7 mice; ChR2 group, n = 8 mice. q Time course of freezing responses to the CS. Statistics are as follows: two-way repeated measures ANOVA, Cond.: F(1, 13) = 2.930, P = 0.1107; Ext.: F(1, 13) = 0.7261, P = 0.4096; Retr.: F(1, 13) = 6.239, *P = 0.0267. r Freezing responses during extinction retrieval. Statistics are as follows: two-tailed unpaired Student’s t-test, t(13) = 2.498, *P = 0.0267. Data are presented as mean ± SEM.
Fig. 6
Fig. 6. Activation of the RE → vHPC → LS pathway facilitates fear extinction, reversed by inhibiting RE-vHPC projectors.
a Schematics of AAV injections (Upper) and whole-cell patch clamp recording (Lower). Example traces of oIPSC (b) and oEPSC (d) from LS-RE projectors receiving vHPC inputs innervated by RE before and after bath application of CNQX (20 μM) and APV (50 μM). Statistics are as follows: two-tailed paired Student’s t-test, c t(3) = 4.617, *P = 0.0191; e t(3) = 4.078, *P = 0.0266, n = 4 cells. f Schematic of the closed-loop model for fear extinction. g, l Experimental design. h, m Schematics of AAV injections. i Representative images of mCherry expression (red) in vHPC and optical fiber implantation in LS. n Representative images of mCherry expression (red) in RE. Scale bar, 200 μm. o, Example traces of stepping current injection induced action potentials treated before (Upper) and after (Lower) bath application of CNO (10 μM). j, p, Time course of freezing responses. k, q Freezing responses during extinction retrieval. j, k Effects of activating vHPC → LS projections receiving RE inputs on fear extinction. mCherry group, n = 6 mice; ChR2 mice, n = 7 mice. Statistics are as follows: j, two-way repeated measures ANOVA, Cond.: F(1, 11) = 2.168, P = 0.1690; Ext.: F(1, 11) = 11.35, **P = 0.0063; Retr.: F(1, 11) = 5.370, *P = 0.0408. k two-tailed unpaired Student’s t-test, t(11) = 2.317, *P = 0.0408. p, q Effects of chemogenetic inactivating RE-vHPC projectors on optogenetic activating vHPC-LS projections receiving RE inputs on fear extinction. Vehicle group, n = 5 mice; CNO group, n = 5 mice. Statistics are as follows: p two-way repeated measures ANOVA, Cond.: F(1, 8) = 1.472, P = 0.2597; Ext.: F(1, 8) = 52.29, ***P < 0.0001; Retr.: F(1, 8) = 3.900, P = 0.0837. q two-tailed unpaired Student’s t test, t(8) = 1.975, P = 0.0837. Data are presented as mean ± SEM.
Fig. 7
Fig. 7. RE-specific remimazolam nullifies the effects of activating RE → vHPC → LS pathway on fear extinction.
a Experimental design. b Schematics of AAV injections. c Representative images of embedding sites for cannula and optical fiber in LS (Left) and RE (Right) respectively, as well as mCherry expression (red) in vHPC (Middle). Scale bar, 200 μm. d, e Effects of delivering remimazolam in RE with activation of vHPC → LS projections receiving RE inputs on fear extinction. Vehicle group, n = 5 mice; Remimazolam group, n = 6 mice. d Time course of freezing responses to the CS. Statistics are as follows: two-way repeated measures ANOVA, Cond.: F(1, 9) = 0.09548, P = 0.7644; Ext.: F(1, 9) = 6.373, *P = 0.0325; Retr.: F(1, 9) = 6.373, *P = 0.0325. e Freezing responses during extinction retrieval. Statistics are as follows: two-tailed unpaired Student’s t-test, t(9) = 2.550, *P = 0.0312. f Schematic of the working model of remimazolam in RE that undermines fear extinction through the modulation of hippocamposeptal circuits. RE-specific remimazolam disrupts the overall positive feedback circuit construct of the RE → vHPC → LS pathway for fear extinction. RE-specific remimazolam decreases the excitability of the RE by potentiating the GABAAR function on the postsynaptic membrane of RE neurons. This, in turn, reduces the excitatory inputs from the RE to the vHPC, which further reduces the feed-forward inhibitory inputs from the vHPC to the LS, which increases the inhibitory inputs from LS to the RE. Data are presented as mean ± SEM.

Similar articles

Cited by

References

    1. Dunsmoor JE, Niv Y, Daw N, Phelps EA. Rethinking extinction. Neuron. 2015;88:47–63. doi: 10.1016/j.neuron.2015.09.028. - DOI - PMC - PubMed
    1. Bouton ME, Maren S, McNally GP. Behavioral and neurobiological mechanisms of pavlovian and instrumental extinction learning. Physiol. Rev. 2021;101:611–681. doi: 10.1152/physrev.00016.2020. - DOI - PMC - PubMed
    1. Liu, Y., Ye, S., Li, X.-N. & Li, W.-G. Memory trace for fear extinction: fragile yet reinforceable. Neurosci Bull10.1007/s12264-023-01129-3 (2023). - PMC - PubMed
    1. Lebois LAM, Seligowski AV, Wolff JD, Hill SB, Ressler KJ. Augmentation of extinction and inhibitory learning in anxiety and trauma-related disorders. Annu. Rev. Clin. Psychol. 2019;15:257–284. doi: 10.1146/annurev-clinpsy-050718-095634. - DOI - PMC - PubMed
    1. Ressler KJ, et al. Post-traumatic stress disorder: clinical and translational neuroscience from cells to circuits. Nat. Rev. Neurol. 2022;18:273–288. doi: 10.1038/s41582-022-00635-8. - DOI - PMC - PubMed

Publication types