. 2024 Jul;16(7):1630-1656.
doi: 10.1038/s44321-024-00085-3. Epub 2024 Jun 14.

Disrupting TSLP-TSLP receptor interactions via putative small molecule inhibitors yields a novel and efficient treatment option for atopic diseases

Affiliations

Disrupting TSLP-TSLP receptor interactions via putative small molecule inhibitors yields a novel and efficient treatment option for atopic diseases

Partho Protim Adhikary et al. EMBO Mol Med. 2024 Jul.

Erratum in

Abstract

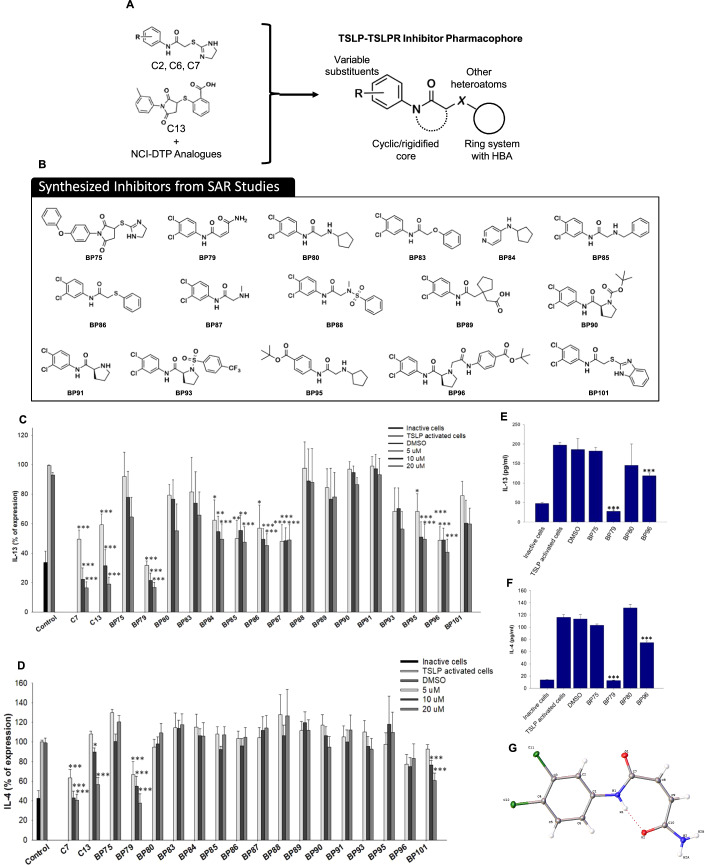
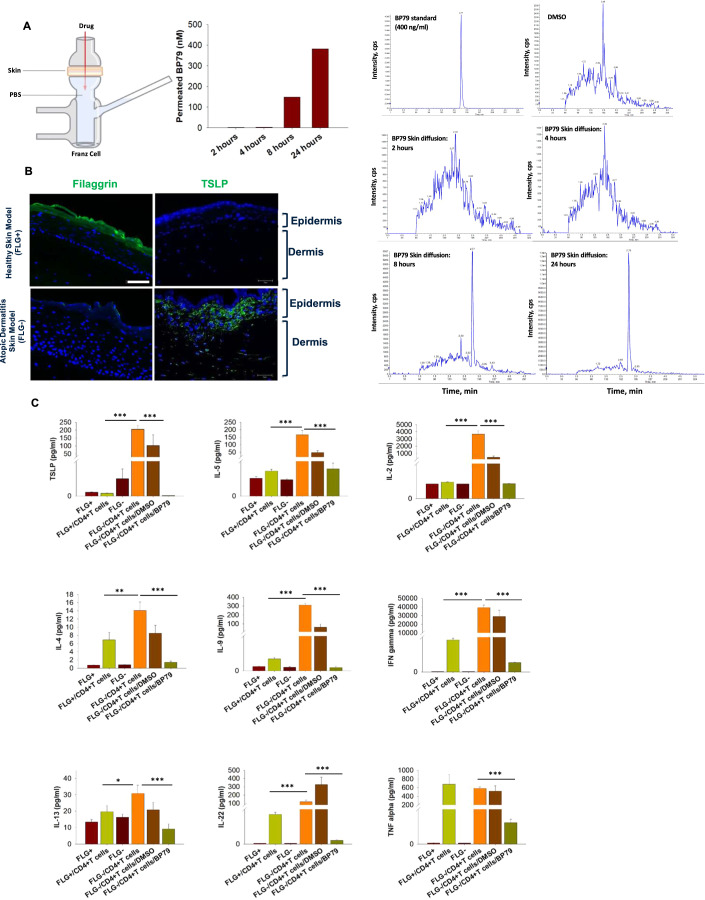
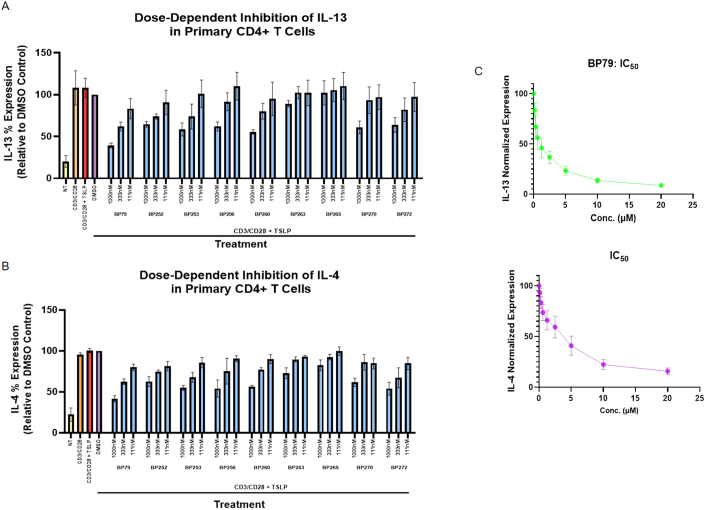
Thymic stromal lymphopoietin (TSLP) is a key player in atopic diseases, which has sparked great interest in therapeutically targeting TSLP. Yet, no small-molecule TSLP inhibitors exist due to the challenges of disrupting the protein-protein interaction between TSLP and its receptor. Here, we report the development of small-molecule TSLP receptor inhibitors using virtual screening and docking of >1,000,000 compounds followed by iterative chemical synthesis. BP79 emerged as our lead compound that effectively abrogates TSLP-triggered cytokines at low micromolar concentrations. For in-depth analysis, we developed a human atopic disease drug discovery platform using multi-organ chips. Here, topical application of BP79 onto atopic skin models that were co-cultivated with lung models and Th2 cells effectively suppressed immune cell infiltration and IL-13, IL-4, TSLP, and periostin secretion, while upregulating skin barrier proteins. RNA-Seq analysis corroborate these findings and indicate protective downstream effects on the lungs. To the best of our knowledge, this represents the first report of a potent putative small molecule TSLPR inhibitor which has the potential to expand the therapeutic and preventive options in atopic diseases.

Keywords: Atopic Dermatitis; Atopic Diseases; Organ-on-chip; Small Molecule Inhibitor; TSLP.


Conflict of interest statement

The authors declare no competing interests. A patent application has been filed for the discovery of BP79. No further competing interests are being declared.

Figures

Figure 1
Figure 1. In silico screening approach.
(A) Schematic representation of TSLP, TSLPR and IL-7Rα forming a ternary complex; binding interfaces are indicated  as site I, II, and III. (B) Overview of the virtual screening of potential small-molecule TSLP inhibitors and compound selection. A library of compounds from Specs and VitasM was screened using 3D pharmacophore models. (C, D) In vitro screening of twelve potential hit compounds in TSLP-activated HuT78 cells. Cells were treated with different concentrations of putative TSLP/TSLP receptor inhibitors for 36 h. IL-4 and IL-13 expression were detected with ELISA (n = 3). (E, F) Inhibition of Th2 cytokine secretion from human primary CD4 + T cells. TSLP-activated human primary CD4 + T cells from three donors were treated with different concentrations of compound 7, 13, and 14 for 36 h followed by quantification of IL-13 and IL-4 secretion via ELISA (n = 3). IC50 values [μM] and slope were determined using GraphPad Prism software. Data information: All data are presented as mean ± SEM. n represents the number of biological replicates. Statistical analysis was performed using Student’s t test, *P  ≤  0.05, **P  ≤  0.01, ***P  ≤  0.001. Source data are available online for this figure.
Figure 2
Figure 2. Biocompatibility and proposed binding modes.
(AC) Cell viability: Primary human keratinocytes, dermal fibroblasts, and HuT78 cells were treated with different concentrations of compound C7, C13, and C14. After 24 h, cell viability was determined by MTT assay (n = 3). (D) Proposed binding modes: The proposed binding mode of TSLPR-targeting C7 resembles the part of TSLP in site I. The nitrogen atoms present in in the imidazole ring mimic the interaction formed by Arg153 of TSLP with Val193 of TSLPR thus anchoring the molecule in the interdomain elbow region of TSLPR. Additionally, the dichlorophenyl moiety forms hydrophobic interactions with Leu39, Tyr143, Tyr194, and Val114 in our docking experiments, thus, suggesting further stabilization of the surmised binding conformation. The proposed binding mode of TSLP-targeting C13 is characterized by charge interactions and a hydrogen bonding network of the carboxylate moiety with Arg150 and Arg153 of TSLP, while the methylphenyl ring is interacting with Val67 and Leu147. In addition, there is a pi-cation interaction with Arg153. Data information: All data are presented as mean ± SEM. n represents the number of biological replicates. Statistical analysis was performed using Student’s t test, *P  ≤  0.05, **P  ≤  0.01, ***P  ≤  0.001. Source data are available online for this figure.
Figure 3
Figure 3. Design of new TSLP inhibitors.
(A) incorporating features of potent compounds from the initial screening campaign and hits from the NCI-DTP library. (B) Compounds were synthesized to optimize TSLPR inhibitory activity. (C, D) Inhibition of IL-13 and IL-4 secretion from Hut78 cells determined by ELISA. TSLP-activated HuT78 cells were treated with different concentrations of 16 newly synthesized TSLP inhibitors for 36 h (n = 4). (E, F) TSLP-activated human primary CD4 + T cells were treated with 20 µM of four promising compounds for 36 h. Secretion of IL-4 and IL-13 were determined using ELISA (n = 3). (G) Crystal structure of lead compound BP79, confirming the alkene substituents are in the cis-orientation and an intramolecular hydrogen bond between the aniline nitrogen atom and distal carbonyl oxygen confers rigidity to the overall structure. Data information: All data are presented as mean ± SEM. n represents the number of biological replicates. Statistical analysis was performed using Student’s t test, *P  ≤  0.05, **P  ≤  0.01, ***P  ≤  0.001. Source data are available online for this figure.
Figure 4
Figure 4. Functional validation of BP79.
(A, B) TSLP-activated primary CD4 + T cells were treated with different concentrations of the TSLP inhibitors BP75 and BP79 for 36 h, respectively. IL-13 and IL-4 secretion was quantified by ELISA (n = 6), mean ± SEM. IC50 values [μM] and slope were determined using GraphPad Prism software. (CE) Cytotoxicity of BP79 in primary human keratinocytes (n = 4), fibroblasts (n = 5), and CD4 + T cells (n = 5) was determined by MTT assay. (F) Inhibition of TSLP-mediated T-cell hyperproliferation. Primary CD4 + T cells were treated with TSLP inhibitors (or DMSO) and stimulated with TSLP for 1, 2 and 5 days. Cell proliferation was determined using a cell counter; n = 3. (G) Primary human CD4 + T cells and (H) keratinocytes were treated with BP79 and stimulated with TSLP. BP79 inhibited STAT6 and STAT3 activation in primary CD4 + T cells and primary keratinocytes, respectively (n = 3). The band intensities were quantified using ImageJ (n = 3). Phospho-Stat6 and Phospho-Stat3 expressions were normalized to Stat6 and Stat3 expressions, respectively. (I) Primary human myeloid dendritic cells were treated with BP79 and stimulated with TSLP for 24 h. OX-40L expression was detected using flow cytometry. (J) Primary human myeloid dendritic cells from three donors were treated with BP79 and stimulated with TSLP for 24 h. CCL17 expression was detected using ELISA (n = 3). (K) Inhibition of dendritic cell-mediated Th2 cell differentiation. IL-13 secretion was determined using ELISA (n = 3). Data information: All data are presented as mean ± SEM. n represents the number of biological replicates. Statistical analysis was performed using Student’s t test, *P  ≤  0.05, **P  ≤  0.01, ***P  ≤  0.001. Source data are available online for this figure.
Figure 5
Figure 5. Target engagement and specificity of BP79.
(A) Proximity ligation assay (PLA): TSLP binds to TSLPR and forms a ternary complex with IL-7Rα at the cell surface initiating intracellular signaling. PLA was performed to verify the inhibition of TSLP-mediated ternary complex formation via BP79. Primary keratinocyte cells were treated with the TSLP inhibitors and stimulated with TSLP. Cells were fixed and the interaction between TSLPR and IL-7Rα was observed with PLA assay. BP79 inhibited the TSLP:TSLPR:IL-7Rα ternary complex formation. Images were counted using ImageJ (n = 20). Scale bar = 50 μm. (B) In vitro thermal shift assay. BP79 thermally stabilized TSLPR up to 45 °C. (C) To determine if BP79 decreases the cytokine expression through direct binding of upstream kinases such as JAK1/2 or other kinase targets, BP79 was screened against 97 kinase targets using the KINOMEscan™ platform (radioligand displacement assay performed by Eurofins Discovery Services). Data information: All data are presented as mean ± SEM. n represents the number of biological replicates. Statistical analysis was performed using Student’s t test, *P  ≤  0.05, **P  ≤  0.01, ***P  ≤  0.001. Source data are available online for this figure.
Figure 6
Figure 6. Efficacy of BP79 in human skin and 3D tissue model.
(A) Skin permeation of BP79 was determined using a Franz cell setup followed by MS analysis showing BP79 permeation after 8 and 24 h, respectively. (B) Expression of filaggrin and TSLP in normal (FLG + ) and atopic-like (FLG-) skin models as determined by immunofluorescence staining. Scale bar = 25 μm. (C) Efficacy testing of BP79 in normal (FLG + ) and atopic-like (FLG−) skin models in the presence or absence of activated CD4+ cells emulating atopic-like disease conditions in a human-based setup. BP79 or the DMSO vehicle control were topically applied over three consecutive days. Cytokine expression was then quantified using MSD U-PLEX Cytokine Array Assay kit (n = 3). Data information: All data are presented as mean ± SEM. n represents the number of biological replicates. Statistical analysis was performed using Student’s t test, *P  ≤  0.05, **P  ≤  0.01, ***P  ≤  0.001. Source data are available online for this figure.
Figure 7
Figure 7. Development & utilization of an atopic diseases-organ chip for preclinical BP79 testing.
(A, B) Experimental setup of the co-cultivation of normal or atopic-like skin models with 3D normal bronchial epithelial models in a microfluidic two-organ chip. BP79 and tacrolimus were topically applied onto the skin (disease) model. (C) H&E staining of co-cultivated skin (normal and diseased) and lung tissue models w/ or w/o topical application of BP79 or tacrolimus. (D) Topical application of BP79 significantly reduced IL-13, IL-4, TSLP and periostin expression as detected via ELISA. Scale bar = 50 μm. (E) Relative mRNA expression of TSLP, filaggrin, keratin 5, keratin 14, and keratin 10 in atopic-like skin and bronchial lung tissue models following topical treatment with BP79 and tacrolimus determined via quantitative RT-PCR (n = 3). GAPDH served as a housekeeping gene.
Figure 8
Figure 8. BP79 effects on atopic-like skin and lung models in an atopic diseases-organ chip.
(A) Filaggrin expression in untreated (control), BP79-treated, and tacrolimus-treated atopic-like skin disease models. Scale bar = 50 μm. (B) TSLP expression and CD4 + T-cell infiltration in healthy, untreated and BP79 & tacrolimus-treated atopic-like skin disease models. BP79 treatment significantly reduced TSLP expression and CD4 + T-cell migration compared to untreated disease models. Scale bar = 50 μm. (C) Number of migrated CD4 + T cells were counted using ImageJ (n = 5). Data information: All data are presented as mean ± SEM. n represents the number of biological replicates. Statistical analysis was performed using Student’s t test, *P  ≤  0.05, **P  ≤  0.01, ***P  ≤  0.001. (D) Volcano plot showing the differential expression between treated and untreated diseased skin. Top 20 gene names are indicated on the plot. Genes significant at FDR < 0.01 with at least twofold difference between conditions are indicated by color. (E) Selected results of gene set enrichments in the contrast treated vs untreated diseased skin, co-cultured with lung tissue. Gene set enrichment evidence plots showing the gene set enrichment Receiving-Operator Characteristic (ROC) curve. Horizontal axis, genes ordered by P value (genes in the gene set are highlighted). Vertical axis, fraction of the gene set covered. Statistical significance was obtained using the CERNO gene set enrichment test implemented in the R package tmod. aminoacyl tRNA synthesis (KEGG pathways gene set, IDhsa00970); sodium proton exchangers (REACTOME pathways gene set, ID R-HSA-425986). All gene set enrichments are significant at FDR < 0.001.
Figure EV1
Figure EV1. Biological screen of twenty-eight BP79 analogs.
(A) Chemical structures of BP79 analogs produced. (B) IL-13 expression in HuT78 cells after treatment with 1μm of inhibitor for 36 h (n = 2). (C) IL-4 expression in HuT78 cells after treatment with 1 μm of inhibitor for 36 h. Bars represent mean percentage cytokine expression relative to the DMSO control (n = 2). Non-treated (NT), PMA-ionomycin stimulated (PI), PMA-ionomycin and TSLP-stimulated (PI + TSLP), and a PMA-ionomycin + TSLP-stimulated 0.4% DMSO vehicle control (DMSO) were included. Data information: All data are presented as mean ± SEM. n represents the number of biological replicates. Statistical analysis was performed using Student’s t test, *P  ≤  0.05, **P  ≤  0.01, ***P  ≤  0.001.
Figure EV2
Figure EV2. Dose-dependent screen of BP79 analogs in CD4 + T cells.
(A) IL-13 expression in primary CD4 + T cells after treatment with 111 nM, 333 nM, and 1000 nM of inhibitor for 36 h. (B) IL-4 expression primary CD4 + T cells after treatment with 111 nM, 333 nM, and 1000 nM of inhibitor for 36 h. Bars represent mean percent cytokine expression relative to the DMSO control, n = 3. Non-treated (NT), CD3/CD28 stimulated (CD3/CD28), CD3/CD28 and TSLP-stimulated (CD3/CD28 + TSLP), and vehicle (CD3/CD28 + TSLP + DMSO) controls were included. (C) Dose–response curves of BP79, which were used to calculate the IC50 value and HillSlope (n = 3). Data information: All data are presented as mean ± SEM. n represents the number of biological replicates. Statistical analysis was performed using Student’s t test, *P  ≤  0.05, **P  ≤  0.01, ***P  ≤  0.001.
Figure EV3
Figure EV3. Full panel images of proximity ligation assay (PLA).
PLA was performed to check the inhibition of TSLP-mediated ternary complex formation with BP79. Primary keratinocyte cells were treated with the TSLP inhibitors and stimulated with TSLP. Cells were fixed and the interaction between TSLPR and IL-7Rα was observed with PLA assay. C7 and BP79 inhibited the TSLP:TSLPR:IL-7Rα ternary complex formation. Scale bar = 50 μm.

References

    1. Adhikary PP, Tan Z, Page BDG, Hedtrich S (2021) TSLP as druggable target—a silver-lining for atopic diseases? Pharm Ther 217:107648 - PubMed
    1. Arima K, Watanabe N, Hanabuchi S, Chang M, Sun SC, Liu YJ (2010) “Distinct signal codes generate dendritic cell functional plasticity. Sci Signal 3(105):ra4 - PMC - PubMed
    1. Benjamini Y, Hochberg Y (1995) Controlling the false discovery rate: a practical and powerful approach to multiple testing. J R Stat Soc Ser B (Methodol) 57(1):289–300
    1. Berman HM, Westbrook J, Feng Z, Gilliland G, Bhat TN, Weissig H, Shindyalov IN, Bourne PE (2000) The Protein Data Bank. Nucleic Acids Res 28(1):235–242 - PMC - PubMed
    1. Berthold MR, Cebron N, Dill F, Gabriel TR, Kötter T, Meinl T, Ohl P, Thiel K, Wiswedel B (2009) KNIME—the Konstanz information miner: version 2.0 and beyond. SIGKDD Explor Newsl 11(1):26–31

MeSH terms

LinkOut - more resources