

Glycan clock of ageing-analytical precision and time-dependent inter- and i-individual variability
- PMID: 38877341
- PMCID: PMC11494675
- DOI: 10.1007/s11357-024-01239-4
Glycan clock of ageing-analytical precision and time-dependent inter- and i-individual variability
Abstract
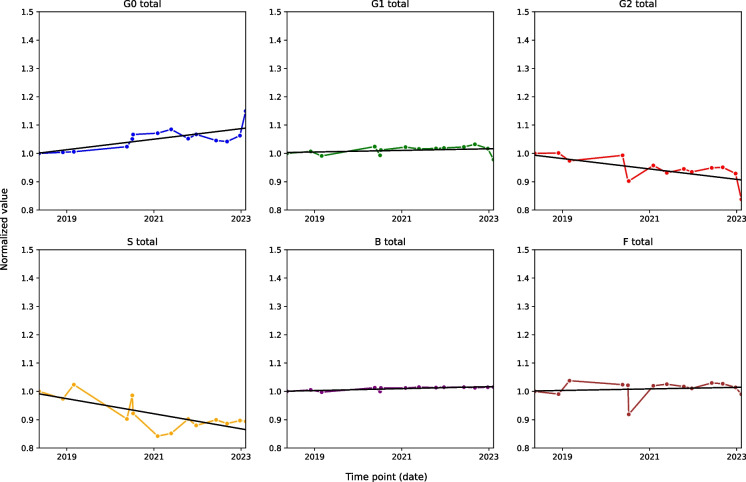
Ageing is a complex biological process with variations among individuals, leading to the development of ageing clocks to estimate biological age. Glycans, particularly in immunoglobulin G (IgG), have emerged as potential biomarkers of ageing, with changes in glycosylation patterns correlating with chronological age.For precision analysis, three different plasma pools were analysed over 26 days in tetraplicates, 312 samples in total. In short-term variability analysis, two cohorts were analysed: AstraZeneca MFO cohort of 26 healthy individuals (median age 20) and a cohort of 70 premenopausal Chinese women (median age 22.5) cohort monitored over 3 months. Long-term variability analysis involved two adult men aged 47 and 57, monitored for 5 and 10 years, respectively. Samples were collected every 3 months and 3 weeks, respectively. IgG N-glycan analysis followed a standardized approach by isolating IgG, its subsequent denaturation and deglycosylation followed by glycan cleanup and labelling. Capillary gel electrophoresis with laser-induced fluorescence (CGE-LIF) and ultra-performance liquid chromatography analyses were employed for glycan profiling. Statistical analysis involved normalization, batch correction, and linear mixed models to assess time effects on derived glycan traits.The intermediate precision results consistently exhibited very low coefficient of variation values across all three test samples. This consistent pattern underscores the high level of precision inherent in the CGE method for analysing the glycan clock of ageing. The AstraZeneca MFO cohort did not show any statistically significant trends, whereas the menstrual cycle cohort exhibited statistically significant trends in digalactosylated (G2), agalactosylated (G0) and fucosylation (F). These trends were attributed to the effects of the menstrual cycle. Long-term stability analysis identified enduring age-related trends in both subjects, showing a positive time effect in G0 and bisected N-acetylglucosamine, as well as a negative time effect in G2 and sialylation, aligning with earlier findings. Time effects measured for monogalactosylation, and F remained substantially lower than ones observed for other traits.The study found that IgG N-glycome analysis using CGE-LIF exhibited remarkably high intermediate precision. Moreover, the study highlights the short- and long-term stability of IgG glycome composition, coupled with a notable capacity to adapt and respond to physiological changes and environmental influences such as hormonal changes, disease, and interventions. The discoveries from this study propel personalized medicine forward by deepening our understanding of how IgG glycome relates to age-related health concerns. This study underscores the reliability of glycans as a biomarker for tracking age-related changes and individual health paths.
Keywords: Ageing; Biomarkers; Glycans; IgG N-glycosylation; Time-dependent stability.
© 2024. The Author(s).
Conflict of interest statement
Gordan Lauc is the founder and CEO of Genos Ltd. Borna Rapčan, Azra Frkatović, Tea Pribić, Anđelo Beletić and Maja Hanić are employees of Genos Ltd. Julija Jurić is an employee of GlycanAge Ltd. The participation of all authors from the companies did not affect their objectivity and authenticity of the experimental results. The remaining authors declare that the research was conducted in the absence of any commercial or financial relationships that could be construed as a potential conflict of interest.
Figures


References
-
- Vanhooren V, Dewaele S, Libert C, Engelborghs S, De Deyn PP, Toussaint O, Debacq-Chainiaux F, Poulain M, Glupczynski Y, Franceschi C, Jaspers K, van der Pluijm I, Hoeijmakers J, Chen CC. Serum N-glycan profile shift during human ageing. Exp Gerontol. 2010;45(10):738–43. 10.1016/j.exger.2010.08.009. - PubMed
-
- Varki A, Cummings RD, Esko JD, Stanley P, Hart GW, Aebi M, Mohnen D, Kinoshita T, Packer NH, Prestegard JH, Schnaar RL, Seeberger PH, editors. Essentials of glycobiology. 4th ed. Cold Spring Harbor (NY): Cold Spring Harbor Laboratory Press; 2022. - PubMed
-
- Spiro RG. Protein glycosylation: nature, distribution, enzymatic formation, and disease implications of glycopeptide bonds. Glycobiology. 2002;12(4):43R-56R. 10.1093/glycob/12.4.43r. - PubMed
MeSH terms
Substances
Grants and funding
LinkOut - more resources
Full Text Sources
Medical
