

Transcriptomics analyses reveal the key genes involved in stamen petaloid formation in Alcea rosea L
- PMID: 38877392
- PMCID: PMC11177533
- DOI: 10.1186/s12870-024-05263-6
Transcriptomics analyses reveal the key genes involved in stamen petaloid formation in Alcea rosea L
Abstract
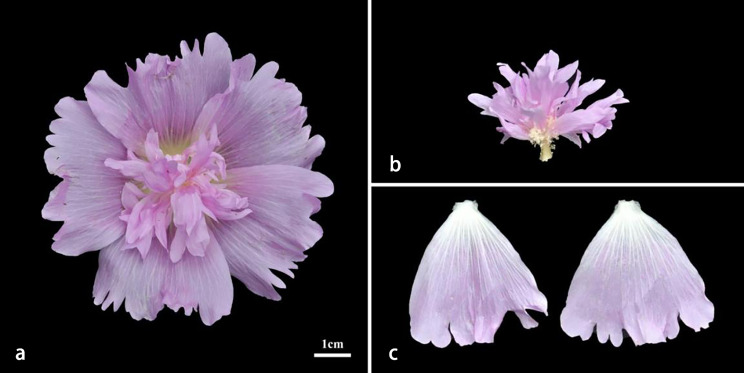
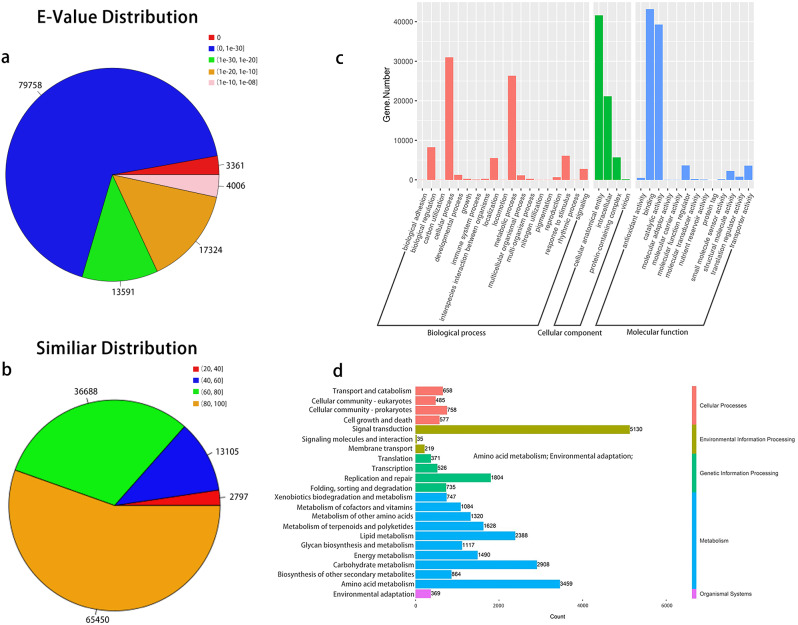
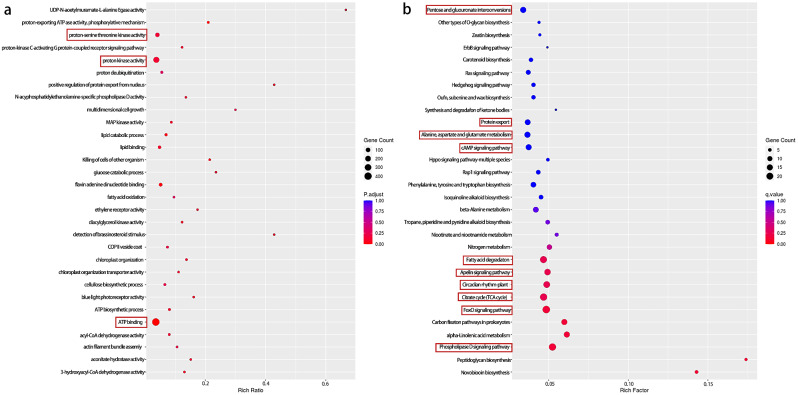
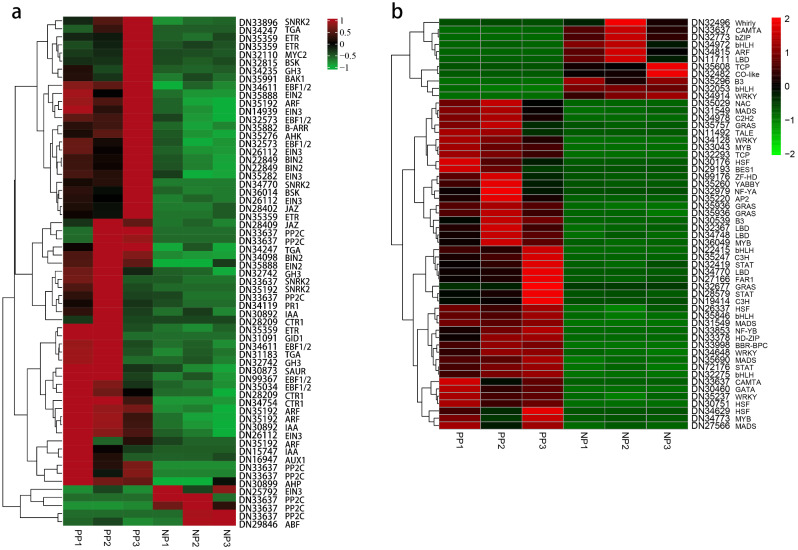
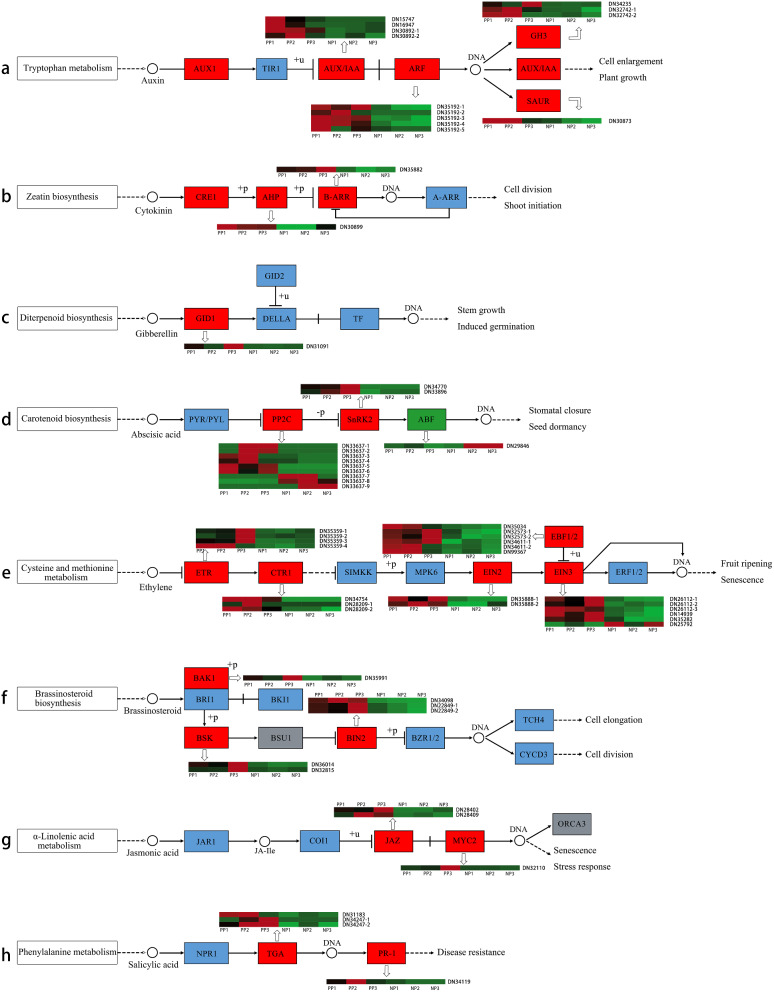
Alcea rosea L. is a traditional flower with a long cultivation history. It is extensively cultivated in China and is widely planted in green belt parks or used as cut flowers and potted ornamental because of its rich colors and flower shapes. Double-petal A. rosea flowers have a higher aesthetic value compared to single-petal flowers, a phenomenon determined by stamen petaloid. However, the underlying molecular mechanism of this phenomenon is still very unclear. In this study, an RNA-based comparative transcriptomic analysis was performed between the normal petal and stamen petaloid petal of A. rosea. A total of 3,212 differential expressed genes (DEGs), including 2,620 up-regulated DEGs and 592 down-regulated DEGs, were identified from 206,188 unigenes. Numerous DEGs associated with stamen petaloid were identified through GO and KEGG enrichment analysis. Notably, there were 63 DEGs involved in the plant hormone synthesis and signal transduction, including auxin, cytokinin, gibberellin, abscisic acid, ethylene, brassinosteroid, jasmonic acid, and salicylic acid signaling pathway and 56 key transcription factors (TFs), such as MADS-box, bHLH, GRAS, and HSF. The identification of these DEGs provides an important clue for studying the regulation pathway and mechanism of stamen petaloid formation in A. rosea and provides valuable information for molecular plant breeding.
Keywords: Alcea rosea L.; Flower morphology; Plant hormone; Stamen petaloid; Transcriptomics.
© 2024. The Author(s).
Conflict of interest statement
The authors declare no competing interests.
Figures


Similar articles
-
Transcriptomic analysis identifies the key genes involved in stamen petaloid in lotus (Nelumbo nucifera).BMC Genomics. 2018 Jul 27;19(1):554. doi: 10.1186/s12864-018-4950-0. BMC Genomics. 2018. PMID: 30053802 Free PMC article.
-
Floral organ transcriptome in Camellia sasanqua provided insight into stamen petaloid.BMC Plant Biol. 2022 Oct 5;22(1):474. doi: 10.1186/s12870-022-03860-x. BMC Plant Biol. 2022. PMID: 36199021 Free PMC article.
-
Differentially Expressed Genes between Carrot Petaloid Cytoplasmic Male Sterile and Maintainer during Floral Development.Sci Rep. 2019 Nov 22;9(1):17384. doi: 10.1038/s41598-019-53717-x. Sci Rep. 2019. PMID: 31757985 Free PMC article.
-
Progress on the mechanism of hormones regulating plant flower formation.Yi Chuan. 2020 Aug 20;42(8):739-751. doi: 10.16288/j.yczz.20-014. Yi Chuan. 2020. PMID: 32952110 Review.
-
Signalling cascades choreographing petal cell death: implications for postharvest quality.Plant Mol Biol. 2024 May 28;114(3):63. doi: 10.1007/s11103-024-01449-6. Plant Mol Biol. 2024. PMID: 38805152 Review.
Cited by
-
Chromosome-level genome assembly of the ornamental plant Alcea rosea.Sci Data. 2025 Jul 4;12(1):1145. doi: 10.1038/s41597-025-05473-z. Sci Data. 2025. PMID: 40615462 Free PMC article.
References
-
- Zhao YQ, Liu QL. Progress on the formation mechanism and genetic characterization of heavy petal flowers. Northwest J Bot. 2009;29(04):832–41.
-
- Jing D, Chen W, Xia Y, Shi M, Wang P, Wang SM, Wu D, He Q, Liang GL, Guo QG. Homeotic transformation from stamen to petal in Eriobotrya japonica is associated with hormone signal transduction and reduction of the transcriptional activity of ejag. Physiol Plant. 2019;168:893–908. doi: 10.1111/ppl.13029. - DOI - PubMed
-
- Li H, Song S, Wang C, Sun H. Comparative transcriptome analysis reveals the molecular mechanism underlying lily double flowering. Sci Hort. 2022;303:111221. doi: 10.1016/j.scienta.2022.111221. - DOI
MeSH terms
Substances
LinkOut - more resources
Full Text Sources
