. 2024 Jun 14;16(1):128.
doi: 10.1186/s13195-024-01491-y.

Brain age as a biomarker for pathological versus healthy ageing - a REMEMBER study

Affiliations

Brain age as a biomarker for pathological versus healthy ageing - a REMEMBER study

Mandy M J Wittens et al. Alzheimers Res Ther. .

Abstract

Objectives: This study aimed to evaluate the potential clinical value of a new brain age prediction model as a single interpretable variable representing the condition of our brain. Among many clinical use cases, brain age could be a novel outcome measure to assess the preventive effect of life-style interventions.

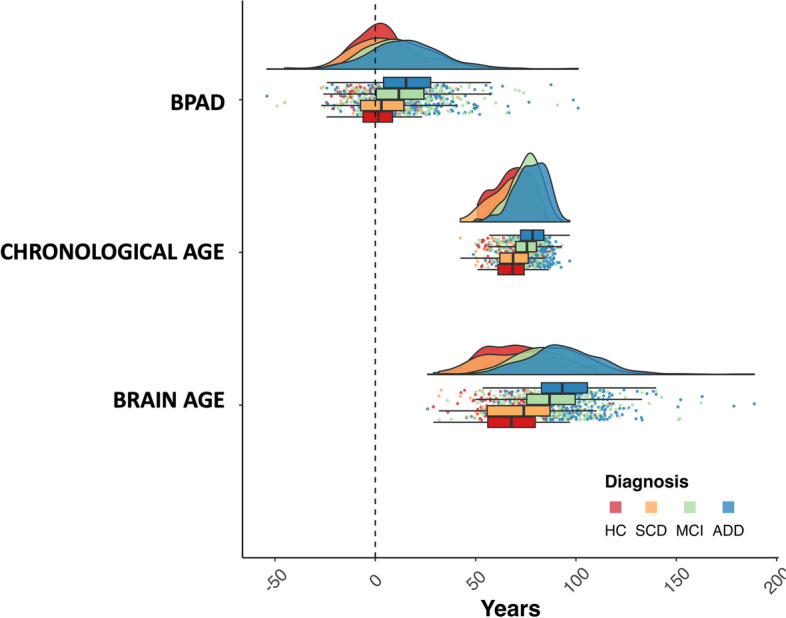
Methods: The REMEMBER study population (N = 742) consisted of cognitively healthy (HC,N = 91), subjective cognitive decline (SCD,N = 65), mild cognitive impairment (MCI,N = 319) and AD dementia (ADD,N = 267) subjects. Automated brain volumetry of global, cortical, and subcortical brain structures computed by the CE-labeled and FDA-cleared software icobrain dm (dementia) was retrospectively extracted from T1-weighted MRI sequences that were acquired during clinical routine at participating memory clinics from the Belgian Dementia Council. The volumetric features, along with sex, were combined into a weighted sum using a linear model, and were used to predict 'brain age' and 'brain predicted age difference' (BPAD = brain age-chronological age) for every subject.

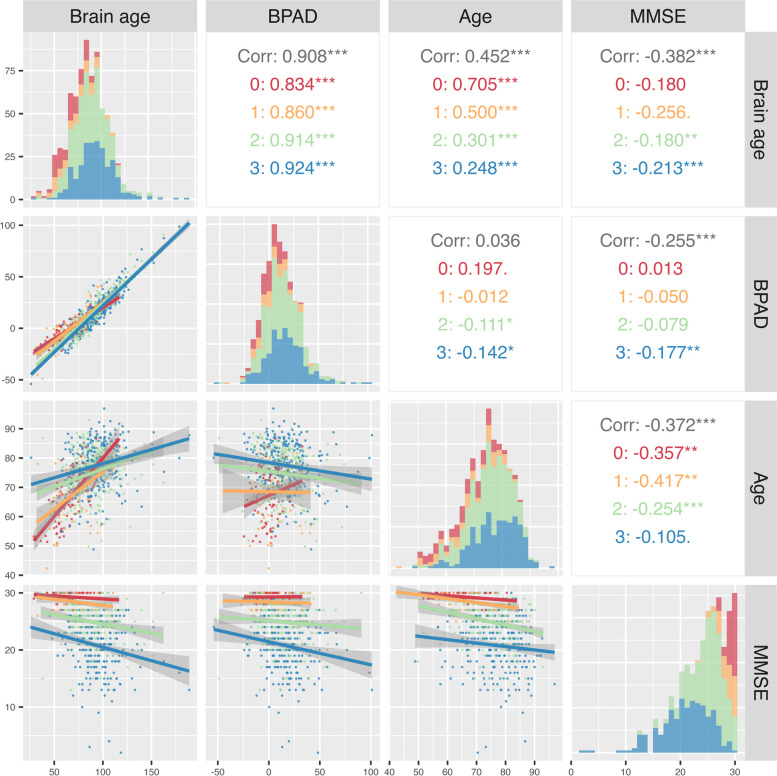
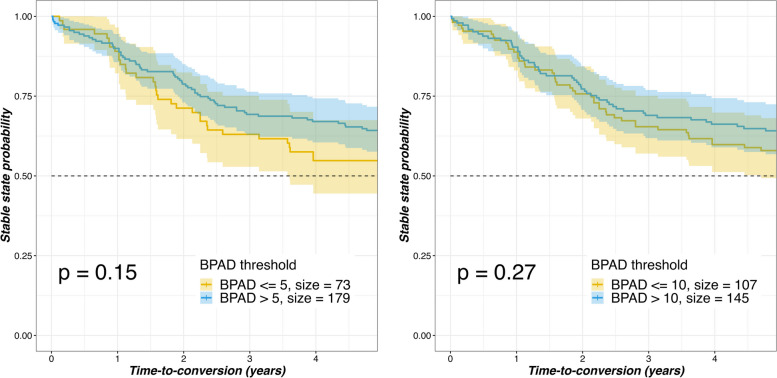
Results: MCI and ADD patients showed an increased brain age compared to their chronological age. Overall, brain age outperformed BPAD and chronological age in terms of classification accuracy across the AD spectrum. There was a weak-to-moderate correlation between total MMSE score and both brain age (r = -0.38,p < .001) and BPAD (r = -0.26,p < .001). Noticeable trends, but no significant correlations, were found between BPAD and incidence of conversion from MCI to ADD, nor between BPAD and conversion time from MCI to ADD. BPAD was increased in heavy alcohol drinkers compared to non-/sporadic (p = .014) and moderate (p = .040) drinkers.

Conclusions: Brain age and associated BPAD have the potential to serve as indicators for, and to evaluate the impact of lifestyle modifications or interventions on, brain health.

Keywords: Alzheimer’s disease; Automated volumetry; Biomarker; Brain age; Brain predicted age difference; Magnetic resonance imaging.


Conflict of interest statement

DMS, AR, DS, HS, and MMJW are, or were partially, employed by icometrix during the time of this study. SE serves as a consultant for icometrix, and served as consultant for Biogen, Danone, Eisai, Novartis, Nutricia, Pfizer, and Roche. SD was a PhD candidate in collaboration with icometrix. GN was on a 10% secondment from the UZ Brussel to icometrix during the time of this study and is a minority shareholder of icometrix. The remaining authors declare that the research was conducted in the absence of any commercial or financial relationships that could be construed as a potential conflict of interest.

Figures

Fig. 1
Fig. 1
Brain age estimates in three selected cases. Color-coded brain region segmentations based on icobrain dm; Frontal cortex, FC (green), Parietal cortex, PC (blue), Temporal Cortex, TC (red), Hippocampus, HIP (yellow). Volumetric signature circles (below) demonstrate the prevalence of individual patient volumes relative to an age and sex-matched healthy reference population. A value within the green inner circle aligns with volumes observed in > 10% of the reference population, indicating it falls within the normal range. The orange middle circle denotes threshold values that warrant caution and vigilance, corresponding to 10 > x > 1% of the reference population. A value residing within the blue circle signifies a volume found in < 1%, suggesting abnormality. A Subjective cognitive decline (SCD) subject with a chronological age of 71.6 years old and a brain age of 60.8 years old, accompanied by below volumetric signature indicating normal FC, PC, TC, and HIP volumes. B Single-domain (SD) mild cognitive impairment (MCI) patient with a chronological age of 81.5 years old and a brain age of 89.6 years old, accompanied by below volumetric signature indicating low HIP volume but normal FC, PC, TC, volumes. C Multi-domain (MD) MCI patient with a chronological age of 83.3 years old and a brain age of 104.1 years old, accompanied by below volumetric signature indicating low HIP volume and FC volumes, threshold TC volumes, and normal PC volumes D Alzheimer’s disease dementia (ADD) patient with a chronological age of 80.9 years old and a brain age of 131.3 years old, accompanied by below volumetric signature indicating generalized cortical atrophy
Fig. 2
Fig. 2
Distribution of age variables per diagnostic group. Cognitively healthy controls; HC. Subjective cognitive decline subjects; SCD. Mild cognitive impairment patients; MCI. Alzheimer disease dementia patients; ADD. Brain predicted age difference; BPAD. Age at baseline; Chronological age. All diagnostic groups are visualized (HC in red, SCD in orange, MCI in green, and ADD in blue)
Fig. 3
Fig. 3
Correlation matrix. Correlogram of the following selected variables: Brain-predicted age difference (BPAD), brain age, Mini-Mental State Examination (MMSE) score and chronological age (Age). Figures are color-coded based on diagnostic index; healthy controls, HC (red), subjective cognitive decline, SCD (yellow), mild cognitive impairment, MCI (green), Alzheimer’s disease dementia, ADD (blue). Below diagonal: visualization of correlation graphs per variable combination. Diagonal: depiction of variable distribution. Above diagonal: correlation coefficients for (from top to bottom): total dataset (Corr), HC, SCD subjects, MCI patients, and ADD patients. *p < 0.05, **p < 0.01, ***p < 0.001
Fig. 4
Fig. 4
Kaplan–Meier plots stratified with BPAD thresholds—progressive vs non-progressive (stable-state) MCI. Brain predicted age difference; BPAD. Mild Cognitive Impairment; MCI

References

    1. Fedele E. Anti-Amyloid Therapies for Alzheimer's Disease and the Amyloid Cascade Hypothesis. Int J Mol Sci. 2023;24(19):14499. doi: 10.3390/ijms241914499. - DOI - PMC - PubMed
    1. Kivipelto M, Mangialasche F, Ngandu T. Lifestyle interventions to prevent cognitive impairment, dementia and Alzheimer disease. Nat Rev Neurol. 2018;14(11):653–666. doi: 10.1038/s41582-018-0070-3. - DOI - PubMed
    1. Livingston G, Huntley J, Sommerlad A, Ames D, Ballard C, Banerjee S, et al. Dementia prevention, intervention, and care: 2020 report of the Lancet Commission. Lancet. 2020;396(10248):413–446. doi: 10.1016/S0140-6736(20)30367-6. - DOI - PMC - PubMed
    1. Habes M, Grothe MJ, Tunc B, McMillan C, Wolk DA, Davatzikos C. Disentangling Heterogeneity in Alzheimer's Disease and Related Dementias Using Data-Driven Methods. Biol Psychiatry. 2020;88(1):70–82. doi: 10.1016/j.biopsych.2020.01.016. - DOI - PMC - PubMed
    1. Bethlehem RAI, Seidlitz J, White SR, Vogel JW, Anderson KM, Adamson C, et al. Brain charts for the human lifespan. Nature. 2022;604(7906):525–533. doi: 10.1038/s41586-022-04554-y. - DOI - PMC - PubMed

Publication types

LinkOut - more resources