

Metagenomic approach revealed the mobility and co-occurrence of antibiotic resistomes between non-intensive aquaculture environment and human
- PMID: 38877573
- PMCID: PMC11179227
- DOI: 10.1186/s40168-024-01824-x
Metagenomic approach revealed the mobility and co-occurrence of antibiotic resistomes between non-intensive aquaculture environment and human
Abstract
Background: Aquaculture is an important food source worldwide. The extensive use of antibiotics in intensive large-scale farms has resulted in resistance development. Non-intensive aquaculture is another aquatic feeding model that is conducive to ecological protection and closely related to the natural environment. However, the transmission of resistomes in non-intensive aquaculture has not been well characterized. Moreover, the influence of aquaculture resistomes on human health needs to be further understood. Here, metagenomic approach was employed to identify the mobility of aquaculture resistomes and estimate the potential risks to human health.
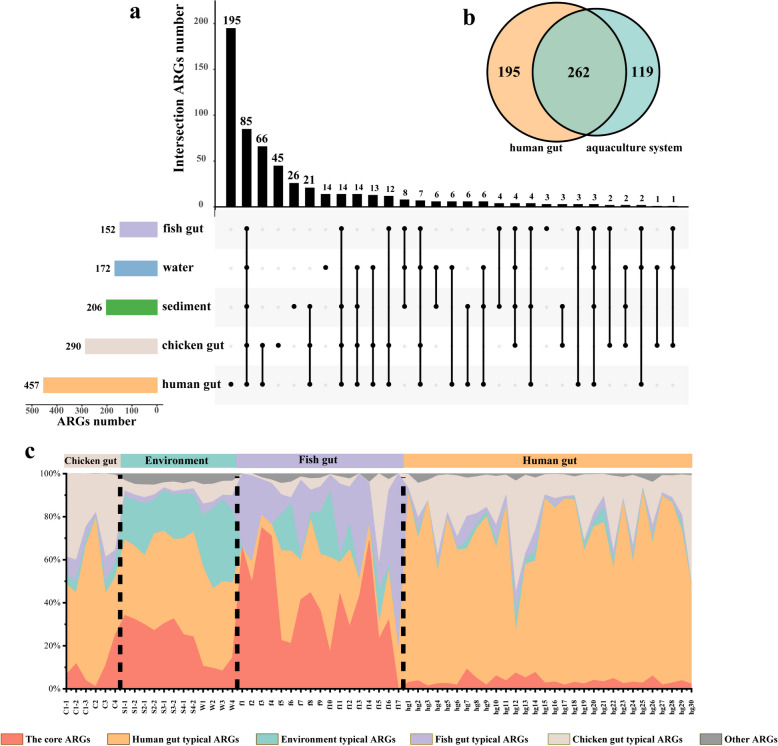
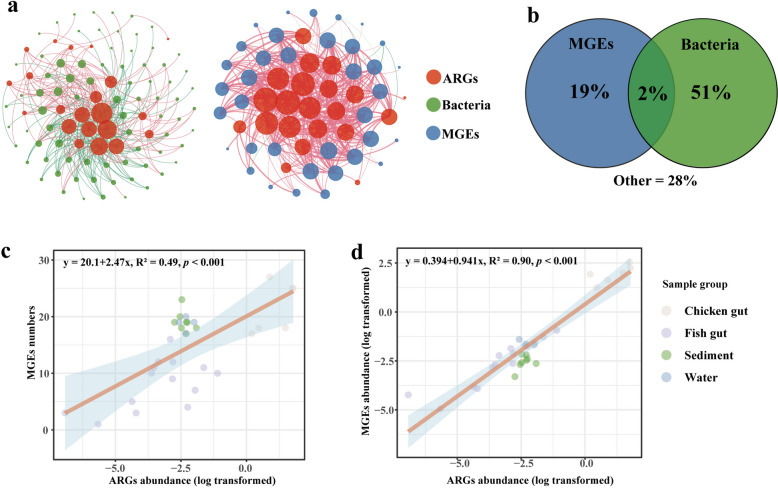
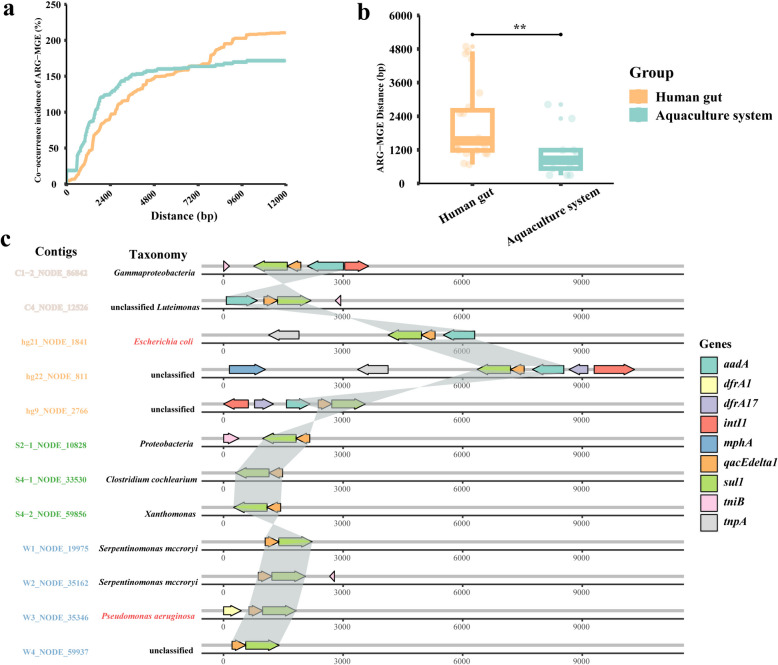
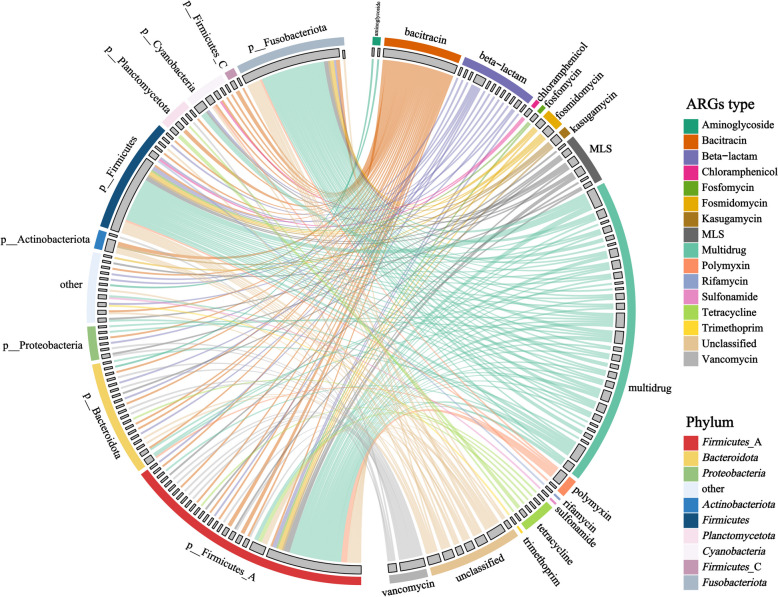
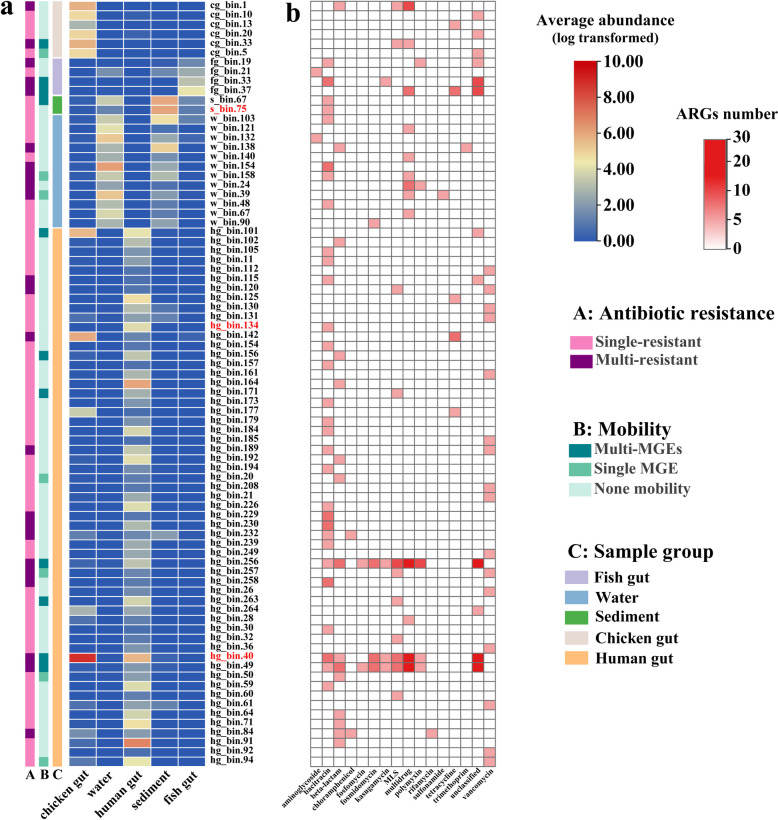
Results: The results demonstrated that antibiotic resistance genes (ARGs) were widely present in non-intensive aquaculture systems and the multidrug type was most abundant accounting for 34%. ARGs of non-intensive aquaculture environments were mainly shaped by microbial communities accounting for 51%. Seventy-seven genera and 36 mobile genetic elements (MGEs) were significantly associated with 23 ARG types (p < 0.05) according to network analysis. Six ARGs were defined as core ARGs (top 3% most abundant with occurrence frequency > 80%) which occupied 40% of ARG abundance in fish gut samples. Seventy-one ARG-carrying contigs were identified and 75% of them carried MGEs simultaneously. The qacEdelta1 and sul1 formed a stable combination and were detected simultaneously in aquaculture environments and humans. Additionally, 475 high-quality metagenomic-assembled genomes (MAGs) were recovered and 81 MAGs carried ARGs. The multidrug and bacitracin resistance genes were the most abundant ARG types carried by MAGs. Strikingly, Fusobacterium_A (opportunistic human pathogen) carrying ARGs and MGEs were identified in both the aquaculture system and human guts, which indicated the potential risks of ARG transfer.
Conclusions: The mobility and pathogenicity of aquaculture resistomes were explored by a metagenomic approach. Given the observed co-occurrence of resistomes between the aquaculture environment and human, more stringent regulation of resistomes in non-intensive aquaculture systems may be required. Video Abstract.
Keywords: ARG mobility; Aquaculture; Metagenome; One Health; Resistome.
© 2024. The Author(s).
Conflict of interest statement
The authors declare no competing interests.
Figures

Similar articles
-
A metagenomic analysis framework for characterization of antibiotic resistomes in river environment: Application to an urban river in Beijing.Environ Pollut. 2019 Feb;245:398-407. doi: 10.1016/j.envpol.2018.11.024. Epub 2018 Nov 12. Environ Pollut. 2019. PMID: 30453138
-
Diverse bacterial hosts and potential risk of antibiotic resistomes in ship ballast water revealed by metagenomic binning.Environ Res. 2024 Jul 15;253:119056. doi: 10.1016/j.envres.2024.119056. Epub 2024 May 3. Environ Res. 2024. PMID: 38704005
-
Metagenomic insights into differences in environmental resistome profiles between integrated and monoculture aquaculture farms in China.Environ Int. 2020 Nov;144:106005. doi: 10.1016/j.envint.2020.106005. Epub 2020 Jul 30. Environ Int. 2020. PMID: 32739516
-
Antimicrobial resistomes in food chain microbiomes.Crit Rev Food Sci Nutr. 2024;64(20):6953-6974. doi: 10.1080/10408398.2023.2177607. Epub 2023 Feb 13. Crit Rev Food Sci Nutr. 2024. PMID: 36785889 Review.
-
A review focusing on mechanisms and ecological risks of enrichment and propagation of antibiotic resistance genes and mobile genetic elements by microplastic biofilms.Environ Res. 2024 Jun 15;251(Pt 2):118737. doi: 10.1016/j.envres.2024.118737. Epub 2024 Mar 16. Environ Res. 2024. PMID: 38493850 Review.
Cited by
-
Comparative transcriptomic and molecular biology analyses to explore potential immune responses to Vibrio parahaemolyticus challenge in Eriocheir sinensis.Front Cell Infect Microbiol. 2024 Dec 20;14:1456130. doi: 10.3389/fcimb.2024.1456130. eCollection 2024. Front Cell Infect Microbiol. 2024. PMID: 39760091 Free PMC article.
-
Characterizing the gut microbiome of diarrheal mink under farmed conditions: A metagenomic analysis.PLoS One. 2024 Oct 30;19(10):e0312821. doi: 10.1371/journal.pone.0312821. eCollection 2024. PLoS One. 2024. PMID: 39475924 Free PMC article.
-
Microbiome, resistome, and potential transfer of antibiotic resistance genes in Chinese wet market under One Health sectors.BMC Microbiol. 2025 Jul 3;25(1):406. doi: 10.1186/s12866-025-04115-z. BMC Microbiol. 2025. PMID: 40604389 Free PMC article.
References
-
- FAO. The State of World fisheries and aquaculture 2020. Sustainability in action. Rome: FAO; 2020. p. 244. 10.4060/ca9229en.
-
- Herrero M, Wirsenius S, Henderson B, Rigolot C, Thornton P, Havlík P, de Boer I, Gerber PJ. Livestock and the environment: what have we learned in the past decade? Annu Rev Environ Resour. 2015;40(1):177–202. doi: 10.1146/annurev-environ-031113-093503. - DOI
MeSH terms
Substances
Grants and funding
- 2022A1515011961/Natural Science Foundation of Guangdong Province
- 2022A1515011961/Natural Science Foundation of Guangdong Province
- 2022A1515011961/Natural Science Foundation of Guangdong Province
- 2022A1515011961/Natural Science Foundation of Guangdong Province
- 22193062/National Natural Science Foundation of China
LinkOut - more resources
Full Text Sources
Medical
