. 2024 Jul;20(7):4649-4662.
doi: 10.1002/alz.13896. Epub 2024 Jun 14.

Entorhinal vessel density correlates with phosphorylated tau and TDP-43 pathology

Affiliations

Entorhinal vessel density correlates with phosphorylated tau and TDP-43 pathology

Josué Llamas Rodríguez et al. Alzheimers Dement. 2024 Jul.

Abstract

Introduction: The entorhinal cortex (EC) and perirhinal cortex (PC) are vulnerable to Alzheimer's disease. A triggering factor may be the interaction of vascular dysfunction and tau pathology.

Methods: We imaged post mortem human tissue at 100 μm3 with 7 T magnetic resonance imaging and manually labeled individual blood vessels (mean = 270 slices/case). Vessel density was quantified and compared per EC subfield, between EC and PC, and in relation to tau and TAR DNA-binding protein 43 (TDP-43) semiquantitative scores.

Results: PC was more vascularized than EC and vessel densities were higher in posterior EC subfields. Tau and TDP-43 strongly correlated with vasculature density and subregions with severe tau at the preclinical stage had significantly greater vessel density than those with low tau burden.

Discussion: These data impact cerebrovascular maps, quantification of subfield vasculature, and correlation of vasculature and pathology at early stages. The ordered association of vessel density, and tau or TDP-43 pathology, may be exploited in a predictive context.

Highlights: Vessel density correlates with phosphorylated tau (p-tau) burden in entorhinal and perirhinal cortices. Perirhinal area 35 and posterior entorhinal cortex showed greatest p-tau burden but also the highest vessel density in the preclinical phase of Alzheimer's disease. We combined an ex vivo magnetic resonance imaging model and histopathology to demonstrate the 3D reconstruction of intracortical vessels and its spatial relationship to the pathology.

Keywords: intracortical; parahippocampal gyrus; perirhinal cortex; proximity; subfields; vasculature.


Conflict of interest statement

A.V.D.K. has received royalties from Elsevier, has consulted and served on the medical advisory board for Nous Imaging and Turing Medical, has received travel support from Siemens Healthineers, and has stock options from Turing Medical. B.F. serves on the medical advisory board of DeepHealth/RadNet. B.F.’s interests were reviewed and are managed by Massachusetts General Hospital and Partners HealthCare in accordance with their conflict of interest policies. M.M. has served as a medicolegal consultant for and been paid for expert testimony by Cirinani Heller Harman law firm. M.P.F. has no relevant disclosures for this manuscript. J.C.A. has consulted Biospective, Inc. and received travel support from R01AG070592. J.L.R., J.O., E.R., and N.M. have no conflicts of interest to declare. A.V.D.K., B.F., M.M., M.P.F., and J.C.A.’s disclosures are unrelated to this work. Author disclosures are available in the supporting information.

Figures
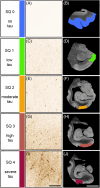
FIGURE 1
FIGURE 1
Phosphorylated tau density semiquantitative scoring: SQ scores 0 to 4 show the p‐tau density. The rows show respective score codes, colors, NFT density schemas, CP13 immunostaining, and manually labeled EC subfield in high‐resolution MRIs. SQ score 0 (no tau pathology, blue, panels A, B): no p‐tau inclusions and/or isolated NTs. Score 1 (low tau pathology, green, panels C, D): isolated NFTs, few NTs spread throughout the region. Score 2 (moderate tau pathology, orange, panels E, F): moderate but relatively sparse concentration of NFTs and NTs. Score 3 (high tau pathology, rust, panels G, H): moderate amount of densely packed NFTs and dense band‐like inclusions and NTs. Score 4 (severe tau pathology, burgundy, panels I, J): many densely packed NFTs and a homogenous distribution of NTs across the region. Pathology gradient with heaviest in posterior EC subfields in aging and preclinical AD. Panels (B), (D), (F), (H), and (J) show the parahippocampal anatomy from anterior (B) to more posterior (J) and respective severity score in label format. Magnification bar I = 250 𝜇m. Magnification bar panel J = 1 cm. AD, Alzheimer's disease; EC, entorhinal cortex; MRI, magnetic resonance imaging; NFT, neurofibrillary tangle; NT, neuropil thread; SQ, semiquantitative.
FIGURE 2
FIGURE 2
High‐resolution ex vivo magnetic resonance imaging (MRI) illustrated without and with annotated penetrating vessels. Panels (A), (C), and (E) show ex vivo MRI in coronal plane at three different rostrocaudal levels: (A) and (B) display the parahippocampal gyrus at the level of the amygdala, (C) and (D) at the level of the anterior hippocampal head, and (E) and (F) at the level of the posterior hippocampal head. Note the vessels (red) labeled in (B), (D), and (F). This illustration shows the slice‐by‐slice manual labeling approach and Table S1 in supporting information shows the number of MRI slices labeled per sample. Magnification bar = 5 mm.
FIGURE 3
FIGURE 3
3D reconstruction of intracortical vessel labeling in anterior parahippocampal samples: Panel (A) shows a brain schema with the EC and PC (highlighted by red box) and magnified in (B). Panel (C) displays a 3D brain MRI isosurface (sample 1) and (D) indicates arrows for anatomical direction. Panels (E)−(P) depict 3D reconstructions of each sample , which allows for visualization of entire EC and PC and shows individual sample densities. Some areas that appear vacant have vessels that were perpendicular to the image capture and were not visible in this particular plane. Panels (E)−(I), (L), and (N) represent right hemispheres while panels (J), (K), (M), (O), and (P) represent left hemispheres. Hemispheres were rotated to have the same orientation independent of laterality (anterior is on left). Panel (Q) show sample 1 at varying degrees: 0°, 15°, 30°, 60°, and 90°. These varying rotations enable visualization of the in‐plane vessels. See Video S1 in supporting information for optimal 3D reconstruction viewing. 3D, three dimensional; A, anterior; EC, entorhinal cortex; L, lateral; M, medial; MRI, magnetic resonance imaging; P, posterior; PC, perirhinal cortex.
FIGURE 4
FIGURE 4
3D vessel reconstructions segmented according to respective entorhinal and perirhinal subfields. 3D reconstruction of vessels (allows for visualization and the quantification of vessel density per EC and PC subfield. This approach gives context for the underlying cellular organization. The architectonic diagram (bottom left) shows the respective color‐coded EC subfields for reference. Arrows show anatomical direction. 3D, three dimensional; A, anterior; ECL, caudal‐limiting; ECs, caudal; EI, intermediate; ELc, lateral‐caudal; ELr, lateral rostral; EMI, medial‐intermediate; EO, olfactory; ER, rostral; L, lateral; M, medial; P, posterior.
FIGURE 5
FIGURE 5
Quantitative measures of vessel densities per subfield: (A) vessel densities (vasculature volume/subfield volume) of entorhinal subfields across all samples (n = 12 cases x 8 subfields = 96 subfields). EO is the most anteromedial while ECL is the most posterolateral. There is a significant effect of subfield on vessel densities (likelihood ratio test: < 0.001). (B), Vasculature densities of perirhinal subdivisions across all samples segmented by anterior, middle, and posterior regionality. There is a significant effect of subfield on vessel densities (likelihood ratio test: < 0.001). (C), Vessel densities for all EC subregions (EO + ER + ELr + EMI + EI + ELc + ECs + ECL) compared to PC subdivisions (anterior 35a + mid 35a + posterior 35a + anterior 35b + mid 35b + posterior 35b). The PC was significantly more vascularized than the EC (likelihood ratio test, P < 0.001). (D), Comparison between vessel densities between Brodmann's area 35a (anterior 35a + mid 35a + posterior 35a) and Brodmann's area 35b (anterior 35b + mid 35b + posterior 35b). Area 35a was significantly more densely vascularized than 35b (likelihood ratio test, P < 0.001). (E), Schema of the typical anatomy of key medial temporal lobe regions located at the “mid” level. Abbreviations or terminology include: Brodmann's area 28 = entorhinal cortex and is attached medially to the perirhinal cortex (BA35a and BA35b). Whiskers indicate min to max (range), horizontal line indicates median, and plus sign indicates mean. Brodmann's 35, Braak's transentorhinal cortex; EC, entorhinal cortex; ECL, caudal‐limiting; ECs, caudal; EI, intermediate; ELc, lateral‐caudal; ELr, lateral‐rostral; EMI, medial‐intermediate; EO, olfactory; ER, rostral; L, lateral; M, medial; P, posterior; PC, perirhinal cortex.
FIGURE 6
FIGURE 6
3D reconstruction of manually labeled vessels and segmentation by tau severity: posterolateral regions contain the highest tau burden. The color code corresponds to the five phosphorylated tau density semiquantitative scores described in Figure 1. Arrows show anatomical direction: A, anterior; L, lateral; M, medial; P, posterior.
FIGURE 7
FIGURE 7
Quantitative vessel density correlates with high tau and TDP‐43: (A) vessel densities of tau validated EC regions across BB I–II cases (n = 8). Control cases (BB 0) were not included in (A). Subregions with severe preclinical p‐tau had significantly higher vessel density than subregions with moderate or low p‐tau (post hoc testing: severe vs. moderate: z = 3.07, P = 0.012; severe vs. low: z = 4.55, P < 0.001). Low tau subregions had significantly lower vessel density than subregions of high p‐tau (post hoc testing: z = −3.47, P < 0.001). (B) Significant repeated measures correlation between mean p‐tau semiquantitative scores and vessel densities extracted from the same subfields (repeated measures correlations r [94] = 0.46, < 0.001). (C) Significant repeated measures correlation between mean pTDP‐43 semiquantitative scores and vessel densities extracted from the same subfields (repeated measures correlations r [88] = 0.40, < 0.001). (D) Comparison of EC and PC subfield vessel densities between BB 0 (controls) and BB I–IIs was not significant (likelihood ratio test: P = 0.864). Whiskers indicate min to max (range), horizontal line indicates median, and plus sign indicates mean. BB, Braak and Braak stage; EC, entorhinal cortex; PC, perirhinal cortex; p‐tau, phosphorylated tau; SQ, semiquantitative; TDP‐43, TAR DNA‐binding protein 43.

Similar articles

Cited by

References

    1. Duvernoy H, Cabanis EA, Bourgouin P, Risold PY. The Human Parahippocampus: Functional Anatomy, Vascularization and Serial Sections With MRI. Springer; 1998.
    1. Huther G, Dörfl J, Van der Loos H, Jeanmonod D. Microanatomic and vascular aspects of the temporomesial region. Neurosurgery. 1998;43:1118‐1136. doi: 10.1097/00006123-199811000-00065 - DOI - PubMed
    1. Marinković SV, Milisavljević MM, Vučković VD. Experimental and clinical studies: microvascular anatomy of the uncus and the parahippocampal gyrus. Neurosurgery. 1991;29:805. - PubMed
    1. Josephs KA, Murray ME, Whitwell JL, et al. Staging TDP‐43 pathology in Alzheimer's disease. Acta Neuropathol. 2014;127:441‐450. doi: 10.1007/s00401-013-1211-9 - DOI - PMC - PubMed
    1. Crary JF, Trojanowski JQ, Schneider JA, et al. Primary age‐related tauopathy (PART): a common pathology associated with human aging. Acta Neuropathol. 2014;128:755‐766. doi: 10.1007/s00401-014-1349-0 - DOI - PMC - PubMed

Publication types

LinkOut - more resources