. 2024 Aug 20;123(16):2476-2483.
doi: 10.1016/j.bpj.2024.06.011. Epub 2024 Jun 13.

Impact of trypsin on cell cytoplasm during detachment of cells studied by terahertz sensing

Affiliations

Impact of trypsin on cell cytoplasm during detachment of cells studied by terahertz sensing

Blandine Lordon et al. Biophys J. .

Abstract

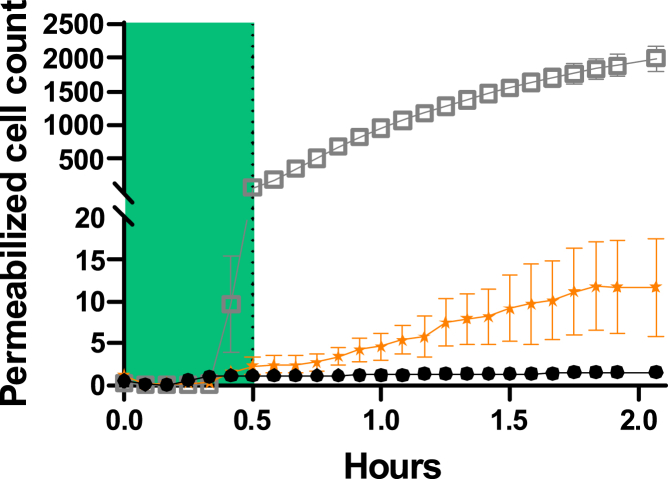
Trypsin is a very common enzyme used in cell culture to harvest cells by cleaving the proteins responsible for cell adhesion. However, trypsin also induces undesirable effects on cells, such as altering membrane proteins and the cytoskeleton, changing the composition of the cytoplasm and the cell volume, and even leading to cell death when used improperly. Using attenuated total reflection in the terahertz domain, confocal microscopy, and the propidium iodide test, we quantified in real time the change in cytoplasmic content induced by trypsin proteolysis on Madin-Darby canine kidney epithelial cells. We have observed a cytoplasmic modification from the very first seconds of trypsinization, following the change of cell volume due to mechanical re-equilibrium of the membrane. We found that the cytoplasmic alteration is associated with a transfer of small solutes: electrolytes and metabolites. We also found a very good nonlinear correlation between the side effects monitored by terahertz sensing and the cell height, regardless of the dependence of the cell height on trypsin concentration and exposure time.


Conflict of interest statement

Declaration of interests The authors declare no competing interests.

Figures

Figure 1
Figure 1
THz-ATR device. Two modulated beams arrive on the HR-Si prism in ATR configuration. Both beams induce an evanescent field above the prism (red and green gradient areas). A confluent layer of epithelial cells is placed in one of the evanescent fields. The other evanescent field is used as a reference. The reflected beam then takes into account the changes in the evanescent field induced by the sample, normalized to that of the reference. To see this figure in color, go online.
Figure 2
Figure 2
Experimental data. (A) THz-ATR acquisition during trypsinization of MDCK1 cells with a trypsin/EDTA concentration of 5 μM. The signal is divided into 3 zones. The left blue zone is a stabilization phase in PBS; the middle green zone is the dynamic of the signal during trypsin proteolysis, with trypsin/EDTA being added at t=0; and the right yellow zone is the signal after scraping the cells off the silicon plate. (B) Confocal microscopy on MDCK1 cells, transverse view. (B1) Layer of confluent MDCK1 cells stained with CellTracker Orange. (B2) Layer of the same cells but trypsinized for 15 min with a concentration of 5 μM. The blue curve shows the dye intensity distribution. The yellow arrow indicates a cell that detached from the substrate. The scale bar is 20 μm. (C) Evolution of the thickness of the MDCK1 cell layer as a function of time during trypsinization for different concentrations evaluated by confocal microscopy. The dots are the measured width of the intensity distribution of the CellTracker Orange dye staining the cytosol. The solid lines correspond to an exponential growth fit. The black curve is the control; red = 1 μM; blue = 2 μM; green = 3.5 μM; purple = 5 μM; orange = 8 μM. To see this figure in color, go online.
Figure 3
Figure 3
Multilayer model to compute the reflection coefficient as a function of the height of the cell layer H(t) and the fraction of cytoplasm content variation f(t). The blue arrows show the incident and reflected terahertz beams. The red arrows show the change of cytoplasmic content. The blue gradient represents the evanescent field. To see this figure in color, go online.
Figure 4
Figure 4
Dynamics of cell cytoplasm content. (A) Fraction of cytoplasm content f(t) for different concentrations of trypsin/EDTA. The black curve is the control (3); red = 1 μM (6); green = 3.5 μM (3); purple = 5 μM (5); orange = 8 μM (3). () is the number of samples. (B) Parameters of the exponential decay fit of f(t) for the different trypsin/EDTA concentrations f0+Aet/T. The black square curve represents the amplitude A of the decay; the red curve is the decay rate γ=1/T. To see this figure in color, go online.
Figure 5
Figure 5
Monitoring the penetration of propidium iodide by video microscopy after incubation of MDCK1 cells with 8 μM trypsin (orange star ★). The green zone represents the dynamics of the signal during the first 30 min of exposure to trypsin proteolysis, as monitored by terahertz radiation in Fig. 2. Saponin detergent (gray square ◻) is used as a positive control for membrane permeabilization. The negative control (no trypsin) is shown as black dots ●. For each, n=5. To see this figure in color, go online.
Figure 6
Figure 6
Correlation between the fraction of cytoplasm and the cell height. Cytoplasm content variation Δf versus cell height variation ΔH for five identical time delays from 80 to 300 s and for six trypsin/EDTA concentrations. The dot colors refer to the time delays as indicated in the legend. The dot shapes refer to concentrations at 0.5 (circle ●), 1 (square ◾), 2 (up triangle ▴), 3.5 (diamond ♦), 5 (down triangle ▾), and 8 μM (star ★). The solid line is an exponential growth function fit Δf=0.332(1eΔH/0.655). To see this figure in color, go online.

References

    1. Campbell N. 11th edition. Pearson; 2016. Biology.
    1. Fischer B., Meier A., et al. Gentile L. A Complete Workflow for the Differentiation and the Dissociation of hiPSC-derived Cardiospheres. Stem Cell Res. 2018;32:65–72. - PubMed
    1. Harrison C.J., Allen T.D. Cell Surface Morphology After Trypsinisation Depends on Initial Cell Shape. Differentiation. 1979;15:61–66. - PubMed
    1. Furcht L.T., Wendelschafer-Crabb G. Trypsin-Induced Coordinate Alterations in Cell Shape, Cytoskeleton, and Intrinsic Membrane Structure of Contact-Inhibited Cells. Exp. Cell Res. 1978;114:1–14. - PubMed
    1. Yan J., Xie C., et al. Li L. Effect of Trypsin Concentration on Living SMCC-7721 Cells Studied by Atomic Force Microscopy. J. Microsc. 2021;284:203–213. - PubMed

Publication types

LinkOut - more resources