. 2024 May 23;25(4):bbae291.
doi: 10.1093/bib/bbae291.

AITeQ: a machine learning framework for Alzheimer's prediction using a distinctive five-gene signature

Affiliations

AITeQ: a machine learning framework for Alzheimer's prediction using a distinctive five-gene signature

Ishtiaque Ahammad et al. Brief Bioinform. .

Abstract

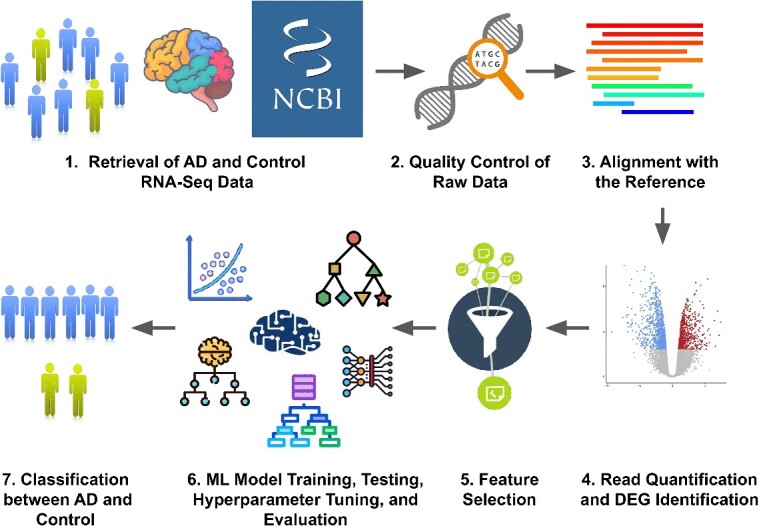
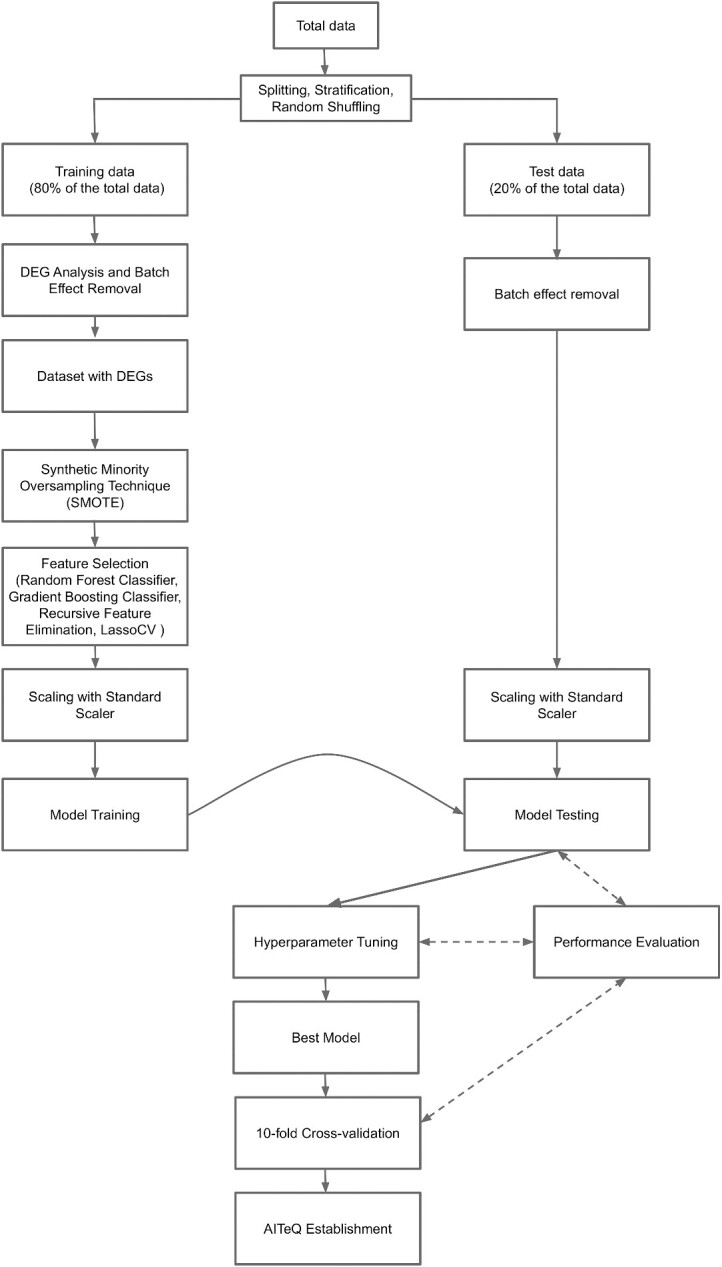
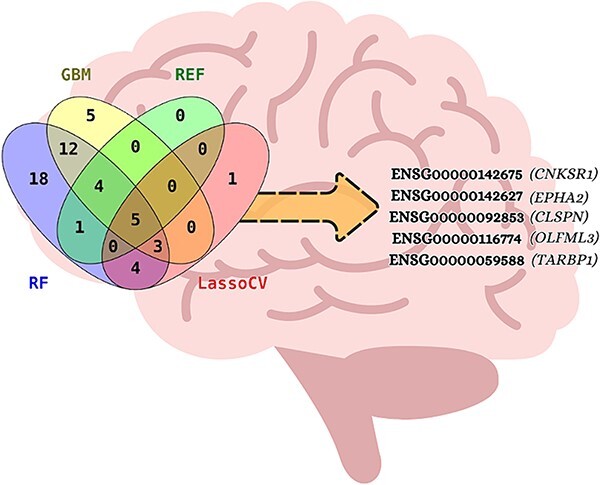
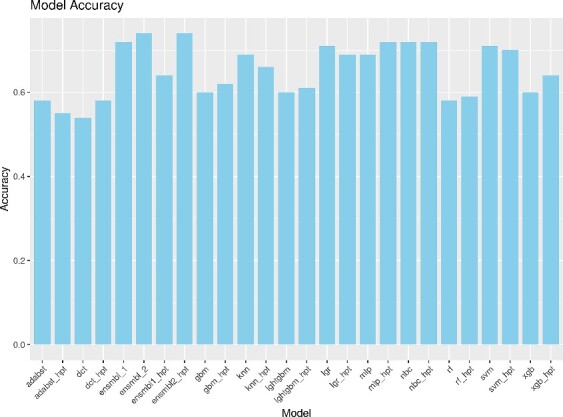
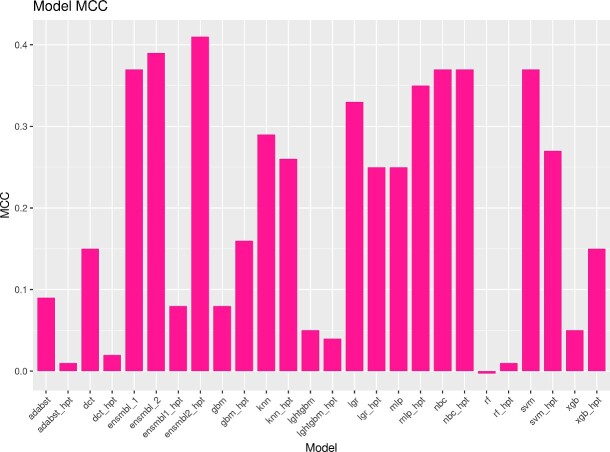
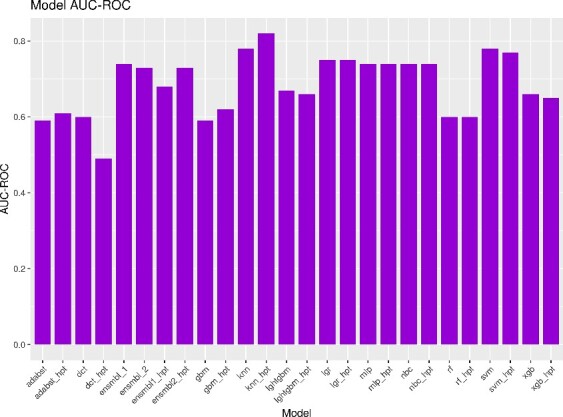
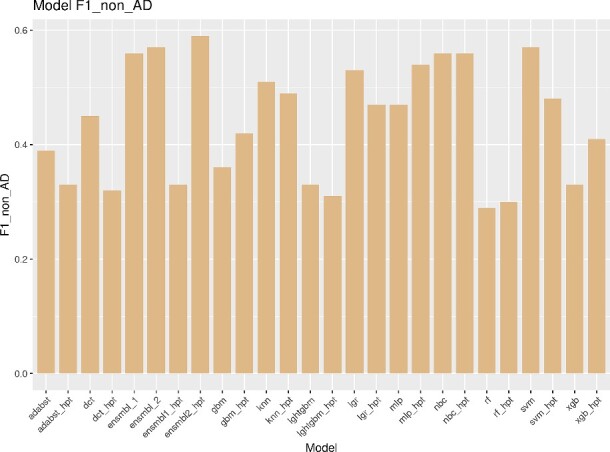
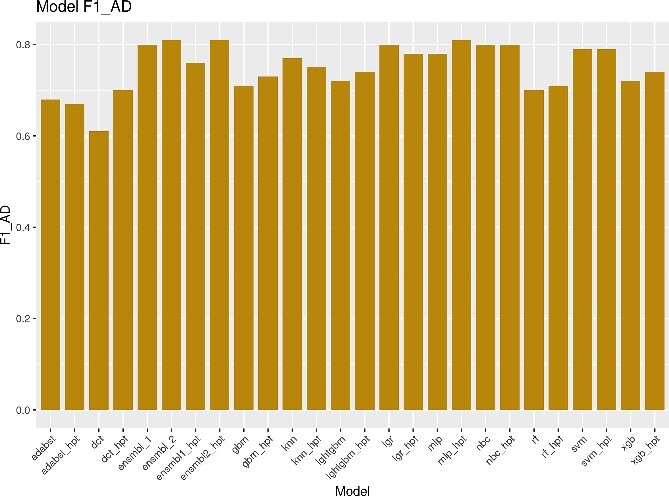
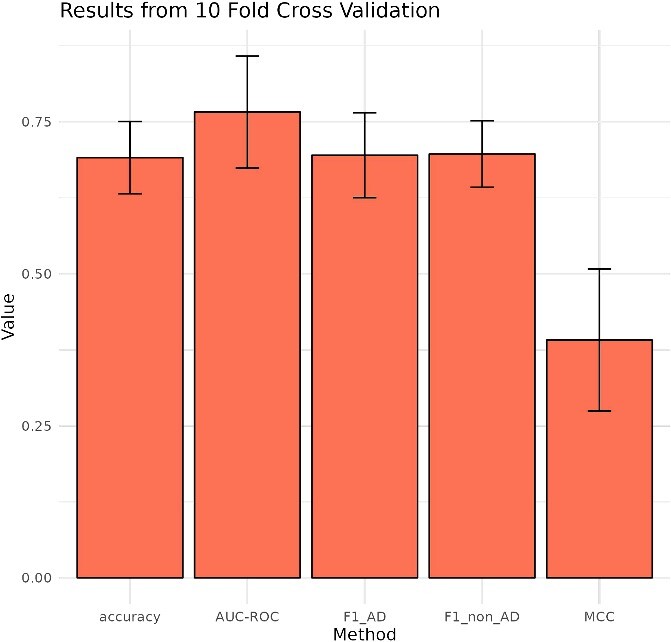
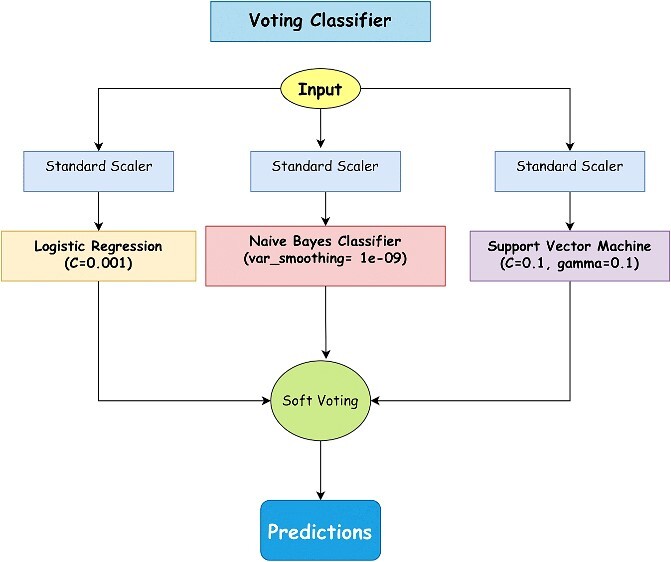
Neurodegenerative diseases, such as Alzheimer's disease, pose a significant global health challenge with their complex etiology and elusive biomarkers. In this study, we developed the Alzheimer's Identification Tool (AITeQ) using ribonucleic acid-sequencing (RNA-seq), a machine learning (ML) model based on an optimized ensemble algorithm for the identification of Alzheimer's from RNA-seq data. Analysis of RNA-seq data from several studies identified 87 differentially expressed genes. This was followed by a ML protocol involving feature selection, model training, performance evaluation, and hyperparameter tuning. The feature selection process undertaken in this study, employing a combination of four different methodologies, culminated in the identification of a compact yet impactful set of five genes. Twelve diverse ML models were trained and tested using these five genes (CNKSR1, EPHA2, CLSPN, OLFML3, and TARBP1). Performance metrics, including precision, recall, F1 score, accuracy, Matthew's correlation coefficient, and receiver operating characteristic area under the curve were assessed for the finally selected model. Overall, the ensemble model consisting of logistic regression, naive Bayes classifier, and support vector machine with optimized hyperparameters was identified as the best and was used to develop AITeQ. AITeQ is available at: https://github.com/ishtiaque-ahammad/AITeQ.

Keywords: AITeQ; Alzheimer’s disease; differentially expressed genes; machine learning; transcriptomics.


Figures

Figure 1
Figure 1
Workflow of the study. RNA-seq data of AD and control were retrieved from NCBI. The raw reads were subjected to quality control using FastQC and subsequently aligned with the human reference genome (GRCh38.p13) using HISAT2. The quantification of reads was performed using the featureCounts algorithm, while the identification of DEGs was conducted using the DESeq2 statistical tool. Feature selection was carried out using four methods. It was followed by 13 ML model training, testing, hyperparameter tuning, and evaluation.
Figure 2
Figure 2
Regions of the brain from where the RNA-seq datasets were generated (with sample size n).
Figure 3
Figure 3
The experiment setup. After splitting the total data into training and test data, they followed separate courses. The training data were subjected to DEG analysis, batch effect removal, SMOTE, feature selection, and standard scaling before model training, while the test data underwent batch effect removal (independently from training data) and standard scaling before model testing. The trained models were then applied on the test data. AITeQ was established after the tested models went through hyperparameter tuning, selection of best model, and 10-fold cross-validation. Performance evaluation was carried out at three different stages (before and after hyperparameter tuning and during 10-fold cross-validation) in order to gain important feedback and continue on to the next stage of the workflow.
Figure 4
Figure 4
A Venn diagram of features (genes) selected by four distinct feature selection algorithms—random Forest classifier, gradient boosting classifier, recursive feature elimination, and LassoCV. Five genes were unanimously predicted by all four methods.
Figure 5
Figure 5
Accuracy of different models before hyperparamter tuning lgr (logistic regression), rf (random forest), nbc (naive Bayes classifier), xgboost (extreme gradient boosting), adaboost (adaptive boosting), dct (decision tree), lghtgbm (light gradient boosting machine), gbm (gradient boosting machine), knn (k-nearest neighbor), svm (support vector machine), mlp (multilayer perceptron), ensmbl1 (lgr + nbc + svm + mlp with soft voting), ensmbl2 (lgr + nbc + svm with soft voting). Accuracy of different models after hyperparamter tuning (hpt) lgr_hpt, rf_hpt, nbc_hpt, xgboost_hpt, adaboost_hpt, dct_hpt, lghtgbm_hpt, gbm_hpt, knn_hpt, svm_hpt, mlp_hpt, ensmbl1_hpt (lgr + nbc + svm + mlp with soft voting), ensmbl2_hpt (lgr + nbc + svm with soft voting).
Figure 6
Figure 6
MCC evaluation of different models before hyperparamter tuning lgr (logistic regression), rf (random forest), nbc (naive Bayes classifier), xgboost (extreme gradient boosting), adaboost (adaptive boosting), dct (decision tree), lghtgbm (light gradient boosting machine), gbm (gradient boosting machine), knn (k-nearest neighbor), svm (support vector machine), mlp (multilayer perceptron), ensmbl1 (lgr + nbc + svm + mlp with soft voting), ensmbl2 (lgr + nbc + svm with soft voting). MCC evaluation of different models after hyperparamter tuning (hpt) lgr_hpt, rf_hpt, nbc_hpt, xgboost_hpt, adaboost_hpt, dct_hpt, lghtgbm_hpt, gbm_hpt, knn_hpt, svm_hpt, mlp_hpt, ensmbl1_hpt (lgr + nbc + svm + mlp with soft voting), ensmbl2_hpt (lgr + nbc + svm with soft voting).
Figure 7
Figure 7
AUC–ROC evaluation of different models before hyperparamter tuning lgr (logistic regression), rf (random forest), nbc (naive Bayes classifier), xgboost (extreme gradient boosting), adaboost (adaptive boosting), dct (decision tree), lghtgbm (light gradient boosting machine), gbm (gradient boosting machine), knn (k-nearest neighbor), svm (support vector machine), mlp (multilayer perceptron), ensmbl1 (lgr + nbc + svm + mlp with soft voting), ensmbl2 (lgr + nbc + svm with soft voting). AUC–ROC evaluation of different models after hyperparamter tuning (hpt)- lgr_hpt, rf_hpt, nbc_hpt, xgboost_hpt, adaboost_hpt, dct_hpt, lghtgbm_hpt, gbm_hpt, knn_hpt, svm_hpt, mlp_hpt, ensmbl1_hpt (lgr + nbc + svm + mlp with soft voting), ensmbl2_hpt (lgr + nbc + svm with soft voting).
Figure 8
Figure 8
F1 score evaluation (non-AD samples) of different models before hyperparamter tuning lgr (logistic regression), rf (random forest), nbc (naive Bayes classifier), xgboost (extreme gradient boosting), adaboost (adaptive boosting), dct (decision tree), lghtgbm (light gradient boosting machine), gbm (gradient boosting machine), knn (k-nearest neighbor), svm (support vector machine), mlp (multilayer perceptron), ensmbl1 (lgr + nbc + svm + mlp with soft voting), ensmbl2 (lgr + nbc + svm with soft voting). F1 score evaluation (non-AD samples) of different models after hyperparamter tuning (hpt) lgr_hpt, rf_hpt, nbc_hpt, xgboost_hpt, adaboost_hpt, dct_hpt, lghtgbm_hpt, gbm_hpt, knn_hpt, svm_hpt, mlp_hpt, ensmbl1_hpt (lgr + nbc + svm + mlp with soft voting), ensmbl2_hpt (lgr + nbc + svm with soft voting).
Figure 9
Figure 9
F1 score evaluation (AD samples) of different models before hyperparamter tuning lgr (logistic regression), rf (random forest), nbc (naive Bayes classifier), xgboost (extreme gradient boosting), adaboost (adaptive boosting), dct (decision tree), lghtgbm (light gradient boosting machine), gbm (gradient boosting machine), knn (k-nearest neighbor), svm (support vector machine), mlp (multilayer perceptron), ensmbl1 (lgr + nbc + svm + mlp with soft voting), ensmbl2 (lgr + nbc + svm with soft voting). F1 score evaluation (AD samples) of different models after hyperparamter tuning (hpt) lgr_hpt, rf_hpt, nbc_hpt, xgboost_hpt, adaboost_hpt, dct_hpt, lghtgbm_hpt, gbm_hpt, knn_hpt, svm_hpt, mlp_hpt, ensmbl1_hpt (lgr + nbc + svm + mlp with soft voting), ensmbl2_hpt (lgr + nbc + svm with soft voting).
Figure 10
Figure 10
Performance evaluation of the selected model after 10-fold cross-validation with standard deviations. Accuracy (0.691 ± 0.059), MCC (0.391 ± 0.117), AUC–ROC (0.766 ± 0.092), F1_AD (0.695 ± 0.070), F1_non_AD (0.697 ± 0.055).
Figure 11
Figure 11
Schematic representation of AITeQ. Following scaling, the input passes through logistic regression, naive Bayes classifier, and SVM with well-defined hyperparameters. The three predictions are then subjected to a soft voting mechanism that makes the final prediction.

Similar articles

Cited by

References

    1. Twine NA, Janitz K, Wilkins MR. et al. Whole transcriptome sequencing reveals gene expression and splicing differences in brain regions affected by Alzheimer’s disease. PloS One 2011;6:e16266. 10.1371/journal.pone.0016266 - DOI - PMC - PubMed
    1. Vadapalli S, Abdelhalim H, Zeeshan S. et al. Artificial intelligence and machine learning approaches using gene expression and variant data for personalized medicine. Brief Bioinform 2022;23:bbac191. 10.1093/bib/bbac191 - DOI - PMC - PubMed
    1. Wenric S, Shemirani R. Using supervised learning methods for gene selection in RNA-seq case-control studies. Front Genet 2018;9:297. 10.3389/fgene.2018.00297 - DOI - PMC - PubMed
    1. Choi SH, Labadorf AT, Myers RH. et al. Evaluation of logistic regression models and effect of covariates for case–control study in RNA-seq analysis. BMC Bioinformatics 2017;18:91. 10.1186/s12859-017-1498-y - DOI - PMC - PubMed
    1. Zhang F, Petersen M, Johnson L. et al. Recursive support vector machine biomarker selection for Alzheimer’s disease. J Alzheimers Dis 2021;79:1691–700. 10.3233/JAD-201254 - DOI - PubMed