. 2024 Oct;46(5):4827-4854.
doi: 10.1007/s11357-024-01197-x. Epub 2024 Jun 15.

The C. elegans Myc-family of transcription factors coordinate a dynamic adaptive response to dietary restriction

Affiliations

The C. elegans Myc-family of transcription factors coordinate a dynamic adaptive response to dietary restriction

Adam B Cornwell et al. Geroscience. 2024 Oct.

Abstract

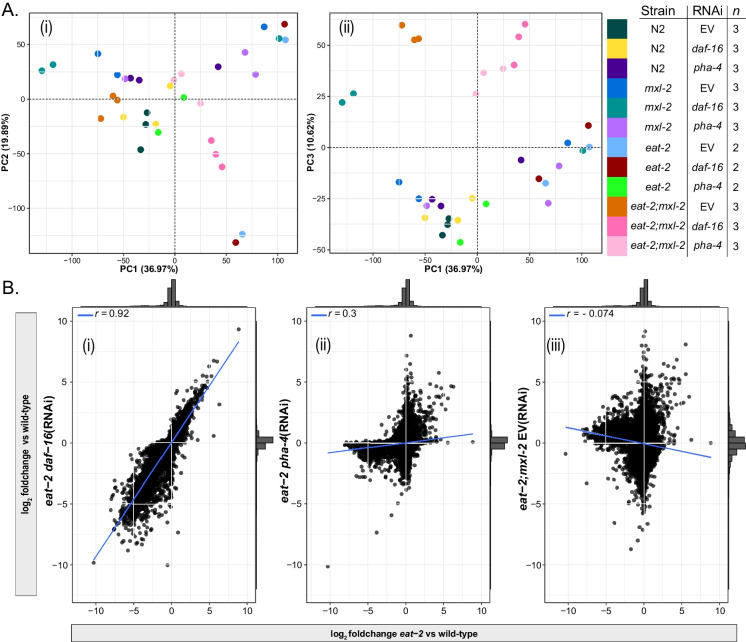
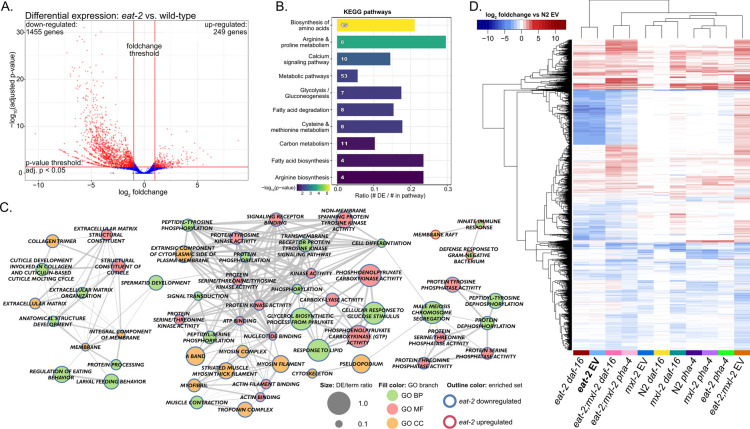
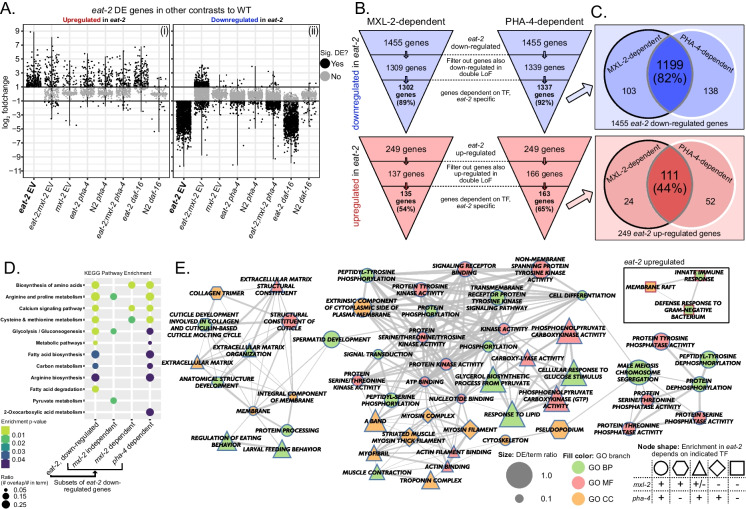
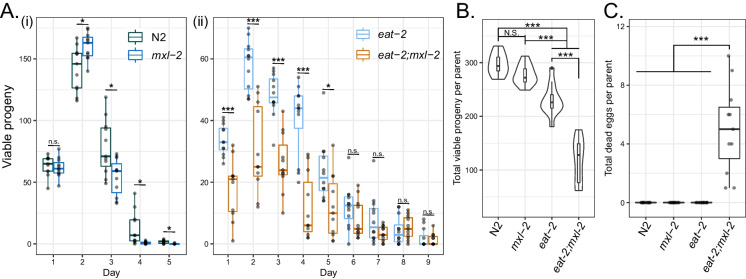
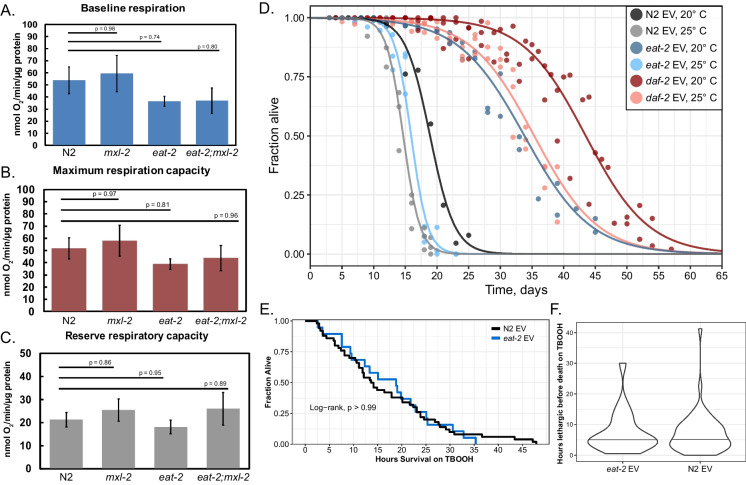
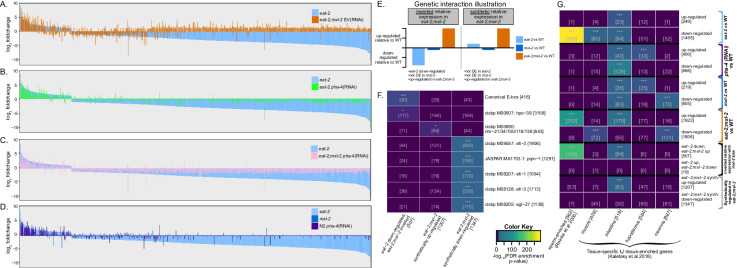
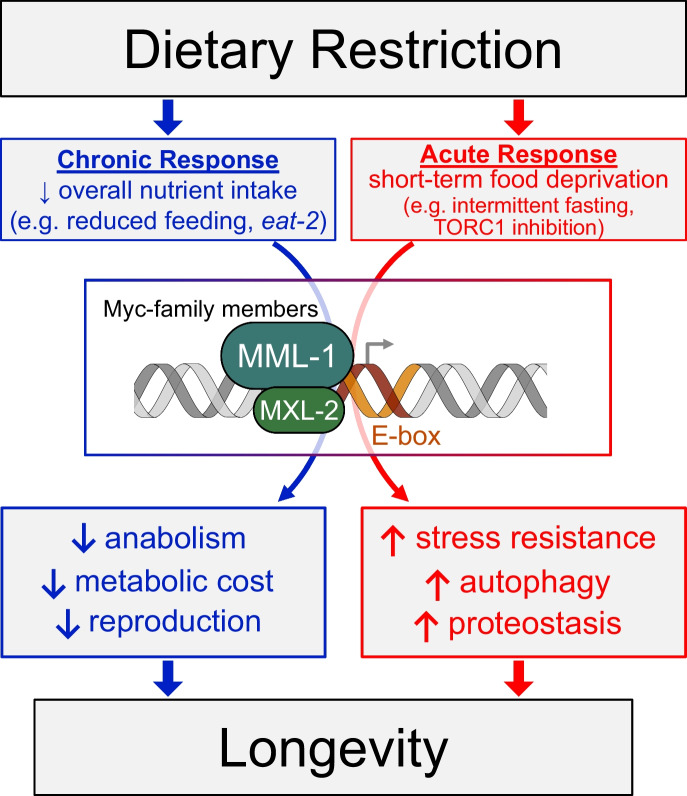
Dietary restriction (DR), the process of decreasing overall food consumption over an extended period of time, has been shown to increase longevity across evolutionarily diverse species and delay the onset of age-associated diseases in humans. In Caenorhabditis elegans, the Myc-family transcription factors (TFs) MXL-2 (Mlx) and MML-1 (MondoA/ChREBP), which function as obligate heterodimers, and PHA-4 (orthologous to FOXA) are both necessary for the full physiological benefits of DR. However, the adaptive transcriptional response to DR and the role of MML-1::MXL-2 and PHA-4 remains elusive. We identified the transcriptional signature of C. elegans DR, using the eat-2 genetic model, and demonstrate broad changes in metabolic gene expression in eat-2 DR animals, which requires both mxl-2 and pha-4. While the requirement for these factors in DR gene expression overlaps, we found many of the DR genes exhibit an opposing change in relative gene expression in eat-2;mxl-2 animals compared to wild-type, which was not observed in eat-2 animals with pha-4 loss. Surprisingly, we discovered more than 2000 genes synthetically dysregulated in eat-2;mxl-2, out of which the promoters of down-regulated genes were substantially enriched for PQM-1 and ELT-1/3 GATA TF binding motifs. We further show functional deficiencies of the mxl-2 loss in DR outside of lifespan, as eat-2;mxl-2 animals exhibit substantially smaller brood sizes and lay a proportion of dead eggs, indicating that MML-1::MXL-2 has a role in maintaining the balance between resource allocation to the soma and to reproduction under conditions of chronic food scarcity. While eat-2 animals do not show a significantly different metabolic rate compared to wild-type, we also find that loss of mxl-2 in DR does not affect the rate of oxygen consumption in young animals. The gene expression signature of eat-2 mutant animals is consistent with optimization of energy utilization and resource allocation, rather than induction of canonical gene expression changes associated with acute metabolic stress, such as induction of autophagy after TORC1 inhibition. Consistently, eat-2 animals are not substantially resistant to stress, providing further support to the idea that chronic DR may benefit healthspan and lifespan through efficient use of limited resources rather than broad upregulation of stress responses, and also indicates that MML-1::MXL-2 and PHA-4 may have distinct roles in promotion of benefits in response to different pro-longevity stimuli.

Keywords: Dietary restriction; Gene expression; Myc-family; Transcription factors.


Conflict of interest statement

The authors declare no competing interests.

Figures

Fig. 1
Fig. 1
Changes in gene expression after dietary restriction are broadly disrupted by loss of pha-4 and mxl-2 but not daf-16. A Principal component analysis on variance-stabilized (VST) normalized count data revealed distinct clusters between most sample groups and, that biological replicate samples cluster together in at least one principal component explaining a substantial proportion of the variance of the overall dataset. The Pearson r for pairwise correlations of VST gene expression between replicate samples across all expressed genes was not lower than 0.85 in any case (Figure S1A). Variability between biological replicates was not associated with sample batches (Figure S1B). The key shows the correspondence between color and sample group (strain, RNAi treatment) and the number of biological replicate samples for that group. At least two biological replicates were analyzed across 17,907 genes expressed in any sample. B Loss of pha-4 or mxl-2, but not daf-16, dramatically shifts changes in gene expression in eat-2 mutant animals. Comparison of relative expression changes (log2 fold-change) across 17,907 genes expressed in eat-2 DR animals relative to WT (x-axis), and daf-16(RNAi) (i), pha-4(RNAi) (ii), or eat-2;mxl-2 double mutant animals (iii). Pearson correlation indicates a strong and significant positive linear association between eat-2 vs WT and eat-2;daf-16(RNAi) vs WT (r = 0.92, p < 2.2 × 10−16), but a much weaker positive trend after loss of pha-4 (r = 0.3, p < 2.2 × 10−16), and a weak negative association after mxl-2 loss (r =  − 0.074, p < 2.2 × 10−16). The histograms indicate the density of genes
Fig. 2
Fig. 2
Broad metabolic reprogramming through changes in gene expression under conditions of DR. A Volcano plot for eat-2 differential gene expression analysis. The x-axis shows log2 fold-changes for eat-2 EV relative to wild-type (N2 EV), and the y-axis shows -log10 FDR-adjusted p-values from DESeq2. Vertical red lines indicate the threshold for fold-change magnitude (|log2 FC| ≥ 1), and the horizontal red line indicates the p-value threshold (adjusted p-value < 0.05). 1455 genes were significantly down-regulated, and 249 were upregulated in eat-2 (red points). The same criteria were applied to all other comparisons. B KEGG pathways significantly enriched under DR conditions. Pathways associated with down-regulated genes include multiple aspects of metabolism, including amino acid biosynthesis, fatty acid metabolism, and energy-associated pathways. The bar length is the fraction of the pathway genes overlapping with the DE genes, the number in the bar is the number of overlapping genes, and color shows the −log10 adjusted p-values (GOSeq). All pathways shown were significantly enriched (adjusted p-value < 0.05). C Significantly enriched Gene Ontology terms for DR signature genes. Network representation allows visualization of related terms which share member genes. Up- and down-regulated genes were treated as separate gene sets (red and blue node outline, respectively). Node fill color indicates the GO sub-ontology a term belongs to: biological process (BP), molecular function (MF), or cellular component (CC). Node size indicates the proportion of genes associated with the term that were present in the gene set. Connections between nodes (edges) show terms with shared member genes, with thicker edges representing a greater degree of overlap. D Heatmap of log2 fold-changes across the 4762 genes significantly DE in at least two comparisons relative to wild-type. Rows and columns are ordered by hierarchical clustering
Fig. 3
Fig. 3
mxl-2 and pha-4 are required for the majority of gene expression changes after DR. A Scatter plots of relative fold change in gene expression under the indicated condition. Only genes that were positively (i) or negatively (ii) DE in eat-2 mutant animals are shown. For each sub-panel, the specific genes represented in each column are the same, but the fold changes are for the indicated comparison. Horizontal lines at 1 and −1 indicate the foldchange threshold. mxl-2-dependent genes were DE in eat-2 but not significantly regulated in a similar manner in eat-2;mxl-2 animals. Genes with significant and opposite fold-change in mxl-2 single mutant animals were filtered out for specificity to the DR context. An analogous strategy was applied for investigating pha-4-dependent genes. B A schematic representation of the filter steps and the numbers of DE genes at each level (also see Table S3). C A slightly larger proportion of the eat-2 signature depends on pha-4, but the vast majority of the downregulated portion of the signature requires both mxl-2 and pha-4 (C). D, E Pathway (D) and Gene Ontology (E) enrichment for TF-dependent eat-2 genes. Over-representation analysis was run on each list independently. E shows the same network representation for eat-2 GO term enrichment as Fig. 2C, with node shapes indicating TF dependency (see legend on bottom-right). Triangle-shaped nodes are dependent on pha-4 but lacked significant enrichment in both the mxl-2-dependent and -independent sets. The only GO terms with significant enrichment in the DR upregulated genes are independent of both factors (see also Figure S2)
Fig. 4
Fig. 4
Loss of MXL-2 in DR but not ad libitum animals compromises fecundity and embryo viability. Brood size assays were performed to determine how reproduction-associated gene expression changes with mxl-2 loss in eat-2 affected reproductive fitness. A Viable progeny from each day over the course of the reproductive lifespan were counted for singled parent hermaphrodites for (i) N2 and mxl-2 and (ii) eat-2 and eat-2;mxl-2 animals. B Total brood size aggregated from across the observations in A for each strain. C Unhatched eggs were counted for each strain, but only found for eat-2;mxl-2 animals. Data is shown from a representative trial. See Table S4 for complete results and statistical analysis, and Figure S6 for the plotted results from an additional trial. Stars indicate FDR-corrected p-values: * < 0.05, ** < 0.01, *** < 0.005
Fig. 5
Fig. 5
Chronic DR does not alter respiratory rate, nor confer stress resistance. A–C Young adult eat-2(ad465) animals do not exhibit reduced respiratory rate, which remains unaltered by loss of mxl-2. Oxygen consumption of whole animals was measured and normalized by total protein. Results show mean ± SEM from three biological replicates, with p-values from ANOVA followed by the Tukey post-hoc test. A Baseline respiratory rate before treatment with FCCP or sodium azide. B The maximum respiratory capacity is the difference between the uncoupled rate after FCCP treatment and the inhibited rate after sodium azide treatment. C The reserve respiratory capacity is the difference between the uncoupled rate after FCCP treatment and the baseline rate. D eat-2(ad465) animals are not long-lived under chronic mild heat stress. Replica-set lifespan experiments for N2, eat-2(ad465), and daf-2(e1370) mutant animals kept at 20 and 25 °C post-development. Points represent observations of independent sub-populations of animals, fit with a logistic function to obtain a survival curve [32, 33]. daf-2 mutant animals (decreased insulin/IGF-1 signaling) are included as a positive control. Data represent at least two trials for each condition. E, F eat-2(ad465) animals are not more resistant to oxidative stress than wild-type. Young adult (day 2) animals were treated with tert-butyl hydroperoxide (TBOOH), and survival was analyzed from time-series images taken with an automated longitudinal imaging platform. Data represents two biological replicate plates per condition (N2 n = 50, eat-2 n = 19). E No significant difference was found in median survival in DR animals, indicating eat-2 does not provide increased resistance to oxidative stress in young adults. Data were analyzed non-parametrically with Kaplan–Meier, followed by the log-rank test in R. F The duration between when animals cease broad locomotion and time of death, based on automated longitudinal imaging, was also consistent between N2 and eat-2. Wilcoxon rank-sum test p-value = 0.8193
Fig. 6
Fig. 6
The Myc-family member MXL-2 is essential to coordinate changes in gene expression induced by dietary restriction. AD Loss of mxl-2 inverts expression of genes normally downregulated by DR. Differentially expressed eat-2 genes, ordered by foldchange compared to wild-type (blue bars). Foldchanges for the same genes in the indicated comparisons versus wild-type (N2 EV) are overlaid: A eat-2;mxl-2 (orange), B eat-2 pha-4(RNAi) (green), C eat-2;mxl-2 pha-4(RNAi) (pink), and D mxl-2 or pha-4 loss in otherwise wild-type animals (dark blue and purple, respectively). A Loss of mxl-2 in eat-2 inverts the relative expression of 507 significantly downregulated DR genes. B PHA-4 is required for repression of gene expression by DR. C PHA-4 is epistatic to MXL-2 in the regulation of gene expression after DR: loss of pha-4 suppresses the inverted pattern of relative expression that occurs in eat-2;mxl-2 mutant animals. E Schematic illustrating the inverted and synthetic patterns of eat-2 DE genes. Left: cases where a large number of DE genes in eat-2 animals were significantly differentially expressed in the opposite direction in eat-2;mxl-2 animals (inverted), but did not change expression after only a single genetic perturbation. Right: a large class of genes produced significant expression changes only in the presence of both the eat-2 and mxl-2 mutation but remain at WT-like levels in eat-2 and mxl-2 single mutant animals (synthetic). F The inverted gene set was significantly enriched for canonical Myc-family TF binding sites (E-boxes). Enrichment for TF motif-based predicted binding within the promoter regions of genes in the inverted and the synthetic gene sets. Promoters of the inverted gene set were enriched for CACGTG canonical E-box motifs. Synthetically upregulated gene promoters are enriched for the TF motif of nuclear hormone receptors (nhr-21, 34, 100, 118, and 138, paralogs). Synthetically down-regulated gene promoters are enriched for binding of GATA factors elt-1, elt-3, egl-27, and pqm-1. G Tissue enrichment for significantly differentially expressed genes (top four sets of rows), and genes with inverted expression and synthetic gene expression (bottom two sets of rows). Somatic tissue gene sets are based on the union of tissue-specific and tissue-enriched gene lists from cell type-specific bulk RNA-Seq in [93]. Sperm-specific genes are from [148]. For both F and G numbers in brackets indicate the size of the gene set or the number of genes in the intersection. Adjusted enrichment p-values from the hypergeometric test are indicated by cell color and stars: “***” p < 0.001 “**” 0.01 “*” 0.05 “.” 0.1
Fig. 7
Fig. 7
A model for the critical roles of Myc-family transcription factors in response to chronic and acute dietary restriction. Acute food deprivation and chronically reduced dietary intake are distinct stimuli that lead to longevity through different metabolic and physiological responses, but both require the Myc-family transcription factor complex MML-1::MXL-2 to regulate gene expression at E-box sites ([88, 137] and this work)

Update of

References

    1. Akashi H, Gojobori T. Metabolic efficiency and amino acid composition in the proteomes of Escherichia coli and Bacillus subtilis. Proceedings of the National Academy of Sciences of the United States of America. 2002;99. 10.1073/pnas.062526999. - PMC - PubMed
    1. Albert Hubbard EJ. Caenorhabditis elegans germ line: a model for stem cell biology. Dev Dyn. 2007;236:3343–57. 10.1002/dvdy.21335. 10.1002/dvdy.21335 - DOI - PMC - PubMed
    1. Allevato M, Bolotin E, Grossman M, et al. Sequence-specific DNA binding by MYC/MAX to low-affinity non-E-box motifs. PLoS ONE. 2017;12:1–20. 10.1371/journal.pone.0180147.10.1371/journal.pone.0180147 - DOI - PMC - PubMed
    1. Andrews, S. FastQC: A Quality Control Tool for High Throughput Sequence Data [Online]. 2010. Available online at: http://www.bioinformatics.babraham.ac.uk/projects/fastqc/.
    1. Apfeld J, O’Connor G, McDonagh T, et al. The AMP-activated protein kinase AAK-2 links energy levels and insulin-like signals to lifespan in C. elegans. Genes and Development. 2005;19:411. 10.1101/gad.1255404.3004.10.1101/gad.1255404.3004 - DOI - PMC - PubMed

MeSH terms