. 2024 Jun 1;45(8):e26714.
doi: 10.1002/hbm.26714.

Network enrichment significance testing in brain-phenotype association studies

Affiliations

Network enrichment significance testing in brain-phenotype association studies

Sarah M Weinstein et al. Hum Brain Mapp. .

Abstract

Functional networks often guide our interpretation of spatial maps of brain-phenotype associations. However, methods for assessing enrichment of associations within networks of interest have varied in terms of both scientific rigor and underlying assumptions. While some approaches have relied on subjective interpretations, others have made unrealistic assumptions about spatial properties of imaging data, leading to inflated false positive rates. We seek to address this gap in existing methodology by borrowing insight from a method widely used in genetics research for testing enrichment of associations between a set of genes and a phenotype of interest. We propose network enrichment significance testing (NEST), a flexible framework for testing the specificity of brain-phenotype associations to functional networks or other sub-regions of the brain. We apply NEST to study enrichment of associations with structural and functional brain imaging data from a large-scale neurodevelopmental cohort study.

Keywords: brain networks; brain‐phenotype associations; enrichment; hypothesis testing.


Conflict of interest statement

Russell T. Shinohara receives consulting income from Octave Bioscience and compensation for reviewership duties from the American Medical Association. Aaron Alexander‐Bloch receives consulting income from Octave Bioscience and holds equity and serves on the board of directors of Centile Biosciences. Mingyao Li receives research funding from Biogen Inc. that is unrelated to the current manuscript.

Figures

FIGURE 1
FIGURE 1
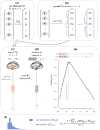
Example of how brain–phenotype associations are (a) quantified and spatially mapped and (b) compared to maps of functional networks (e.g., those delineated by Yeo et al., 2011). As we discuss in Section 1, existing methods for evaluating network specificity (or “enrichment”) of brain–phenotype associations have been subjective, which may preclude reproducibility, or relied on strong assumptions, which may result in type I error inflation. In Section 2, we propose a new approach, called NEST, to address these limitations.
FIGURE 2
FIGURE 2
Illustration of NEST, which adapts Subramanian et al.'s (2005) GSEA to test network enrichment in brain–phenotype association studies. In (a), we illustrate how local brain–phenotype associations are quantified at each vertex using a statistic, Tv, which we compute at every vertex (v=1,,V). In (b), we show that by permuting participants, we obtain a null version of Tv (also computed for v=1,,V). In (c), we sort the values of Tv from positive to negative and in (d), we match the order of the sorted list of Tv to the binary network annotation map, which partitions the brain into locations inside and outside N. In (e), we obtain our test statistic (enrichment score, ES), which quantifies the extent to which values of Tv with larger magnitude tend to appear within versus outside the network N. A running sum is initialized at 0 and increases by an increment proportional to Tv for vN and decreases by a uniform increment (proportional to the number of vN) otherwise. The ES (green dotted line) is defined as the largest magnitude attained by the running sum over the entire progression down the list. We calculate the ES based on both observed Tvs (those obtained in a) and null Tvs (those obtained in b), and in (f), we estimate a p‐value by comparing the observed and null enrichment scores.
FIGURE 3
FIGURE 3
Comparison of our proposed method, NEST, to the spin test (Alexander‐Bloch et al., 2018) and FastGSEA (Korotkevich et al., ; Park et al., 2018), which have been used to evaluate network enrichment in previous neuroimaging studies. All three methods begin with (a), estimating brain–phenotype associations at each location. In (b), both NEST (which is based on Subramanian et al.'s (2005) GSEA) and FastGSEA estimate an enrichment score (ES), illustrated in detail in Figure 2. For the spin test, the test statistic is a measure of spatial correspondence between the map of brain phenotype associations and the network partition map. In (c), we illustrate the type of randomization each method uses in order to generate a null distribution. In NEST, a null distribution is formed by ES's computed after permuting participants (also see Figure 2), whereas FastGSEA permutes spatial units (e.g., vertices or parcels). In the spin test, a spherical projection of the network partition map is randomly rotated before recomputing the spatial correspondence measure forming the null distribution.
FIGURE 4
FIGURE 4
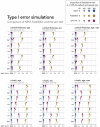
Comparison of type I error levels of our proposed method (NEST), the spin test (Alexander‐Bloch et al., 2018), and FastGSEA (Korotkevich et al., ; Park et al., 2018) based on 1000 random sub‐samples of different sizes (50, 100, 200, or 300). In each sub‐sample, p‐values are obtained from each method (based on 999 permutations for NEST and FastGSEA, or 999 random rotations for the spin test). Type I error estimates with 95% binomial confidence intervals are provided in Table C.1 of Appendix C. Our results suggest that NEST controls type I errors at the nominal level (α=0.05) in null simulations involving all six brain–phenotype associations considered, all networks, and all sample sizes (Nsub). In contrast, neither the spin test nor FastGSEA control type I error levels, suggesting these methods may not be reliable in tests of network enrichment. We speculate that this may be due to inherent spatial smoothness of null brain–phenotype association maps, even in the absence of genuine network enrichment. Examples of simulated null association maps involving the n‐back task are shown in Figure C.1 of Appendix C. DA, dorsal attention; DM, default mode; FP, frontoparietal; LI, limbic; SM, somatomotor; VA, ventral attention; VI, visual.
FIGURE 5
FIGURE 5
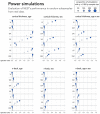
Power of NEST based on data‐driven simulation studies. We randomly select subsamples of different sizes (50, 100, 200, or 300) from the Philadelphia Neurodevelopmental Cohort and apply NEST to test enrichment of age, sex, and age × sex effects on cortical thickness (top row) and n‐back activation (bottom row) in each of the seven networks delineated by Yeo et al. (2011). Given results from our type I error simulations (Figure 4), assessing power of FastGSEA or the spin test would not be meaningful. DA, dorsal attention; DM, default mode; FP, frontoparietal; LI, limbic; SM, somatomotor; VA, ventral attention; VI, visual.
FIGURE 6
FIGURE 6
Results from application of NEST to evaluate network enrichment of associations between cortical thickness or n‐back with age, sex, or age × sex interactions. For each setting, we map association statistics (signed multivariate Wald statistic, as described in Section 2.3.1 and Appendix B) across the cortical surface. Unadjusted p‐values based on K = 4999 permutations are reported for each of Yeo et al.'s (2011) seven network partitions (displayed at the bottom), with bold text indicating results that remain statistically significant after controlling the false discovery rate (FDR) at q<0.05 across both brain measurements (cortical thickness, n‐back), all three phenotypes (age, sex, age × sex), and all seven networks. Interpretation of age effects: shades of red (blue) indicate locations where the brain measurement is estimated to increase (decrease) nonlinearly with age, including nonlinear age effects that may differ by sex. Interpretation of sex effects: shades of red (blue) indicate locations where the brain measurement is estimated to be higher (lower) for females versus males, including sex differences that may vary nonlinearly with age. Interpretation of age × sex effects: shades of red (blue) indicate locations where nonlinear age effects were estimated to be higher (lower) for females versus males.

Update of

References

    1. Alexander‐Bloch, A. F. , Shou, H. , Liu, S. , Satterthwaite, T. D. , Glahn, D. C. , Shinohara, R. T. , Vandekar, S. N. , & Raznahan, A. (2018). On testing for spatial correspondence between maps of human brain structure and function. Neuroimage, 178, 540–551. - PMC - PubMed
    1. Baller, E. B. , Valcarcel, A. M. , Adebimpe, A. , Alexander‐Bloch, A. , Cui, Z. , Gur, R. C. , Gur, R. E. , Larsen, B. L. , Linn, K. A. , O'Donnell, C. M. , Pines, A. R. , Raznahan, A. , Roalf, D. R. , Sydnor, V. J. , Tapera, T. M. , Tisdall, M. D. , Vandekar, S. , Xia, C. H. , Detre, J. A. , … Satterthwaite, T. D. (2022). Developmental coupling of cerebral blood flow and fMRI fluctuations in youth. Cell Reports, 38(13), 110576. - PMC - PubMed
    1. Baum, G. L. , Cui, Z. , Roalf, D. R. , Ciric, R. , Betzel, R. F. , Larsen, B. , Cieslak, M. , Cook, P. A. , Xia, C. H. , Moore, T. M. , Ruparel, K. , Oathes, D. J. , Alexander‐Bloch, A. F. , Shinohara, R. T. , Raznahan, A. , Gur, R. E. , Gur, R. C. , Bassett, D. S. , & Satterthwaite, T. D. (2019). Development of structure–function coupling in human brain networks during youth. Proceedings of the National Academy of Sciences, 117(1), 771–778. 10.1073/pnas.1912034117 - DOI - PMC - PubMed
    1. Belzunce, F. , Riquelme, C. M. , & Mulero, J. (2015). An introduction to stochastic orders. Academic Press.
    1. Burt, J. B. , Helmer, M. , Shinn, M. , Anticevic, A. , & Murray, J. D. (2020). Generative modeling of brain maps with spatial autocorrelation. NeuroImage, 220, 117038. - PubMed