. 2024 Aug 21;112(16):2708-2720.e9.
doi: 10.1016/j.neuron.2024.05.027. Epub 2024 Jun 14.

APP fragment controls both ionotropic and non-ionotropic signaling of NMDA receptors

Affiliations

APP fragment controls both ionotropic and non-ionotropic signaling of NMDA receptors

Jade Dunot et al. Neuron. .

Abstract

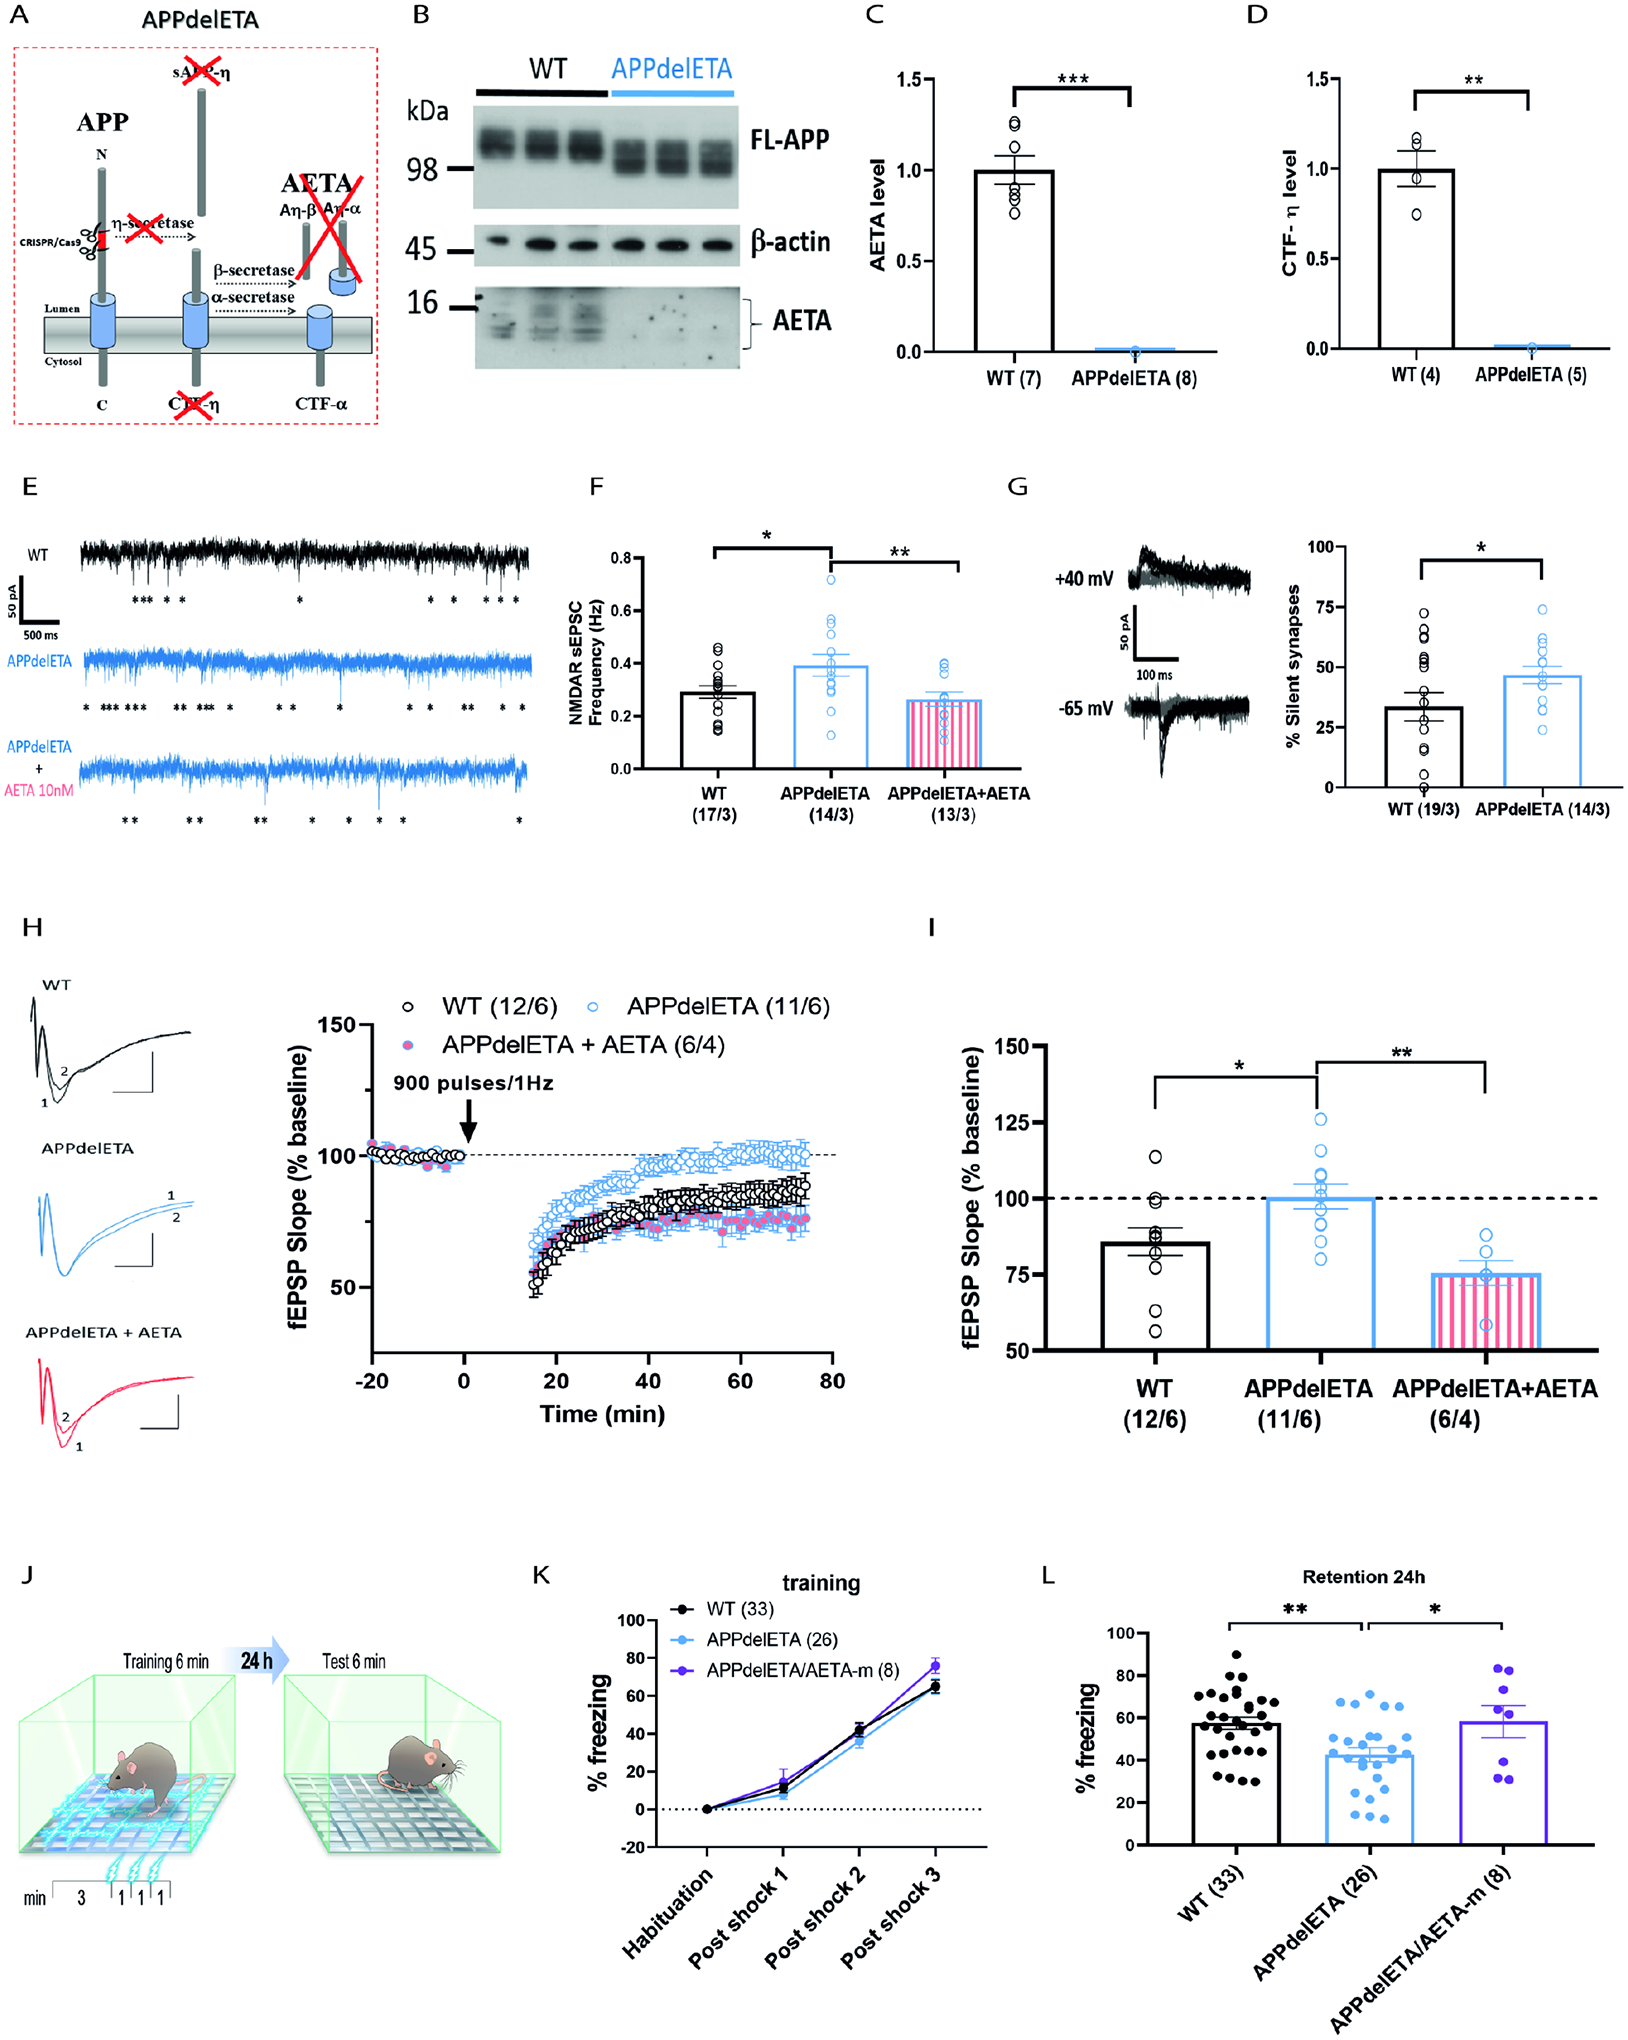
NMDA receptors (NMDARs) are ionotropic receptors crucial for brain information processing. Yet, evidence also supports an ion-flux-independent signaling mode mediating synaptic long-term depression (LTD) and spine shrinkage. Here, we identify AETA (Aη), an amyloid-β precursor protein (APP) cleavage product, as an NMDAR modulator with the unique dual regulatory capacity to impact both signaling modes. AETA inhibits ionotropic NMDAR activity by competing with the co-agonist and induces an intracellular conformational modification of GluN1 subunits. This favors non-ionotropic NMDAR signaling leading to enhanced LTD and favors spine shrinkage. Endogenously, AETA production is increased by in vivo chemogenetically induced neuronal activity. Genetic deletion of AETA production alters NMDAR transmission and prevents LTD, phenotypes rescued by acute exogenous AETA application. This genetic deletion also impairs contextual fear memory. Our findings demonstrate AETA-dependent NMDAR activation (ADNA), characterizing AETA as a unique type of endogenous NMDAR modulator that exerts bidirectional control over NMDAR signaling and associated information processing.

Keywords: APP; NMDA receptors; amyloid-β precursor protein; eta-secretase; hippocampus; long-term depression; memory; non-ionotropic signaling; spine shrinkage; synapse.


Conflict of interest statement

Declaration of interests The authors declare no competing interests.

Figures

Figure 1.
Figure 1.. AETA inhibits NMDA receptor ionotropic activity
(A) Depicted is the η-secretase-dependent processing of APP. Shedding occurs within the luminal ectodomain liberating sAPP-η, while the membrane bound C-terminal fragment (CTF-η) is further processed alternatively by either α- or β-secretases releasing a longer or shorter form of AETA, respectively (Aη-α and Aη-β). (B) (Top) Representative current traces quantified in oocytes expressing recombinant AMPARs containing GluA1/GluA2 (left) or NMDARs containing GluN1/GluN2B (right) before (black) and after (red) application of AETA (100 nM). NMDAR recordings were made in presence of 100 μM L-glutamate/1 μM glycine. AMPAR recordings were made in presence L-glutamate (300 μM) and cyclothiazide (CTZ, 100 μM). (Bottom) Graph represents % peak current (normalized to averaged baseline) of AMPARs (either GluA1/GluA2 or GluA2/GluA3) and NMDARs (either GluN1/GluN2A or GluN1/GluN2B) after application of either AETA (100 nM) or Control peptide (CtrlP; 100 nM). n = between 8 and 11 independent oocytes per condition. (C) (Top) Representative traces of NMDAR currents recorded at CA3-CA1 synapse of adult mouse slices before (baseline, black) and after application of CtrlP (grey, 10 nM) or AETA (red, 10 nM). (bottom) Bar graph of AETA or CtlP effect on NMDAR EPSC calculated 25–30 min post application (full time course shown in Figure S2B). n = number of patched neurons per condition. (D) 2-photon image of CA1 hippocampal neuron filled with Alexa594 (red) and Fluo-5f (green). Boxed area is enlarged on right with uncaging spot indicated in yellow and line scan indicated in white. Dual channel line scan images with response to five uncaging events (50Hz, yellow dots) shown below. (E) Line scan profiles across spine heads (scale bars: 100 ms /ΔF/F 2 a.u.) and simultaneous electrophysiological recordings of uEPSP (scale bars: 50 ms/0.5 mV) in response to five uncaging events before (black) and after D-APV (100 μM, blue), AETA (10 nM, red) or CtrlP (10 nM, grey). (F) Peak spine calcium transients are depressed after 10 min of 10 nM AETA application (n=6 neurons) but not after CtrlP application (n=5). (G-H) Effect of AETA (100 nM) on NMDAR current in oocytes expressing GluN1/GluN2B in presence of different concentrations of glutamate (1, 10 or 100 μM) (G) or glycine (0,1, 1 or 10 μM) (H). n= oocytes per condition. (I) Dose-response activation curves for glycine in absence or presence of AETA (100 nM) measured in oocytes expressing either GluN1/GluN2A (left) or GluN1/GluN2B (right). (J) Dose response curve of AETA’s effect (10 nM) on native NMDAR current at CA3-CA1 synapse in mouse hippocampal slices measured by patch-clamp in presence of different concentrations of D-serine (0, 1, 3, 10, 30 and 100 μM) in recording solution. n= neurons patched per condition. (K) (left) Time course of AETA’s effect (10 nM) on NMDAR currents at CA3-CA1 synapse in mouse hippocampal slices measured during different washout protocols. Protocol 1: 20 min AETA (10 nM) followed by washout with aCSF; Protocol 2: 20 min AETA (10 nM) followed by addition of D-serine (100 μM) but in continuous presence of AETA; Protocol 3: 20 min AETA (10 nM) followed by substitution with D-serine (100 μM). (right) Time course data plotted as a bar graph showing % NMDAR current measured during last 5 min for each protocol (normalized to averaged baseline current of that protocol). Statistics: One-way ANOVA followed by Tukey’s multiple comparisons test (B, G, H, J and K); Man-Whitney test (C); Paired Student’s t-test (F). See supplemental statistics Table file for full statistics. See also Figure S1–S5 for additional experiments related to Figure 1.
Figure 2.
Figure 2.. AETA modifies NMDAR conformation, enhances LTD via non-ionotropic activity of NMDARs and promotes spine shrinkage.
(A) Schematic principle of intra-molecular FLIM-FRET experiment. Hippocampal neurons were transfected either with GluN1-GFP alone (donor only, upper panel) or in combination with GluN1-mCherry (donor + acceptor, lower panel; all constructs co-transfected with GluN2B-flag). Upon excitation of the GFP fluorophore with blue light, the proximity of GluN1-GFP and GluN1-mCherry within a receptor and overlap of GFP emission and mCherry excitation spectra allows resonance energy transfer (black arrow) from the donor fluorophore (GFP) to the acceptor fluorophore (mCherry), causing excitation of the acceptor fluorophore (red arrow) and a subsequent decrease in the fluorescence lifetime of the donor fluorophore (green arrows). (B) Representative illustrations of GFP lifetime in neuronal fields (upper panels) and GluN1-GFP only (donor only) and GluN1-GFP/GluN1-mCherry (D+A) dendritic spine clusters (lower panels) 10 min after exposure to the CtrlP or AETA (10 nM). Graph represents GFP lifetime in GluN1-GFP only (Don. only) and GluN1-GFP/GluN1-mCherry (Don. + Acc.) clusters 10 min after exposure to CtrlP (10 nM; Don. Only, n = 738 clusters; Don. + Acc., n = 432 clusters) or AETA (10 nM; Don. Only, n = 796 clusters; Don. + Acc., n = 299 clusters); (C) (left) FRET efficiency in GluN1-GFP/GluN1-mCherry clusters 10 min after exposure to CtrlP (10 nM; n = 432 clusters) or AETA (10 nM; n = 299 clusters). (right) FRET efficiency in GluN1-GFP/GluN1-mCherry clusters averaged per cell 10 min after exposure to CtrlP (10 nM; n = 23 cells) or AETA (10 nM; n = 18 cells). (Top) Diagram of movement of GluN1 intracellular tail in control condition (CtrlP) and in presence of AETA. (D) Representative traces (left, 1 shows trace pre-, 2 shows trace post-induction) and summary graph (right) of fEPSP slope (% baseline) pre- and post-LTD induction (time 0) in control (Ctrl, aCSF only) or in presence of AETA (10nM) throughout recording. (E) Summary of fEPSP magnitude 45–60 min after LTD induction as fEPSP (% baseline) for data shown in (D). n/N= number of slices/mice. (F-G) same as in (D-E) but in presence of 100 μM MK801 (3h pre-incubation and throughout recording). (H) (left) Low magnification image of GFP-labelled CA1 pyramidal neuron from P18–21 GFP-M mice. (Right) High magnification images of basal dendrites of CA1 pyramidal neurons from GFP-M mice before (time 0) and after (1 and 30 min) high-frequency glutamate uncaging (HFU, yellow cross) at an individual dendritic spine (yellow arrowhead) in presence of 10 nM CtrlP or AETA. (I-J) HFU-induced spine growth in presence of CtrlP (gray filled circles/bar; n=7 cells/6 mice) was converted to spine shrinkage in the presence of AETA (red filled circles/bar; n=7 cells/6 mice). Volume of unstimulated neighboring spines (open circles/bars) was unchanged. Statistics: Kruskal-Wallis test followed by Dunn’s multiple comparison test (B); Mann Whitney test (C); unpaired Student’s t-test (E and G); Two-way ANOVA with Bonferroni’s multiple comparisons test (J). See supplemental statistics Table file for full statistics. See also Figure S6 and S7 for additional experiments related to Figure 2.
Figure 3.
Figure 3.. Endogenous increase of AETA by in vivo BACE1 inhibition leads to increased LTD and endogenous AETA production increases with in vivo neuronal activity
(A) Diagram of experimental plan. The BACE1 inhibitor LY2811376 (or saline) was administered by gavage 12 hours before sacrificing the mouse. Brains were removed to prepare hippocampal slices for electrophysiology (D-E). The rest of the brains were used for immunoblotting to check for increase in AETA (B-C), (B) Ponceau staining and immunoblot (M3.2 antibody) of AETA from saline and LY2811376 treated brains. (C) Quantification of levels of AETA in saline and LY2811376 treated brains (normalized to ponceau). n= number of mice (D) Representative traces (left, 1 shows trace pre-, 2 shows trace post-induction; scale bars: 10 ms / 0,2 mV) and summary graph (right) of fEPSP slope (% baseline) pre- and post-LTD induction (time 0) at CA3-CA1 synapse in hippocampal slices from saline and LY2811376 treated mice. (E) Bar graph of fEPSP magnitude 45–60 min after LTD induction as fEPSP (% baseline) for data shown in (D). n/N= slices/mice. (F) Diagram of experimental design to activate or inhibit neurons in vivo using AAV-hM3Dq-mCherry or AAV-hM4Di-mCherry, respectively and quantify AETA levels. (G) (Top) Example of immunoblot showing detection of mCherry, AETA and β-actin in hM3Dq transduced tissue after saline or CNO i.p. injection; (bottom) Quantification of AETA in hM3Dq-SAL and hM3Dq-CNO (normalized to β-actin and mCherry). All quantified blots are provided in Fig. S9C–D. N= number of mice. (H) (Top) Example of immunoblot showing detection of mCherry, AETA and β-actin in hM4Di transduced tissue after saline or CNO i.p. injection; (bottom) Quantification of AETA in hM4Di-SAL and hM4Di-CNO (normalized to β-actin and mCherry). All quantified blots are provided in Fig. S9E–F. N= number of mice. Statistics: unpaired Student’s t-test (C and E), Man-Whitney test (G and H). See supplemental Statistics Table file for full statistics. See also Figure S8 and S9 for additional experiments related to Figure 3.
Figure 4.
Figure 4.. APPdelETA mice display altered NMDAR transmission, loss of LTD and reduced memory.
(A) Depicted is the prevention of η-secretase dependent processing of APP due to a 41 amino acid in frame deletion (marked in red; CRISPR/Cas 9 gene editing) in the APPdelETA mouse model. Due to this deletion, No η-secretase shedding occurs (no sAPP-η) and the membrane bound C-terminal fragment (CTF-η) and AETA peptides are not produced in homozygous APPdelETA mice. (B) Example of an immunoblot of hippocampal tissue showing detection of full-length APP (FL-APP), β-actin (loading control) and AETA in WT and APPdelETA hippocampal lysates. Note that FL-APP is smaller in size in APPdelETA tissue due to endogenous deletion. (C) Quantification of endogenous AETA levels in WT and APPdelETA hippocampi, normalized to β-actin levels. All quantified blots are provided in Fig. S10A–B. n= number of mice. (D) Quantification of endogenous CTF-η levels (precursor of AETA) in WT and APPdelETA hippocampi, normalized to β-actin levels. Quantified blot is provided in Fig. S10C. n= number of mice. (E) Representative traces of NMDAR sEPSCs recorded in CA1 pyramidal of slices from WT mice, APPdelETA mice and in APPdelETA mice in presence of AETA (10nM) in recording bath. (F) NMDAR sEPSC frequency calculated from traces as shown in (E). n/N= neurons/mice. (G) Traces show ten consecutive synaptic responses recorded at −65 mV and +40 mV evidencing responses (black) and failures (grey). Bar graph shows calculated percentage of silent synapses in WT and APPdelETA neurons. n/N= neurons/mice. (H) Representative traces (left, 1 shows trace pre-, 2 shows trace post-induction; scale bars: 10 ms / 0,2 mV) and summary graph (right) of fEPSP slope (% baseline) pre- and post-LTD induction (time 0) at CA3-CA1 synapse in hippocampal slices of WT and APPdelETA mice without or with supplementation of 10 nM AETA (in recording bath). (I) Bar graph of fEPSP magnitude 45–60 min after LTD induction as fEPSP (% baseline) for data shown in (H). n/N= slices/mice. (J) Diagram of contextual fear conditioning behavioral task. (K) Graph represents % freezing measured during 6 min of training session in the three genotypes. (L) Graph represents % freezing measured during 6 minutes of Test session done 24 hours after training session. Statistics: Man-Whitney test (C and D); One-way ANOVA followed by uncorrected Fisher’s LSD test (F and L); unpaired Student’s t-test (G); One-way ANOVA followed by Tukey’s multiple comparisons test (I); Two-way ANOVA (K). See supplemental statistics Table file for full statistics. See also Figure S10–S14 for additional experiments related to Figure 4.

References

    1. Dupuis JP, Nicole O, and Groc L (2023). NMDA receptor functions in health and disease: Old actor, new dimensions. Neuron, S0896–6273(23)00344–6. 10.1016/j.neuron.2023.05.002. - DOI - PubMed
    1. Lüscher C, and Malenka RC (2012). NMDA receptor-dependent long-term potentiation and long-term depression (LTP/LTD). Cold Spring Harb Perspect Biol 4, a005710. 10.1101/cshperspect.a005710. - DOI - PMC - PubMed
    1. Paoletti P, Bellone C, and Zhou Q (2013). NMDA receptor subunit diversity: impact on receptor properties, synaptic plasticity and disease. Nat. Rev. Neurosci 14, 383–400. 10.1038/nrn3504. - DOI - PubMed
    1. Hansen KB, Yi F, Perszyk RE, Furukawa H, Wollmuth LP, Gibb AJ, and Traynelis SF (2018). Structure, function, and allosteric modulation of NMDA receptors. Journal of General Physiology 150, 1081–1105. 10.1085/jgp.201812032. - DOI - PMC - PubMed
    1. Dore K, Stein IS, Brock JA, Castillo PE, Zito K, and Sjöström PJ (2017). Unconventional NMDA Receptor Signaling. J Neurosci 37, 10800–10807. 10.1523/JNEUROSCI.1825-17.2017. - DOI - PMC - PubMed

Substances

LinkOut - more resources