Comment
. 2024 Jul 9;57(7):1696-1709.e10.
doi: 10.1016/j.immuni.2024.05.017. Epub 2024 Jun 14.

The brain microvasculature is a primary mediator of interferon-α neurotoxicity in human cerebral interferonopathies

Affiliations
Comment

The brain microvasculature is a primary mediator of interferon-α neurotoxicity in human cerebral interferonopathies

Barney Viengkhou et al. Immunity. .

Abstract

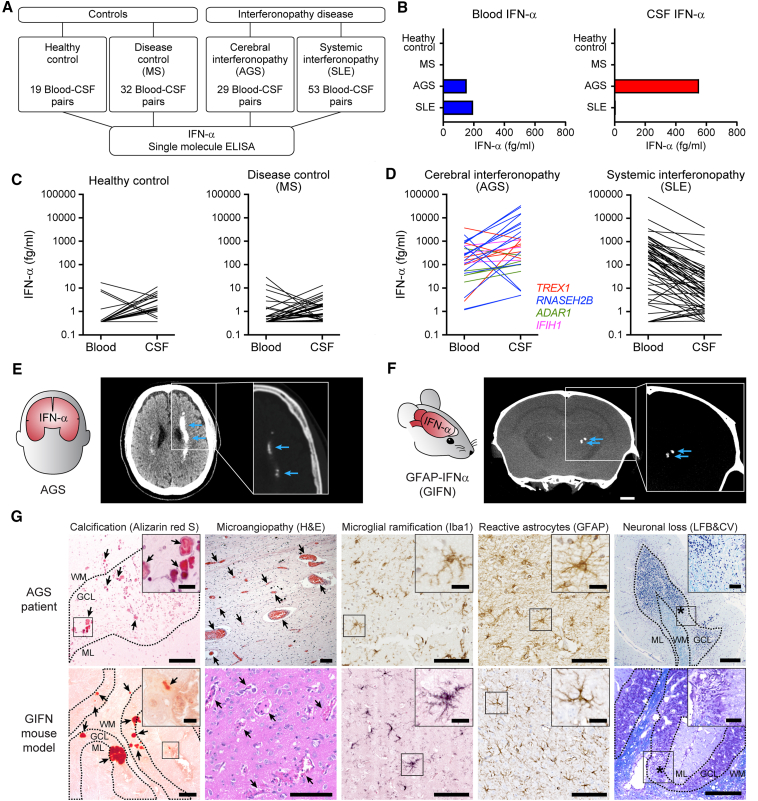
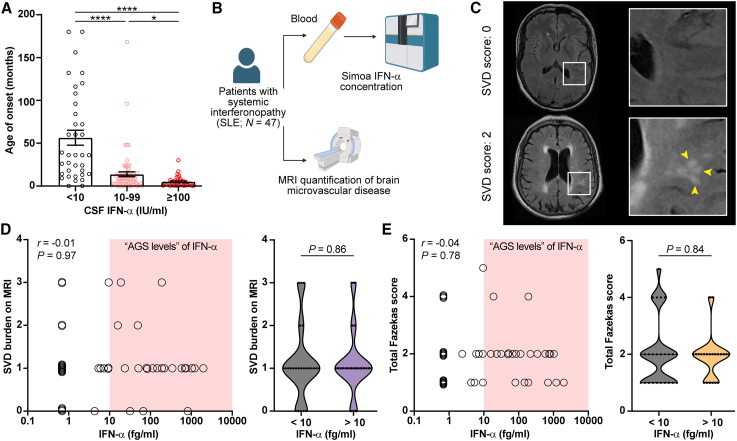
Aicardi-Goutières syndrome (AGS) is an autoinflammatory disease characterized by aberrant interferon (IFN)-α production. The major cause of morbidity in AGS is brain disease, yet the primary source and target of neurotoxic IFN-α remain unclear. Here, we demonstrated that the brain was the primary source of neurotoxic IFN-α in AGS and confirmed the neurotoxicity of intracerebral IFN-α using astrocyte-driven Ifna1 misexpression in mice. Using single-cell RNA sequencing, we demonstrated that intracerebral IFN-α-activated receptor (IFNAR) signaling within cerebral endothelial cells caused a distinctive cerebral small vessel disease similar to that observed in individuals with AGS. Magnetic resonance imaging (MRI) and single-molecule ELISA revealed that central and not peripheral IFN-α was the primary determinant of microvascular disease in humans. Ablation of endothelial Ifnar1 in mice rescued microvascular disease, stopped the development of diffuse brain disease, and prolonged lifespan. These results identify the cerebral microvasculature as a primary mediator of IFN-α neurotoxicity in AGS, representing an accessible target for therapeutic intervention.

Keywords: Aicardi-Goutières syndrome; blood-brain barrier; cerebral interferonopathy; endothelial; interferon-alpha; microangiopathy; neuroinflammation; neurotoxicity; small vessel disease.


Conflict of interest statement

Declaration of interests I.L.C. and M.J.H. received funding from Ionis Pharmaceuticals for experiments in an unrelated study using the GIFN mice.

Figures

None
Graphical abstract
Figure 1
Figure 1
Neurotoxic interferon-alpha production in AGS is derived from an intracerebral source (A) Overview of the systematic analysis of 133 paired serum-CSF IFN-α concentrations measured by Simoa in 51 control pairs (healthy controls and multiple sclerosis [MS], a non-interferonopathic disease) and 82 interferonopathic disease pairs (AGS and SLE, including cases from Lodi et al. and Varley et al.9). (B–D) Median (B) and individual concentrations (C and D) of IFN-α from blood and CSF (each line represents paired data) were determined by Simoa. (D) CSF concentrations are significantly higher than serum in individuals with AGS (p = 0.005, two-tailed paired Wilcoxon test). Serum IFN-α concentrations are significantly higher in serum than CSF in individuals with SLE (p < 0.0001, two-tailed paired Wilcoxon test). Data from 133 blood-CSF pairs. (E) Computed tomography (CT) brain image from an individual with AGS showing bilateral calcification, a feature which is typically seen in AGS brain imaging (blue arrows; inset is of a bone window, with calcification shown at the same signal as skull bone). (F) Micro-CT of the head of a GIFN mouse infused with contrast, revealing bilateral intracerebral calcification (blue arrows; z-projection of 0.5 mm; scale bars, 1 mm). Inset is of a bone window. Representative image from n = 2 mice at 24 weeks of age from two independent experiments. (G) Calcification (Alizarin red S stain, arrows point at calcium deposits; scale bars, 100 μm; scale bars inset, 20 μm), microangiopathy with enlarged capillaries (H&E stain, arrows point at enlarged blood vessels; scale bars, 100 μm), activation and hyper-ramification of microglia (Iba1 immunohistochemistry; scale bars, 100 μm; scale bars inset, 20 μm), reactive astrocytosis (glial fibrillary acidic protein [GFAP] immunohistochemistry; scale bars, 100 μm; scale bars inset, 20 μm) and neurodegeneration (Luxol fast blue and cresyl violet [LFB&CV] stain; asterisk: near total loss of granule cell neurons; scale bars, 250 μm; scale bars inset, 50 μm) within the brain parenchyma of a individual with AGS due to TREX1 mutation (c.598G>A p.Asp200Asn het) and in the brain of GIFN mice (representative from n = 5 mice at 16–24 weeks of age). GCL, granule cell layer; WM, white matter; ML, molecular layer. Representative images are from two independent experiments. See also Tables S1 and S4A.
Figure 2
Figure 2
Endothelial cells are intracerebral targets of IFN-α (A) Single-cell RNA sequencing was done on isolated cells from pooled forebrains of WT and GIFN mice. Cells were clustered and assigned an identity, which allowed for transcriptomic comparison between the two genotypes. Dashed arrows indicate shift in endothelial cells and microglia between WT and GIFN mice (genotype-separated UMAP plots shown in Figure S1C). (B) Average counts of Ifnar1 in various cell types and between genotypes. (C) UMAP plot with counts of Mx1 shown. Endothelial cells and microglia clusters are outlined. (D) Volcano plot of genes from endothelial cells and microglia. Dotted lines indicate threshold for significance (adj. p ≤ 0.05) and fold change (|fold change| ≥ 2). Venn diagram of upregulated genes. (A–D) Data from one experiment. See also Figure S1 and Table S2A.
Figure 3
Figure 3
Type I interferon signaling in endothelial cells causes a distinctive cerebral microangiopathy (A) Transcript counts of endothelial activation markers (Vcam1), chemokines (Cxcl10), and MHC class I (H2-K1) in endothelial cells between WT and GIFN mice (scRNA-seq on CD31-enriched cells). (B) Pathway analyses of significantly regulated genes and associated predicted activity scores are shown. Dashed line: significance threshold. (C) Immunohistochemical staining for the endothelial activation marker ICAM1, CD3-positive T cells (arrowheads indicate T cells), and MHC class I (n = 4 per genotype at 16 weeks of age; scale bars, 20 μm). Representative images from two independent experiments. (D) Laminin staining of passively cleared cerebral cortices. Abnormal microvasculature in GIFN mice with enlarged capillaries and microaneurysms (scale bars, 100 μm; n = 4 per genotype at 16 weeks of age). Representative images from two independent experiments. (E) Evans blue and fluorescein injected into WT and GIFN mice. Perfused brain photographed before sectioning (n = 4 per genotype at 16 weeks of age; black lines are 1 cm apart and bisected by gray lines) and imaging for Evans blue fluorescence of the cortex and cerebellum (scale bars, 100 μm). Representative image from two independent experiments. (A and B) Data from one experiment. See also Figure S2 and Table S2B.
Figure 4
Figure 4
Distinctive features of interferon cerebral microangiopathy are observed in individuals with AGS (A and B) Activated and dysmorphic capillaries in microangiopathy (vessel lumen indicated by asterisks and capillary indicated by arrowheads; scale bars, 20 μm) are associated with perivascular T cell infiltrates (indicated by arrowheads; scale bars, 50 μm), perivascular calcification (indicated by arrowheads; scale bars, 100 μm), changes to capillary caliber, and aneurysm formation (aneurysm neck indicated by asterisks and aneurysm outpouching indicated by arrowheads; vascular cast: scale bars, 50 μm; angiogram: scale bars, 5 mm). Representative immunohistochemistry images from two independent studies and one study for the cast and angiogram.
Figure 5
Figure 5
Cerebral microangiopathy in AGS is primarily driven by IFN-α of CNS origin rather than peripheral blood origin (A) Analysis of CSF IFN-α activity and disease severity indicated by time to onset of disease (specifically, time of diagnostic lumbar puncture) in a large cohort of individuals with AGS. Stratified data with Kruskal-Wallis test. p < 0.05 and ∗∗∗∗p < 0.0001. (B) Overview of MRI study. Forty-seven individuals with SLE underwent paired IFN-α Simoa and MRI of the brain to quantify cerebral small vessel disease. (C) Representative MRI brain images of two individuals with SLE illustrating appearances of small vessel disease. Top image: no SVD present (SVD score = 0) and lower image (SVD score = 2): hyperintensities are seen in the white matter, reflecting small vessel disease (yellow arrowheads). Representative images from 47 individuals with SLE. (D and E) Correlation plots between serum IFN-α concentrations and SVD burden score or Fazekas score (n = 47 individuals with SLE). Red box highlights concentration typically observed in AGS (>10 fg/mL; n = 22). Correlation analyzed with Spearman’s rank correlation and stratified data with two-tailed Mann-Whitney U test.
Figure 6
Figure 6
Endothelial deletion of IFNAR1 reverses cerebral microangiopathy in GIFN mice (A) Immunohistochemistry for endothelial activation marker ICAM1, CD3-positive T cells (arrowheads), and MHC class I immunostaining (n = 4 per genotype at 16 weeks of age; scale bars, 30 μm). Representative images from two independent experiments. (B) Laminin-stained passively cleared cortices. Abnormal microvasculature in GIFN-FL mice with enlarged capillaries and microaneurysms (n = 4 per genotype at 16 weeks of age; scale bars, 30 μm; asterisks: aneurysm). Representative images from two independent experiments. (C) Violin plot (median and interquartile range indicated) of cortical vascular segments (portions between vascular branches). (A–D) Representative images of traced vascular segments at indicated segment diameters. Scale bars, 20 μm. (D) Average vascular segment diameter. (E) Average vascular length. (F) Average vascular volume. (G) Binned distribution of vascular segment volume. (H) Mice were injected intraperitoneally (i.p.) with Evans blue, with overnight circulation, followed by fluorescein injection, and then perfused after 30 min. Evans blue and fluorescein permeate a leaky brain (n = 5 for WT-FL and GIT and 4 for GIFN-FL at 16 weeks of age; black lines are 1 cm apart and bisected by gray lines). (I) Fluorescent images of brain sections for Evans blue revealing the spatial leakage in different brain regions. Red arrowhead: calcification; scale bars, 100 μm. (J) Quantification of Evans blue and fluorescein extracted from the cerebellum and forebrain and detected by fluorescence spectroscopy. No comparisons were made between brain regions or between dyes. Quantification was one experiment from samples collected from more than three independent experiments. (D–F and J) Each point is a mouse. Mean ± SEM. are shown, unless otherwise stated. Statistical comparisons were performed using one-way ANOVA with Tukey's post-test. ∗∗p < 0.01, ∗∗∗p < 0.001, and ∗∗∗∗p < 0.0001. (C–G) Pooled data from two independent experiments. (H and I) Representative images from over three independent experiments. See also Figure S3 and Video S1.
Figure 7
Figure 7
Endothelial deletion of IFNAR1 prevents the development of extravascular disease and prolongs survival of GIFN mice (A) Top row: hematoxylin and eosin stain of the cerebellum with neuronal loss in the granule cell layer (GCL), vacuolation in the white matter (WM), and enlarged vessels/aneurysms (asterisks) observable in GIFN-FL mice (scale bars, 100 μm; ML, molecular layer). Middle row: neurofilament immunohistochemistry shows Purkinje neurons (arrowheads) and their absence in GIFN-FL mice (asterisk; scale bars, 30 μm). Bottom row: calcification in the GCL revealed with alizarin red S only in GIFN-FL mice (arrow: clustered calcified deposits in the GCL; scale bars, 100 μm; n = 4 per genotype at 16 weeks of age). Representative images from two independent experiments. (B) Gross motor coordination tested by rotarod (n = 15 for WT-FL, 16 for GIFN-FL, and 18 for GIT; repeated measures linear mixed-effects models with Tukey’s post-test; points represent individual animals; and error bars represent mean ± SEM). Data pooled from more than three independent experiments. (C) Expression of type I interferon-stimulated genes in the cerebella detected by qPCR (n = 5 for WT-FL and GIFN-FL and 7 for GIT at 16 weeks of age; one-way ANOVA with Tukey's post-test). Points represent individual animals, and error bars represent mean ± SEM. Quantification was one experiment from sample collected from more than three independent experiments. (D) Immunoblots for type I interferon signaling in the cerebella based on STAT1 activation (n = 4–5 for WT-FL and GIFN-FL and 7 for GIT at 16 weeks of age). Quantification was one experiment from samples collected from more than three independent experiments. (E) Survival analysis of GIT mice and littermate controls (total n = 70 for WT-FL, 67 for GIFN-FL, and 86 for GIT mice). Significance determined by log-rank test with Benjamini-Hochberg post-test. Data pooled from more than three independent experiments. p < 0.05, ∗∗p < 0.01, ∗∗∗p < 0.001, and ∗∗∗∗p < 0.0001. See also Figures S4–S6 and Video S2.

Comment on

References

    1. Crow Y.J., Chase D.S., Lowenstein Schmidt J., Szynkiewicz M., Forte G.M.A., Gornall H.L., Oojageer A., Anderson B., Pizzino A., Helman G., et al. Characterization of human disease phenotypes associated with mutations in TREX1, RNASEH2A, RNASEH2B, RNASEH2C, SAMHD1, ADAR, and IFIH1. Am. J. Med. Genet. A. 2015;167A:296–312. doi: 10.1002/ajmg.a.36887. - DOI - PMC - PubMed
    1. Uggenti C., Lepelley A., Depp M., Badrock A.P., Rodero M.P., El-Daher M.T., Rice G.I., Dhir S., Wheeler A.P., Dhir A., et al. cGAS-mediated induction of type I interferon due to inborn errors of histone pre-mRNA processing. Nat. Genet. 2020;52:1364–1372. doi: 10.1038/s41588-020-00737-3. - DOI - PubMed
    1. Crow Y.J., Shetty J., Livingston J.H. Treatments in Aicardi-Goutières syndrome. Dev. Med. Child Neurol. 2020;62:42–47. doi: 10.1111/dmcn.14268. - DOI - PubMed
    1. Rodero M.P., Decalf J., Bondet V., Hunt D., Rice G.I., Werneke S., McGlasson S.L., Alyanakian M.A., Bader-Meunier B., Barnerias C., et al. Detection of interferon alpha protein reveals differential levels and cellular sources in disease. J. Exp. Med. 2017;214:1547–1555. doi: 10.1084/jem.20161451. - DOI - PMC - PubMed
    1. Rice G.I., Forte G.M.A., Szynkiewicz M., Chase D.S., Aeby A., Abdel-Hamid M.S., Ackroyd S., Allcock R., Bailey K.M., Balottin U., et al. Assessment of interferon-related biomarkers in Aicardi-Goutières syndrome associated with mutations in TREX1, RNASEH2A, RNASEH2B, RNASEH2C, SAMHD1, and ADAR: a case-control study. Lancet Neurol. 2013;12:1159–1169. doi: 10.1016/S1474-4422(13)70258-8. - DOI - PMC - PubMed

Publication types

Substances

Supplementary concepts