. 2024 Jul 25;187(15):4061-4077.e17.
doi: 10.1016/j.cell.2024.05.034. Epub 2024 Jun 14.

NLRC5 senses NAD+ depletion, forming a PANoptosome and driving PANoptosis and inflammation

Affiliations

NLRC5 senses NAD+ depletion, forming a PANoptosome and driving PANoptosis and inflammation

Balamurugan Sundaram et al. Cell. .

Abstract

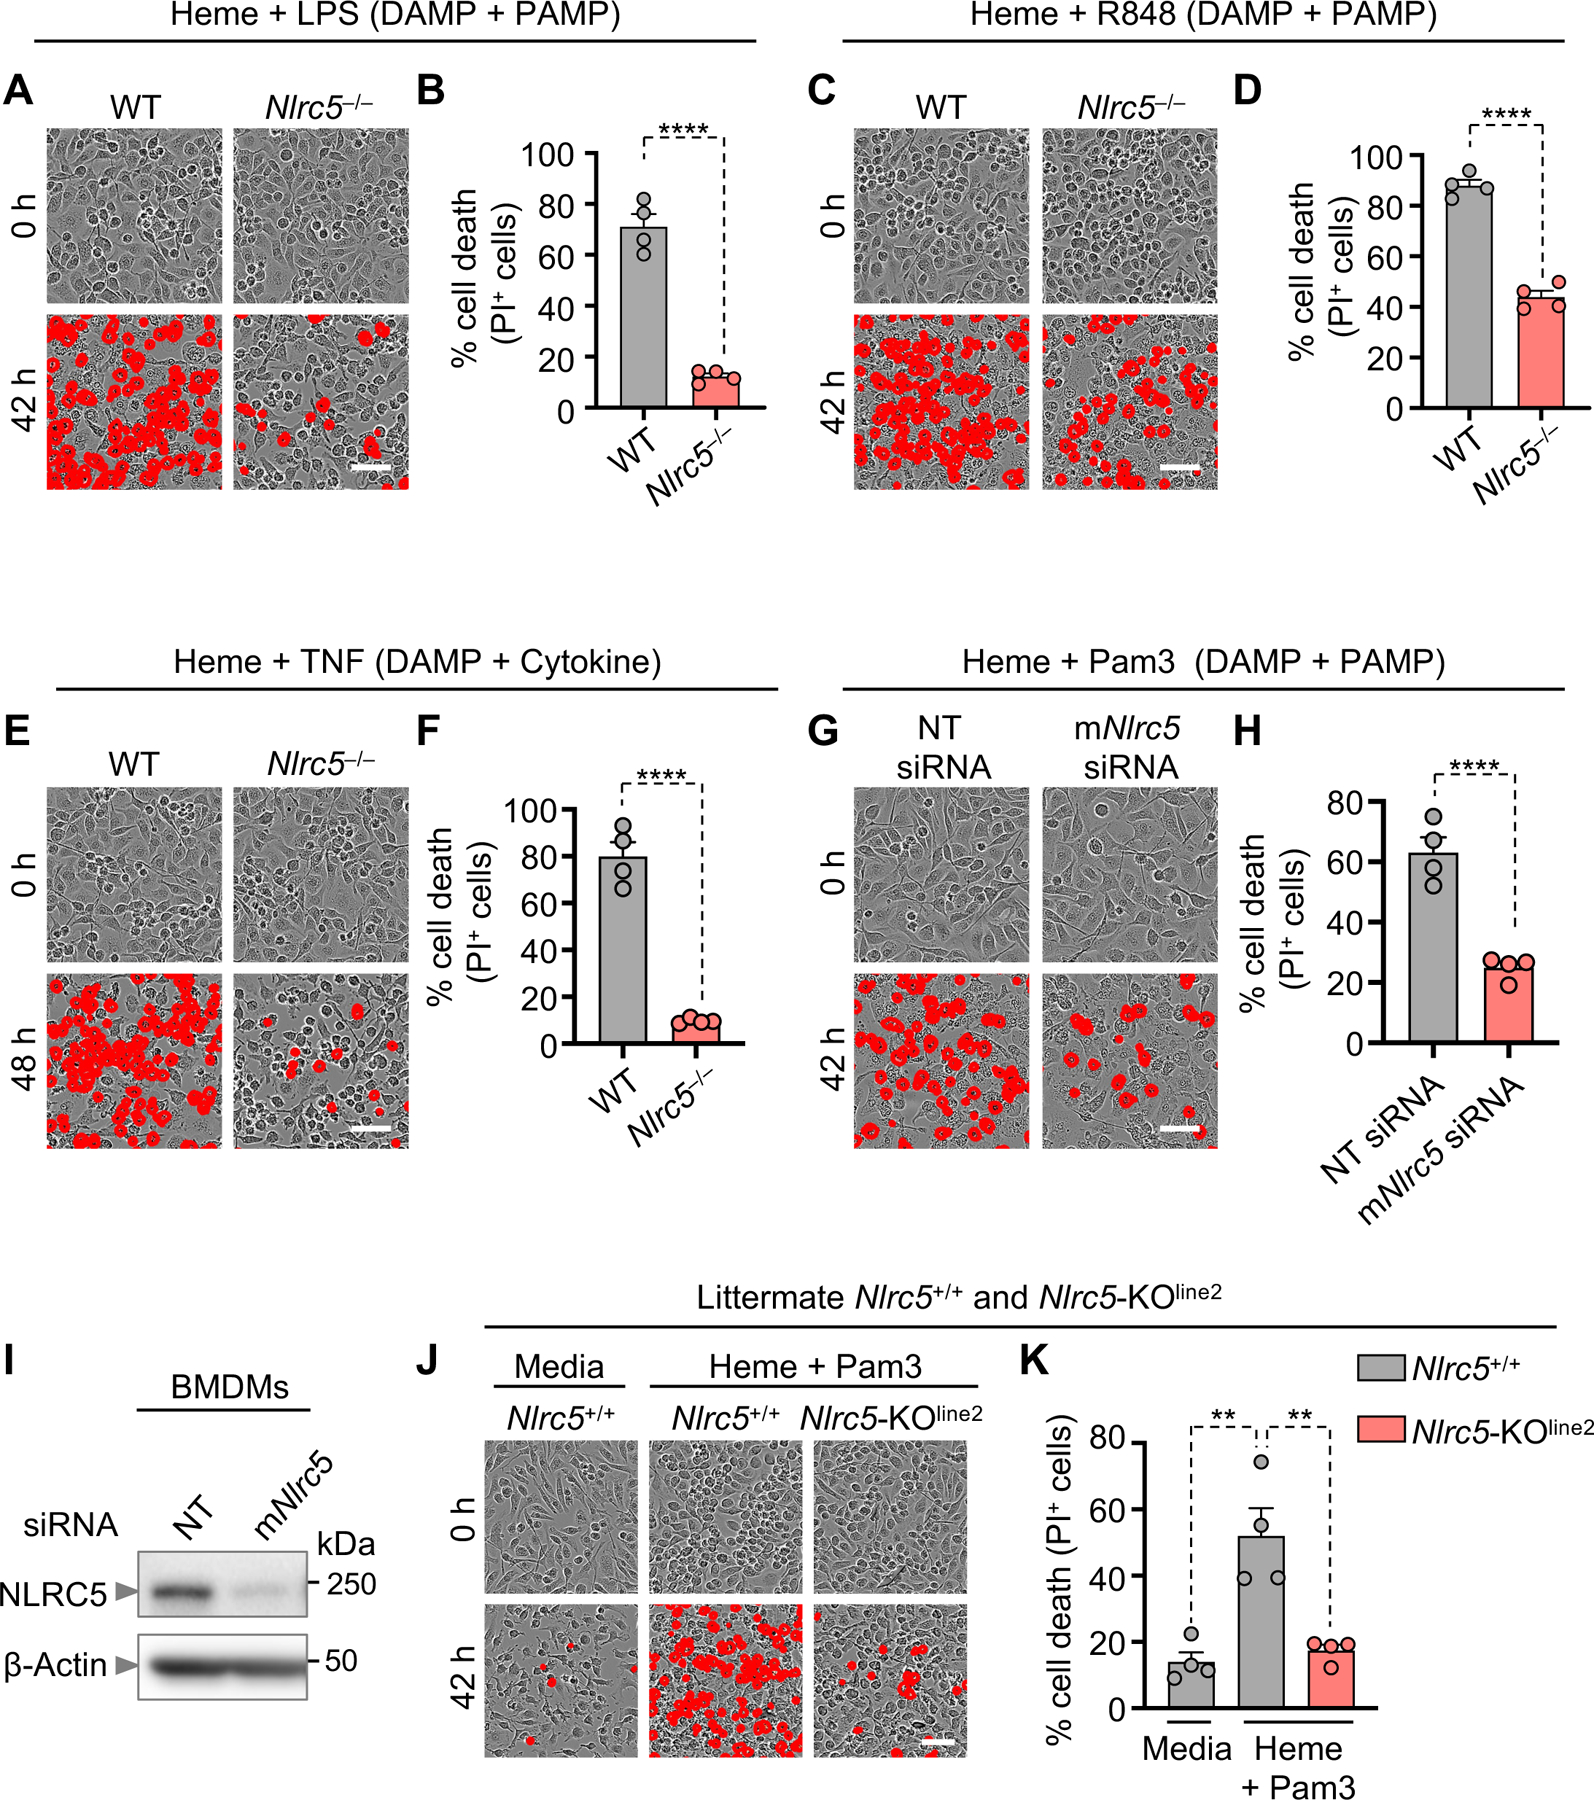
NLRs constitute a large, highly conserved family of cytosolic pattern recognition receptors that are central to health and disease, making them key therapeutic targets. NLRC5 is an enigmatic NLR with mutations associated with inflammatory and infectious diseases, but little is known about its function as an innate immune sensor and cell death regulator. Therefore, we screened for NLRC5's role in response to infections, PAMPs, DAMPs, and cytokines. We identified that NLRC5 acts as an innate immune sensor to drive inflammatory cell death, PANoptosis, in response to specific ligands, including PAMP/heme and heme/cytokine combinations. NLRC5 interacted with NLRP12 and PANoptosome components to form a cell death complex, suggesting an NLR network forms similar to those in plants. Mechanistically, TLR signaling and NAD+ levels regulated NLRC5 expression and ROS production to control cell death. Furthermore, NLRC5-deficient mice were protected in hemolytic and inflammatory models, suggesting that NLRC5 could be a potential therapeutic target.

Keywords: ASC; DAMP; NLRC5; NLRP12; NLRP3; PAMP; PANoptosis; RIPK3; ROS; TLRs; TNF; apoptosis; caspase; colitis; heme; hemophagocytic lymphohistiocytosis; inflammasome; inflammatory cell death; necroptosis; pyroptosis.


Conflict of interest statement

Declaration of interests St. Jude Children’s Research Hospital filed a provisional patent application on methods for modulating NLRP12 and NLRC5 described in this study, listing B.S. and T.-D.K. as inventors (serial no. 63/501,430). The PCT application was published with the World Intellectual Property Organization (WO 2024/097571 A1).

Figures

Figure 1.
Figure 1.. NLRC5 mediates inflammatory cell death in response to heme plus PAMP or heme plus cytokine triggers
(A and B) Cell death images (A) and quantification of cell death (B) using wild-type (WT) and Nlrc5−/− bone marrow-derived macrophages (BMDMs) in response to heme plus lipopolysaccharide (LPS) treatment for 42 h. (C and D) Cell death images (C) and quantification of cell death (D) using WT and Nlrc5−/− BMDMs stimulated with heme plus Resiquimod (R848) for 42 h. (E and F) Cell death images (E) and quantification of cell death (F) using WT and Nlrc5−/− BMDMs treated with heme plus TNF for 48 h. (G and H) Cell death images (G) and quantification of cell death (H) using BMDMs electroporated with control (non-targeting, NT) siRNA or mouse Nlrc5-targeting siRNA, then treated with heme and Pam3CSK4 (Pam3) for 42 h. (I) Western blot analysis of NLRC5 expression in BMDMs electroporated with control or mouse Nlrc5-targeting siRNA. For loading control, β-actin is shown. (J and K) Cell death images (J) and quantification of cell death (K) in littermate Nlrc5+/+ and Nlrc5-KOline2 BMDMs treated with heme plus Pam3 for 42 h. Scale bar = 50 μm (A, C, E, G, and J). Nlrc5−/− BMDMs (ref. ) (A–F) and Nlrc5-KOline2 BMDMs (J and K) were used for stimulation. Three or more independent experiments were performed, and the data shown are from a single experiment that is representative. Mean ± SEM are shown (B, D, F, H, and K). Statistical analyses were performed using the unpaired t test (B, D, F, and H) or the one-way ANOVA (K). **P < 0.01; ****P < 0.0001. See also Figures S1, S2, and S3.
Figure 2.
Figure 2.. NLRC5 regulates inflammatory cell death in response to heme plus PAMPs
(A–C) Western blot analysis of (A) pro- and activated caspase-1 (CASP1; P45 and P20, respectively); pro-, activated, and inactivated gasdermin D (GSDMD; P53, P30, and P20, respectively); and pro- and activated gasdermin E (GSDME; P53 and P34, respectively); (B) pro- and cleaved caspase-8 (CASP8; P55 and P18, respectively); pro- and cleaved caspase-3 (CASP3; P35 and P19/P17, respectively); pro- and cleaved caspase-7 (CASP7; P35 and P20, respectively); and (C) phosphorylated and total MLKL (p-MLKL and t-MLKL) in wild-type (WT) and Nlrc5−/− bone marrow-derived macrophages (BMDMs) at 0 h or following treatment with heme plus Pam3CSK4 (Pam3) for 36 h. For loading control, β-actin is shown. (D and E) Cell death images (D) and quantification of cell death (E) using WT, Nlrc5−/−, Nlrp12−/−, and Nlrc5−/−Nlrp12−/− (DKO) BMDMs in response to heme plus Pam3 treatment for 42 h. (F) Western blot analysis of CASP1, GSDMD, GSDME, CASP8, CASP3, CASP7, p-MLKL, and t-MLKL in WT, Nlrc5−/−, Nlrp12−/−, and DKO BMDMs at 0 h or following treatment with heme plus Pam3 for 36 h. For loading control, β-actin is shown. (G) Measurement of IL-1β release in the supernatant of WT, Nlrc5−/−, Nlrp12−/−, and DKO BMDMs following treatment with heme plus Pam3 for 36 h or 42 h. Scale bar = 50 μm (D). Nlrc5−/− BMDMs (ref. ) (A–G) were used for stimulation. Three or more independent experiments were performed, and the data shown are from a single experiment that is representative. Mean ± SEM are shown (E and G). Statistical analyses were performed using the one-way ANOVA (E) or the two-way ANOVA (G). ns, not significant; **P < 0.01; ****P < 0.0001. See also Figure S4.
Figure 3.
Figure 3.. NLRC5 interacts with NLRP12 to form a multiprotein cell death-inducing complex
(A) Wild-type (WT) and Nlrc5−/− bone marrow-derived macrophages (BMDMs) were either left unstimulated (0 h) or treated with heme plus Pam3CSK4 (Pam3) for 36 h and stained for NLRC5, and counter-stained with DAPI to visualize nuclei. A broader, enlarged field of view for WT BMDMs at the 36 h timepoint is shown. (B) Western blot analysis of NLRC5 in WT BMDMs stimulated with heme plus Pam3 for the indicated times. For loading control, β-actin is shown. (C) WT and Nlrc5−/− BMDMs were either unstimulated (0 h) or treated with heme plus Pam3 for 36 h and stained for NLRC5, ASC, caspase-8 (CASP8), and RIPK3, and counter-stained with DAPI to visualize nuclei. Representative images of cells containing co-localized NLRC5, ASC, CASP8, and RIPK3 are shown. The magnified view of the boxed area (merged) is shown on the right (enlarged). (D) Quantification showing the percentage of cells with NLRC5+ASC+ CASP8+ RIPK3+ specks out of the total population of cells with ASC+ specks in WT and Nlrc5−/− BMDMs at 36 h post-stimulation with heme plus Pam3. Each data point indicates a single field of view (average n = 103 cells per field). (E) Immunoblot analysis (IB) of ASC, NLRC5, NLRP3, CASP8, and RIPK3 following immunoprecipitation (IP) with IgG control or anti-ASC antibodies in WT, Nlrp12−/−, Pycard−/−, and Nlrc5−/− BMDMs after treatment with heme plus Pam3 (H+P) for 28 h. Scale bars = 10 μm (A), 5 μm (C, merge column), and 1 μm (C, enlarged column). Nlrc5−/− BMDMs (ref. ) (A, C–E) were used for stimulation. Three or more independent experiments were performed, and the data shown are from a single experiment that is representative. Mean ± SEM are shown (D). Statistical analyses were performed using the unpaired t test (D). ****P < 0.0001. See also Figure S5.
Figure 4.
Figure 4.. Membrane-bound TLR and NAD+ signaling mediate NLRC5 expression and ROS production to modulate inflammatory cell death
(A) Western blot analysis of NLRC5 expression in wild-type (WT), Tlr2−/−, Tlr4−/−, and Tlr2−/−/Tlr4−/− (Tlr2−/−/4−/−) bone marrow-derived macrophages (BMDMs) treated with heme plus Pam3CSK4 (Pam3) for the indicated times. (B) Images representing cell death occurrences in WT, Nlrc5−/−, Tlr2−/−, Tlr4−/−, and Tlr2−/−/4−/− BMDMs at 0 h or following treatment with heme plus Pam3 for 42 h. (C and D) Images representing cell death occurrences (C) and quantification of cell death (D) in WT BMDMs at 0 h or following treatment with heme plus Pam3 with and without nicotinamide (NAM) for 42 h. (E) Western blot analysis of pro- and activated caspase-1 (CASP1; P45 and P20, respectively); pro-, activated, and inactivated gasdermin D (GSDMD; P53, P30, and P20, respectively); pro- and activated gasdermin E (GSDME; P53 and P34, respectively); pro- and cleaved caspase-8 (CASP8; P55 and P18, respectively); pro- and cleaved caspase-3 (CASP3; P35 and P19/P17, respectively); pro- and cleaved caspase-7 (CASP7; P35 and P20, respectively); phosphorylated and total MLKL (p-MLKL and t-MLKL) in WT BMDMs following treatment with heme plus Pam3 with and without NAM for the indicated times. For loading control, β-actin is shown. (F–H) Western blot analysis of NLRC5 in WT BMDMs stimulated with heme (F), Pam3 (G), or heme plus Pam3 (H) with and without NAM for the indicated times. For loading control, α-Tubulin is shown. (I) Quantification of total fluorescence intensity of cellular ROS in WT and Nlrc5−/− BMDMs in response to media alone or heme plus Pam3 treatment with and without NAC or NAM for 36 h. Scale bar = 50 μm (B and C). Nlrc5−/− BMDMs (ref. ) (B and I) were used for stimulation. Three or more independent experiments were performed, and the data shown are from a single experiment that is representative. Mean ± SEM are shown (D and I). Statistical analyses were performed using the one-way ANOVA (D and I). ns, not significant; ****P < 0.0001. See also Figure S5.
Figure 5.
Figure 5.. NLRC5 drives renal tissue damage and lethality in hemolytic disease model
(A) Survival of 8- to 10-week-old male wild-type (WT) (n = 13) and Nlrc5−/− (n = 10) mice after intraperitoneal injection of phenylhydrazine (PHZ) plus lipopolysaccharide (LPS). (B) Representative images showing hematoxylin and eosin (H&E)-stained kidney sections from WT and Nlrc5−/− mice 30 h after PBS or PHZ plus LPS injection. Outlined areas and arrows denote degenerating kidney tubular epithelium. Images are representative of n = 9 WT (PBS), n = 17 WT (PHZ + LPS), and n = 18 Nlrc5−/− (PHZ + LPS) mice. (C) Serum creatinine levels in WT and Nlrc5−/− mice injected with PBS (WT, n = 9) or PHZ plus LPS (WT, n = 17 and Nlrc5−/−, n = 18) at 30 h post-treatment. (D) Western blot analysis of NLRC5 in kidney tissue from WT mice following treatment with PBS or PHZ plus LPS at 30 h post-treatment. For loading control, α-Tubulin is shown. (E) Densitometric quantification of NLRC5 expression normalized to α-Tubulin expression from WT mice injected with PBS or PHZ plus LPS at 30 h post-treatment (PBS, n = 5; PHZ + LPS, n = 8). (F) Representative images of lipocalin 2 (LCN2) staining in kidney cortex and papilla of WT and Nlrc5−/− mice 30 h after PBS or PHZ plus LPS injection. Images are representative of n = 9 WT (PBS), n = 17 WT (PHZ + LPS), and n = 18 Nlrc5−/− (PHZ + LPS) mice. (G) Western blot analysis of LCN2; pro- and cleaved caspase-3 (CASP3; P35 and P19/P17, respectively); and pro- and cleaved caspase-7 (CASP7; P35 and P20/P17, respectively) in kidney tissue from WT and Nlrc5−/− mice treated with PBS or PHZ plus LPS at 30 h post-treatment. For loading control, β-actin is shown. (H and I) Densitometric quantification of LCN2 (H) and cleaved CASP3 and cleaved CASP7 (I) expression normalized to β-actin expression from WT and Nlrc5−/− mice treated with PBS (WT = 9) or PHZ plus LPS (WT, n = 17 and Nlrc5−/−, n = 18) at 30 h post-treatment. Scale bar = 20 μm (B and F). Mean ± SEM are shown (C, E, H, and I). Nlrc5−/− mice (ref. ) (A–C and F–I) were used for PHZ plus LPS injection. Two independent experiments were performed to assess survival, and two independent experiments were performed to assess serum parameters, histology, and cell death molecule activation. Pooled results are shown. Statistical analyses were performed using the log-rank (Mantel-Cox) test (A), the one-way ANOVA (C, H, and I), or the unpaired t test (E). *P < 0.05; **P < 0.01; ****P < 0.0001. See also Figure S6.
Figure 6.
Figure 6.. NLRC5 drives colon inflammation and pathogenesis in a colitis model
(A–B) Wild-type (WT) (n = 17) and Nlrc5−/− (n = 9) mice were treated with 4.5% dextran sodium sulfate (DSS) in drinking water for 6 days. Body weight (A) and survival (B) were monitored until day 7. (C and D) Images showing representative colon length (C) and measurements of colon length (D) from WT (n = 15) and Nlrc5−/− (n = 9) mice on day 7 after DSS administration. (E) Representative images showing hematoxylin and eosin (H&E)-stained colon sections from WT and Nlrc5−/− mice on day 7 after DSS administration. Dotted lines denote the ulcerated areas. Images are representative of n = 15 WT and n = 9 Nlrc5−/− mice. (F–J) Quantification of histological scores for inflammation (F), ulceration (G), edema (H), mucosal hyperplasia (I), and extent of lesions (J) from WT and Nlrc5−/− mice on day 7 after DSS administration. (K) Western blot analysis of NLRC5 in kidney tissues from WT mice on day 7 after PBS or DSS treatment. For loading control, β-actin is shown. (L) Densitometric quantification of NLRC5 expression normalized to β-actin expression from WT mice on day 7 after PBS (n = 3) or DSS treatment (n = 11 mice). Mean ± SEM are shown (A, D, F–J, and L). Scale bar = 2 mm (E). Nlrc5−/− mice (ref. ) (A–J) were used for DSS treatment. Two independent experiments were performed to assess body weight, survival, and histology. Pooled results are shown. Statistical analyses were performed using the two-way ANOVA (A), log-rank (Mantel-Cox) test (B), or unpaired t test (D, F–J, and L). ns, not significant; *P < 0.05; **P < 0.01; ***P < 0.001; ****P < 0.0001. See also Figure S6.

References

    1. Kanneganti TD (2020). Intracellular innate immune receptors: Life inside the cell. Immunol Rev 297, 5–12. 10.1111/imr.12912. - DOI - PMC - PubMed
    1. Harton JA, Linhoff MW, Zhang J, and Ting JP (2002). Cutting edge: CATERPILLER: a large family of mammalian genes containing CARD, pyrin, nucleotide-binding, and leucine-rich repeat domains. J Immunol 169, 4088–4093. - PubMed
    1. Inohara N, and Nuñez G (2003). NODs: intracellular proteins involved in inflammation and apoptosis. Nat Rev Immunol 3, 371–382. 10.1038/nri1086. - DOI - PubMed
    1. Kobayashi KS, and van den Elsen PJ (2012). NLRC5: a key regulator of MHC class I-dependent immune responses. Nat Rev Immunol 12, 813–820. 10.1038/nri3339. - DOI - PubMed
    1. Meissner TB, Li A, Biswas A, Lee KH, Liu YJ, Bayir E, Iliopoulos D, van den Elsen PJ, and Kobayashi KS (2010). NLR family member NLRC5 is a transcriptional regulator of MHC class I genes. Proc Natl Acad Sci U S A 107, 13794–13799. 10.1073/pnas.1008684107. - DOI - PMC - PubMed

MeSH terms