. 2024 Jun 15;24(1):234.
doi: 10.1186/s12906-024-04521-2.

Catechin-Induced changes in PODXL, DNMTs, and miRNA expression in Nalm6 cells: an integrated in silico and in vitro approach

Affiliations

Catechin-Induced changes in PODXL, DNMTs, and miRNA expression in Nalm6 cells: an integrated in silico and in vitro approach

Ali Afgar et al. BMC Complement Med Ther. .

Abstract

Background: This study explored the impact of predicted miRNAs on DNA methyltransferases (DNMTs) and the PODXL gene in Nalm6 cells, revealing the significance of these miRNAs in acute lymphocytic leukemia (ALL).

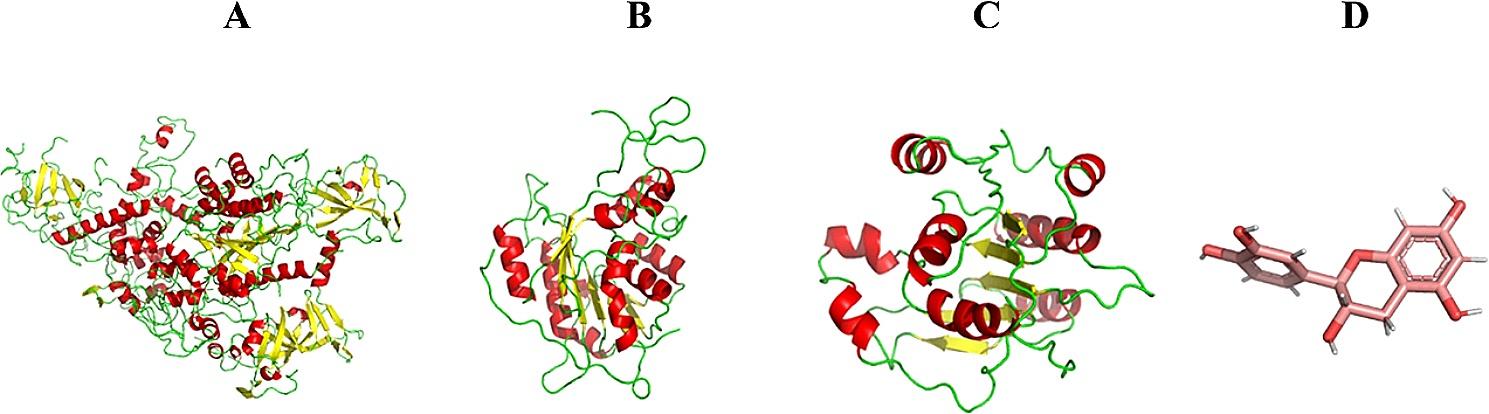
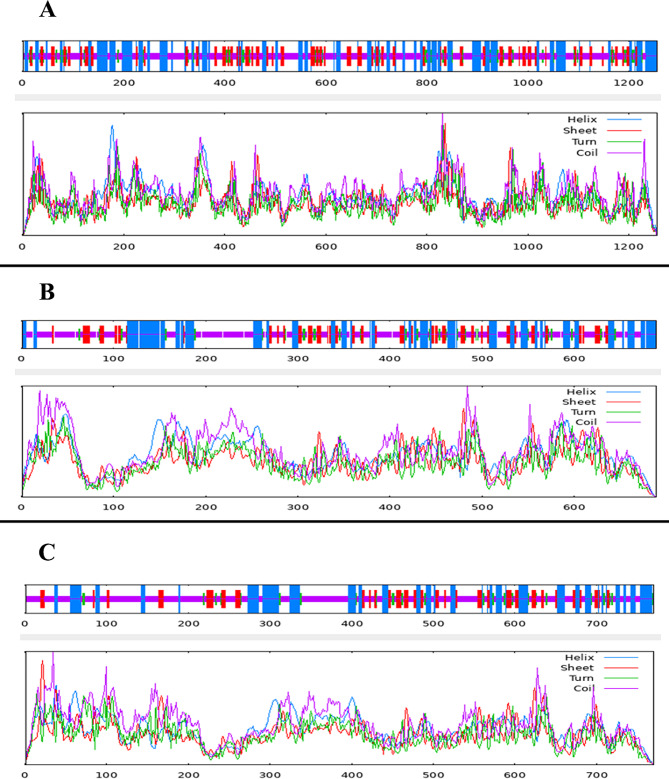
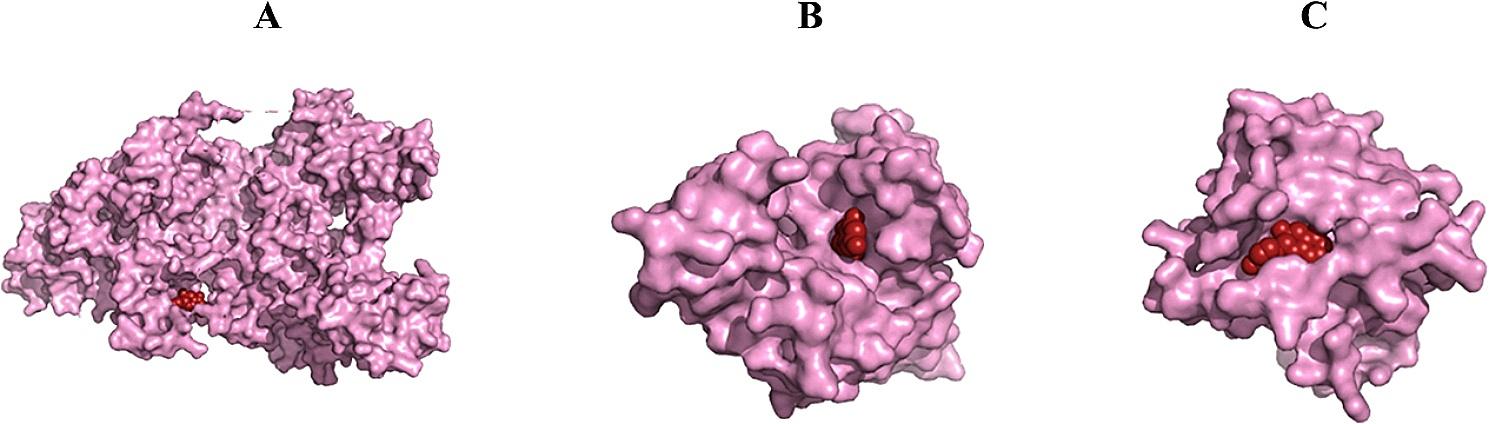
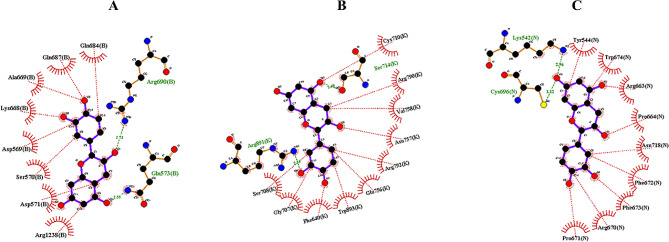
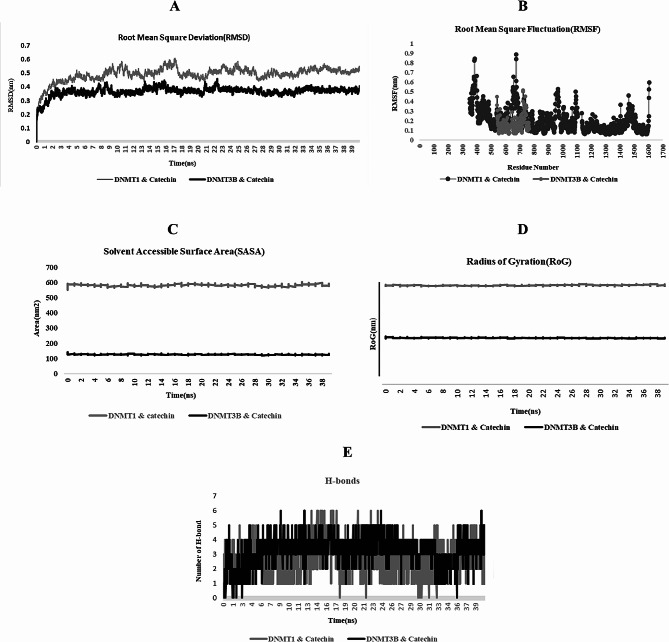
Methods: A comprehensive approach was adopted, integrating bioinformatic analyses encompassing protein structure prediction, molecular docking, dynamics, and ADMET profiling, in conjunction with evaluations of gene and miRNA expression patterns. This methodology was employed to elucidate the therapeutic potential of catechin compounds in modulating the activity of DNA methyltransferases (DNMTs) and the PODXL gene.

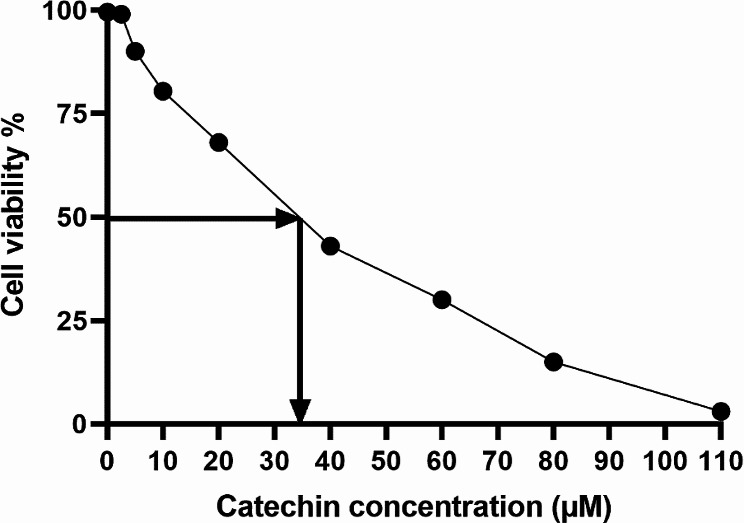
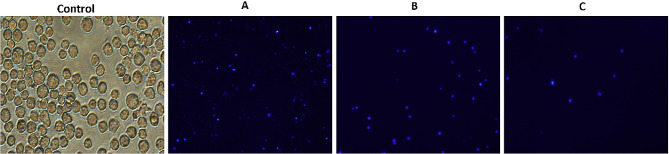
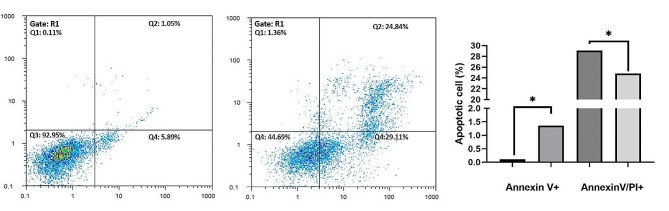
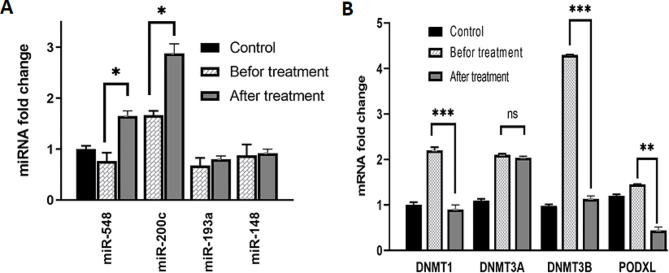
Results: The findings from our investigation indicate that catechins possess the capability to inhibit DNMT enzymes. This inhibitory effect is associated with the upregulation of microRNAs miR-200c and miR-548 and a concurrent downregulation of PODXL gene expression. These molecular interactions culminate in an augmented apoptotic response within ALL (Nalm6) cells.

Conclusion: The study posits that catechins may represent a viable therapeutic avenue for inducing apoptosis in ALL cells. This is achieved through the modulation of epigenetic mechanisms and alterations in gene expression profiles, highlighting the potential of catechins as agents for cancer therapy.

Keywords: ALL; And catechin; Docking; MD simulation; Methyltransferase; PODXL; miRNAs.


Conflict of interest statement

The authors have no conflicts of interest to declare that are relevant to the content of this article.

Figures

Fig. 1
Fig. 1
Structures of A: DNMT1, B: DNMT3A, C: DNMT3B, and D: Catechin (the structures were visualized with PyMOL software). The specific sequences for the DNMT isoforms are indexed under accession numbers NP_001124295.1, NP_072046.2, and NP_008823. Utilizing these sequences, researchers have generated several high-resolution structures. These structures are available in the Protein Data Bank (PDB) under the accession codes DNMT1 (4WXX), DNMT3A (6PA7), and DNMT3B (6KDA)
Fig. 2
Fig. 2
Secondary structure plot of A: DNMT1, B: DNMT3A, and C: DNMT3B. The structural breakdown is as follows: DNMT1: Random coils (46.50%), alpha helices (28.90%), extended strands (18.87%), and beta-turns (5.73%).DNMT3A: Random coils (46.88%), alpha helices (30.48%), extended strands (16.55%), and beta-turns (6.10%).DNMT3B: Random coils (53.25%), alpha helices (26.36%), extended strands (14.94%), and beta-turns (5.45%)
Fig. 3
Fig. 3
3D Docking of catechin with A: DNMT1, B: DNMT3A, and C: DNMT3B determined by the HDOCK server (the structures were visualized with PyMOL software). The docking procedure was executed using a genetic algorithm across 50 iterations, applying a specialized docking approach. Table 5 presents the binding energies (calculated via AutoDock4), hydrogen bond interactions, docking, and confidence scores, as well as ligand RMSD values. (sourced from the HDOCK server) for the top 10 conformations. Among these, DNMT3A exhibited the lowest binding energy, succeeded by DNMT1 and DNMT3B. Collectively, catechin demonstrated favorable binding energies with all DNMT isoforms
Fig. 4
Fig. 4
2D interactions of docking catechin with A: DNMT1, B: DNMT3A, and C: DNMT3B determined by Ligplot+.The two-dimensional interaction profiles of catechin docking with DNA methyltransferases DNMT1 (Figure A), DNMT3A (Figure B), and DNMT3B (Figure C), as analyzed by Ligplot+, reveal that catechin, the principal bioactive compound, is capable of establishing a variety of chemical interactions with these enzymes. These interactions encompass both hydrogen bonds and hydrophobic interactions. The multiplicity of bonding types signifies catechin’s capacity to influence the enzymatic functions of the DNMT proteins, suggesting its potential as a modulatory agent. (hydrophobic interactions are represented by green arcs, while hydrogen bonding interactions are represented by red dotted lines)
Fig. 5
Fig. 5
Convergence analysis of the catechin-DNMT complex MDS. Root mean square deviation (RMSD) analysis (A) showed that the complex reached a stable state approximately following 10 ns of simulation. Residue flexibility (RMSF) analysis (B): DNMT1 residues displayed high flexibility, with notable peaks at PHE676:B, LYS385:B, etc. In contrast, DNMT3B showed minimal fluctuations, suggesting greater stability. Solvent accessible surface area (SASA) analysis (C): The SASA values revealed DNMT3B (125.93 nm2) had a stronger interaction with catechin than DNMT1 (581.37 nm2), indicating a tighter binding with the compound. Compactness (Radius of gyration, Rg) analysis (D): DNMT3B exhibited a lower mean Rg deviation (1.74 nm) than DNMT1 (3.71 nm), suggesting a more compact and stable protein structure when bound to catechin. Hydrogen bonding analysis (E): The analysis showed more hydrogen bonds formed between DNMT3B and catechin, implying a stronger interaction and lower binding energy, indicative of a more stable complex
Fig. 6
Fig. 6
Catechin-induced increase in Nalm6 cell growth and IC50 concentration: Treatment of Nalm6 cells with catechin demonstrated a dose-dependent inhibition of proliferation, with concentrations varying from 0 to 110 µM. The half-maximal inhibitory concentration (IC50) of catechin was established at 35 µM after 24 h, with a 95% confidence interval between 19.5 µM and 39.94 µM. The experimental results showed a robust correlation, evidenced by an R-squared value of 0.941
Fig. 7
Fig. 7
The cytotoxicity and antiproliferative effects of different catechin concentrations (A: 10, B: 15, and C: 20 µM) on Nalm6 cells were detected via DAPI staining at ×100 magnification. Exposure to catechin at concentrations of 10, 15, and 20 µM led to a marked reduction in Nalm6 cell counts within 24 h, particularly at 20 µM. Morphological alterations, including cell aggregation and changes in nuclear size and shape, were observed. DAPI staining indicated increased intercellular distance and signs of chromatin pyknosis as catechin concentration rose. These findings suggest that catechin effectively hampers Nalm6 cell growth and proliferation
Fig. 8
Fig. 8
Effect of catechin on the induction of cell death in the Nalm6 cell line. The administered catechin groups showed a significant increase in cell apoptosis (* and **, P < 0.05). Compared to those in the untreated group, the concentrations in the catechin group exhibited a significant change of 35 µM in the quarter following the catechin intervention. Specifically, there were changes of 29.11 and 24.84 in the early and late apoptosis quadrants, respectively
Fig. 9
Fig. 9
DNMT1, DNMT3A, DNMT3B, miRNA, and PODXL expression in the Nalm6 cell line. The expression of miR-548 and miR-200c increased after treatment with catechin in Nalm6 cells, but the increase in miR-193a and miR-148a-5p was not statistically significant (A; p-value > 0.05). Treatment of Nalm6 cells with catechin led to decreased expression levels of DNMT1, DNMT3B, and PODXL compared to those in the untreated cell. However, the decrease in DNMT3A expression was not statistically significant (B; p value > 0.05)

Similar articles

References

    1. Terwilliger T, Abdul-Hay M. Acute lymphoblastic leukemia: a comprehensive review and 2017 update. Blood Cancer J. 2017;7(6):e577. doi: 10.1038/bcj.2017.53. - DOI - PMC - PubMed
    1. Bacher U, Schnittger S, Haferlach C, Haferlach T. Molecular diagnostics in acute leukemias. Clin Chem Lab Med. 2009;47(11):1333–41. doi: 10.1515/CCLM.2009.324. - DOI - PubMed
    1. Oyekunle A, Haferlach T, Kröger N, Klyuchnikov E, Zander AR, Schnittger S, et al. Molecular diagnostics, targeted therapy, and the indication for allogeneic stem cell transplantation in acute lymphoblastic leukemia. Adv Hematol. 2011;2011:154745. doi: 10.1155/2011/154745. - DOI - PMC - PubMed
    1. Doyonnas R, Nielsen JS, Chelliah S, Drew E, Hara T, Miyajima A, et al. Podocalyxin is a CD34-related marker of murine hematopoietic stem cells and embryonic erythroid cells. Blood. 2005;105(11):4170–8. doi: 10.1182/blood-2004-10-4077. - DOI - PubMed
    1. Nielsen JS, McNagny KM. The role of podocalyxin in health and disease. J Am Soc Nephrol JASN. 2009;20(8):1669–76. doi: 10.1681/ASN.2008070782. - DOI - PubMed

MeSH terms

LinkOut - more resources