. 2024 Jun 15;30(1):88.
doi: 10.1186/s10020-024-00858-z.

Modulation of anti-cardiac fibrosis immune responses by changing M2 macrophages into M1 macrophages

Affiliations

Modulation of anti-cardiac fibrosis immune responses by changing M2 macrophages into M1 macrophages

Shiqi Chen et al. Mol Med. .

Abstract

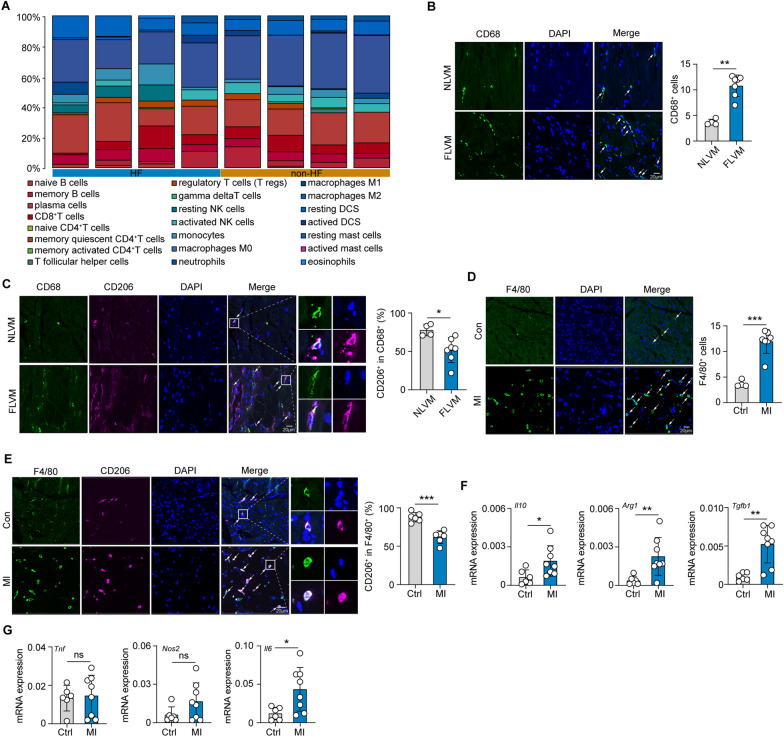
Background: Macrophages play a crucial role in the development of cardiac fibrosis (CF). Although our previous studies have shown that glycogen metabolism plays an important role in macrophage inflammatory phenotype, the role and mechanism of modifying macrophage phenotype by regulating glycogen metabolism and thereby improving CF have not been reported.

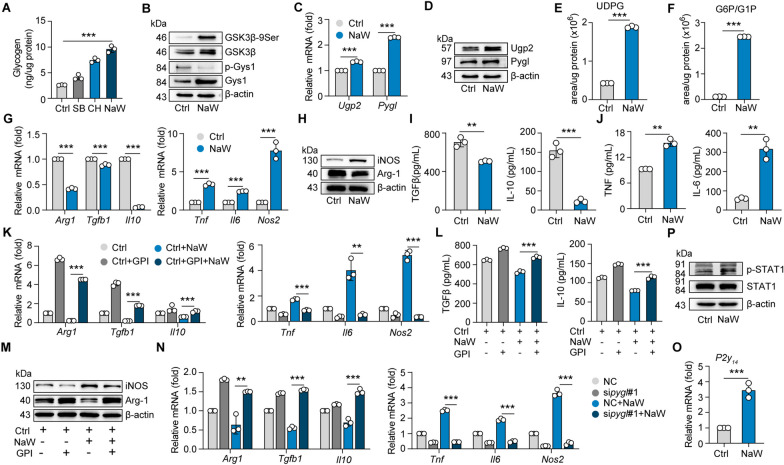
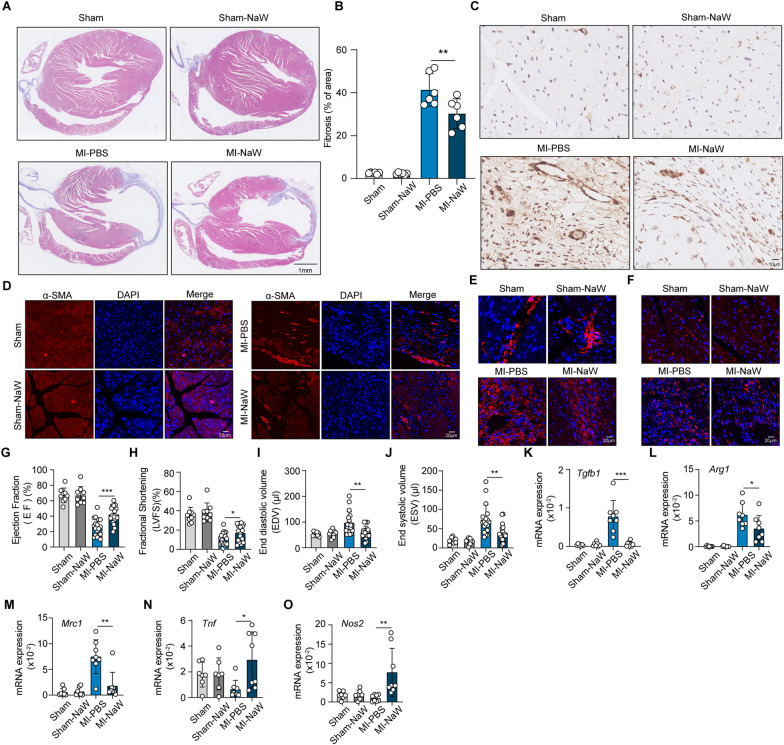
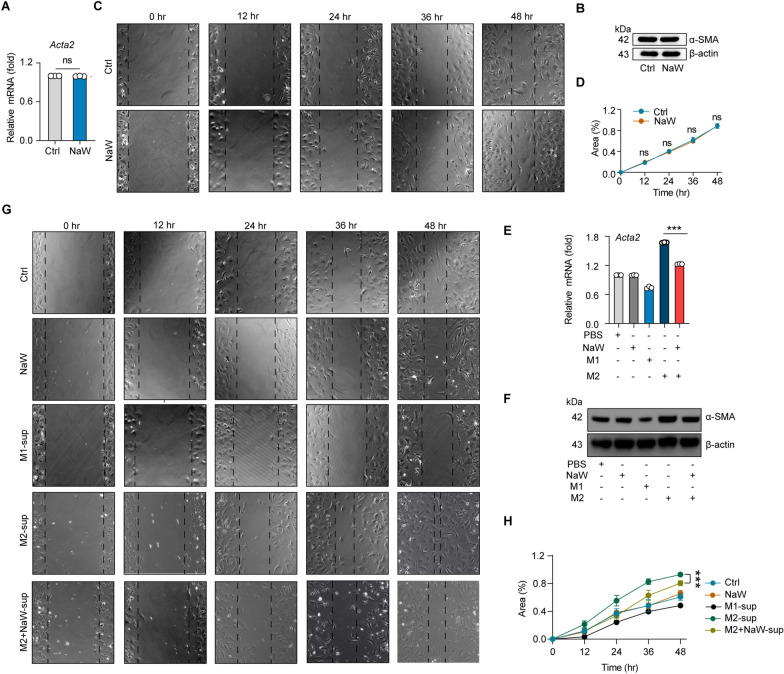
Methods: Here, we took glycogen synthetase kinase 3β (GSK3β) as the target and used its inhibitor NaW to enhance macrophage glycogen metabolism, transform M2 phenotype into anti-fibrotic M1 phenotype, inhibit fibroblast activation into myofibroblasts, and ultimately achieve the purpose of CF treatment.

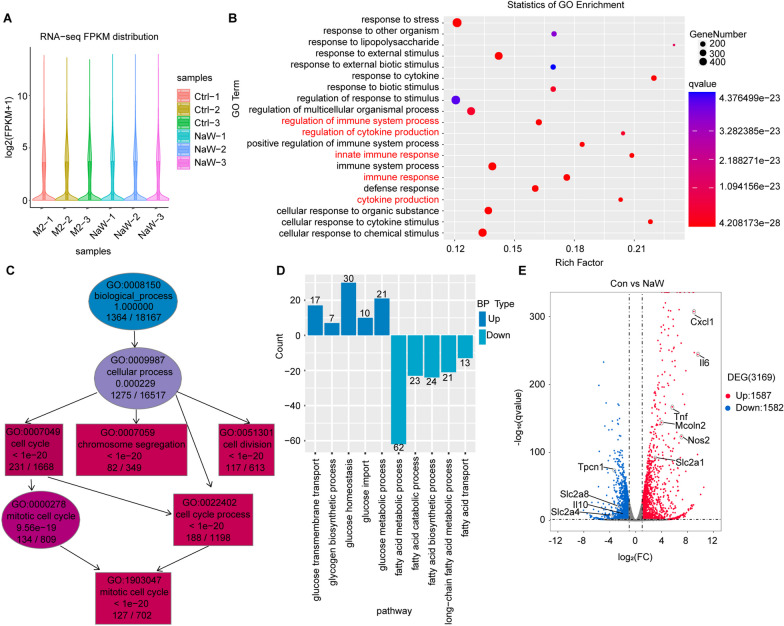
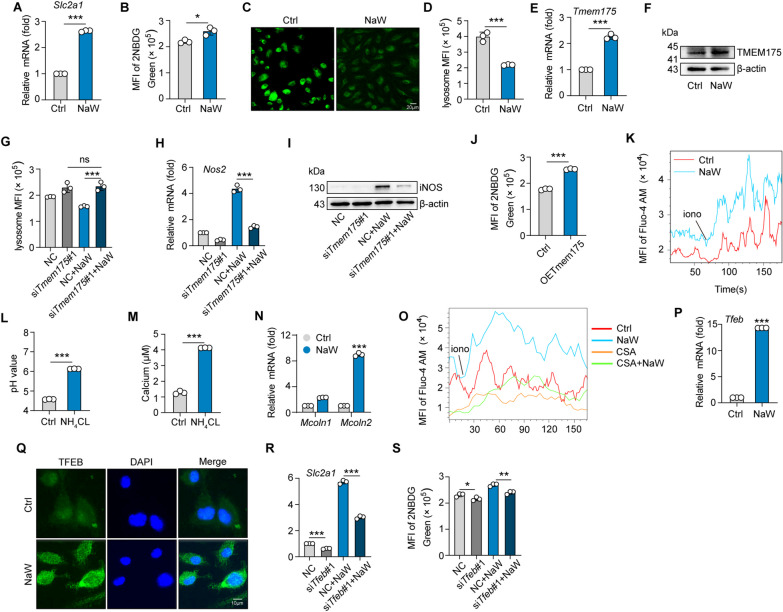
Results: NaW increases the pH of macrophage lysosome through transmembrane protein 175 (TMEM175) and caused the release of Ca2+ through the lysosomal Ca2+ channel mucolipin-2 (Mcoln2). At the same time, the released Ca2+ activates TFEB, which promotes glucose uptake by M2 and further enhances glycogen metabolism. NaW transforms the M2 phenotype into the anti-fibrotic M1 phenotype, inhibits fibroblasts from activating myofibroblasts, and ultimately achieves the purpose of treating CF.

Conclusion: Our data indicate the possibility of modifying macrophage phenotype by regulating macrophage glycogen metabolism, suggesting a potential macrophage-based immunotherapy against CF.

Keywords: Cardiac fibrosis; Glycogen; Macrophage; TMEM175.


Conflict of interest statement

The authors declare no competing interests.

Figures

Fig. 1
Fig. 1
M2 macrophages are the main macrophage type in cardiac fibrotic tissues. A Boxplots show the proportions of various types of immune cells infiltrated that infiltrated tissues from people with and without heart failure (HF). B, C Representative immunofluorescence images and quantitative analysis of CD68+ (B), CD68+ CD206+ and CD68+ CD206 (C) macrophages in human fibrotic left ventricular myocardium (FLVM) (n = 7) and normal left ventricular myocardium (NLVM) (n = 4). Green, CD68; pink, CD206; blue, DAPI. Scale bar, 20 μm. Three microscope images/sample. D, E Representative immunofluorescence images and quantitative analysis of F4/80+ (D), F4/80+ CD206+ and F4/80+ CD206 (E) macrophages in the fibrotic area of mice after MI (n = 6) and control mice (n = 6). Green, F4/80; pink, CD206; blue, DAPI. Scale bar, 20 μm. Three microscope images/sample. F, G On the 38th day after MI induction, F4/80+ macrophages were isolated from the fibrotic tissues of MI-induced (n = 8) and control (n = 6) mice, and the expression of Il10, Arg1, Tgfb1, Tnf, No2, and Il6 in macrophages was measured by real-time PCR. Unless otherwise specified, n = 3 biologically independent experiments. The data are presented as the mean ± SEM. P values were calculated by one-way ANOVA. *P < 0.05; **P < 0.01; ***P < 0.001
Fig. 2
Fig. 2
Reprogramming macrophage metabolism into that of M1 macrophages. Mouse bone marrow-derived macrophages (BMDMs) were harvested and treated with IL-4 (10 ng mL−1) for 12 h to induce M2 macrophage switching. A The levels of intracellular glycogen in M2 macrophages treated with CHIR99021:CH (3 μM), SB415286:SB (3 μM) or NaW (2 mM) were measured by colorimetric assay. B The protein levels of phosphorylated GSK3β-9Ser, GSK3β, p-Gys1 and Gys1 were measured by Western blotting. C, D The expression of Ugp2 and Pygl in M2 macrophages with or without NaW treatment was analyzed by real-time PCR (C) and (D) western blotting. E, F Liquid chromatography–tandem mass spectroscopy (LC‒MS/MS) was performed for mearing UDPG (E) and G6P/G1P (F) levels in M2 macrophages treated with or without NaW. GJ The expression of Arg1, Tgfβ1, Il10, Tnf, Il6 and Nos2 in M2 macrophages with or without NaW treatment was analyzed by real-time PCR (G). iNOS, Arg-1, TGFβ, IL-10, TNF and IL-6 levels were measured by western blotting (H) and ELISAs (I, J). KM M2 macrophages were pretreated with a glycogen phosphorylase inhibitor (GPI) for 6 h. The expression levels of Arg1, Tgfβ1, Il10, Tnf, Il6 and Nos2 in M2 macrophages treated with or without NaW were measured by real-time PCR (K), IL-10, TGFβ, IL-6 and TNF expression was measured by ELISAs (L), and iNOS protein expression was measured by western blotting (M). N The expression of Arg1, Tgfβ1, Il10, Tnf, Nos2 and Il6 in M2 BMDMs pretransfected with siRNA (Pygl) and treated with or without NaW before IL-4 stimulation as measured by real-time PCR. O, P The expression of P2Y14 in M2 macrophages treated with or without NaW was measured by real-time PCR (O), and the expression of STAT1 and p-STAT1 was measured by western blotting (P). Unless otherwise specified, n = 3 biologically independent experiments. The data are presented as the mean ± SEM. P values were calculated by one-way ANOVA. *P < 0.05; **P < 0.01; ***P < 0.001
Fig. 3
Fig. 3
NaW activates inflammatory and glucose transport genes in M2 macrophages. Six samples of IL-4-conditioned bone marrow-derived macrophages (BMDMs) with or without NaW (2 mM) treatment (Ctrl-1, Ctrl-2, Ctrl-3, NaW-1, NaW-2, or NaW-3) were collected for RNA-seq analysis. A Violin plot shows the abundance of genes expressed in the 6 samples. B, C GO results are represented using bubble plots (B) and directed acyclic graphs (C). D KEGG results are presented in a bar plot. E DEGs in a volcano plot
Fig. 4
Fig. 4
NaW increases lysosomal pH-mediated Ca2+ release and thus enhances glucose uptake. AG IL-4-conditioned bone marrow-derived macrophages (BMDMs) were treated with or without NaW (2 mM) for 12 h. (A) Scl2a1 expression was measured by real-time PCR. B The mean fluorescence intensity (MFI) level of 2NBDG was measured by flow cytometry. C LysoSensor Green-labeled acidic lysosomes were observed under a fluorescence microscope. Scale bar, 20 μm. D The MFI of the LysoSensor probe was measured by flow cytometry. E, F TMEM175 expression was measured by real-time PCR (E) and western blotting (F). GI IL-4-conditioned BMDMs were transfected with TMEM175 siRNAs for 12 h, the MFI of the LysoSensor probe was detected by flow cytometry (G), and Nos2 expression was determined by real-time PCR (H) and western blotting (I). J After Tmem175 overexpression in macrophages, the MFI emitted by 2NBDG was measured by flow cytometry. K IL-4-conditioned BMDMs were treated with or without NaW (2 mM) for 12 h, and cytosolic calcium release was measured by flow cytometry. L, M IL-4-conditioned BMDMs were treated with NH4Cl for 5 min, the pH value of lysosomes was measured with a microplate reader (L), and the cytosolic calcium release rate was measured by flow cytometry (M). N The expression of Mcoln1 and Mcoln2 was analyzed by real-time PCR. O The same as presented in (A), except cells were pretreated with 10 nM CsA for 1 h. P, Q The same as presented in (A), except the expression and location of TFEB were analyzed by real-time PCR (P) and immunofluorescence (Q) (scale bar, 20 μm). R, S IL-4-conditioned BMDMs were transfected with Tfeb siRNA, Scl2a1 expression was measured by real-time PCR, and the MFI of 2NBDG was measured by flow cytometry. Unless otherwise specified, n = 3 biologically independent experiments. The data are presented as the mean ± SEM. P values were calculated using one-way ANOVA. *P < 0.05; **P < 0.01; ***P < 0.001
Fig. 5
Fig. 5
NaW inhibits CF and promotes macrophage phenotype conversion. A, B Thirty-eight days after the sham/MI operation, the hearts of sham, sham-NaW, MI-PBS and MI-NaW mice were observed by Masson’s trichrome staining and microscopy (scale bar, 1 mm) (A), and the fibrotic region areas were quantified (B), n = 6. C, D Representative immunostaining (scale bar, 10 μm) (C) and immunofluorescence (scale bar, 20 μm) (D) for α-SMA in fibrotic regions of the heart 38 days after the sham/MI operation. C Blue: hematoxylin; brown: a-SMA. D Red: a-SMA; blue: DAPI. E, F Representative images showing collagen I (E) and III (F) immunofluorescence staining. Scale bar, 20 μm. GJ Ejection fraction (EF) (G), left ventricular fractional shortening (LVFS) (H) end-diastolic volume (EDV) (I) and end systolic volume (ESV) (J) as quantified via echocardiography 38 days after the sham/MI operation; n = 9, 9, 19, and19, respectively. KO On the 38th day after MI surgery, F4/80+ macrophages were isolated from the fibrotic area of MI-PBS, MI-NaW, sham, and sham-NaW mice, and the expression of Tgfb1, Arg1, Mrc1, Tnf, and Nos2 in macrophages was measured by real-time PCR; n = 7, 7, 8, and 8, respectively. PR The expression of Gys1, Ugp2, Slc2a1, and Pygl in the M2 macrophages isolated from the hearts of two groups of mice was measured by real-time PCR. n = 8, 8, 8, and 8, respectively. Unless otherwise specified, n = 3 biologically independent experiments. The data are presented as the mean ± SEM. P values were calculated by one-way ANOVA. *P < 0.05; **P < 0.01; ***P < 0.001
Fig. 6
Fig. 6
Inhibition of fibroblast activation by NaW is dependent on macrophage phenotype conversion. A, B Fibroblasts were activated with TGFβ for 48 h and treated with PBS and NaW (2 mM). The α-SMA expression levels in fibroblasts was measured by real-time PCR (A) and western blotting (B). C, D Fibroblasts were activated with TGFβ for 48 h and treated with PBS (Ctrl) and NaW (2 mM). The proliferation of fibroblasts and the degree to which they migrated were observed (C) and quantified (D) via wound-healing assay, n = 6 and 7, respectively. E, F Fibroblasts were activated with TGFβ for 48 h and treated with PBS (Ctrl), NaW, M1-sup, M2-sup or M2 + NaW-sup. The α-SMA expression levels in fibroblasts was measured by real-time PCR (E) and western blotting (F). G, H Fibroblasts were activated with TGFβ for 48 h and treated with PBS (Ctrl), NaW, M1-sup, M2-sup or M2 + NaW-sup. The proliferation of fibroblasts and the degree to which they migrated were observed (G) and quantified (H) by wound healing assay; n = 7, 7, 5, and 5, respectively. Unless otherwise specified, n = 3 biologically independent experiments. The data are presented as the mean ± SEM. P values were calculated by one-way ANOVA. *P < 0.05; **P < 0.01; ***P < 0.001

Similar articles

Cited by

References

    1. Aghajanian H, et al. Targeting cardiac fibrosis with engineered T cells. Nature. 2019;573:430–433. doi: 10.1038/s41586-019-1546-z. - DOI - PMC - PubMed
    1. Amigó-Correig M, et al. Sodium tungstate regulates food intake and body weight through activation of the hypothalamic leptin pathway. Diabetes Obes Metab. 2011;13:235–242. doi: 10.1111/j.1463-1326.2010.01339.x. - DOI - PubMed
    1. Appelqvist H, Wäster P, Kågedal K, Öllinger K. The lysosome: from waste bag to potential therapeutic target. J Mol Cell Biol. 2013;5:214–226. doi: 10.1093/jmcb/mjt022. - DOI - PubMed
    1. Aydemir M, et al. Sodium tungstate administration ameliorated diabetes-induced electrical and contractile remodeling of rat heart without normalization of hyperglycemia. Biol Trace Elem Res. 2012;148:216–223. doi: 10.1007/s12011-012-9350-8. - DOI - PubMed
    1. Barberà A, Rodríguez-Gil JE, Guinovart JJ. Insulin-like actions of tungstate in diabetic rats. Normalization of hepatic glucose metabolism. J Biol Chem. 1994;269:20047–20053. doi: 10.1016/S0021-9258(17)32125-7. - DOI - PubMed

LinkOut - more resources