. 2024 Jun 15;21(1):157.
doi: 10.1186/s12974-024-03153-0.

Cystatin F attenuates neuroinflammation and demyelination following murine coronavirus infection of the central nervous system

Affiliations

Cystatin F attenuates neuroinflammation and demyelination following murine coronavirus infection of the central nervous system

Amber R Syage et al. J Neuroinflammation. .

Abstract

Background: Cystatin F is a secreted lysosomal cysteine protease inhibitor that has been implicated in affecting the severity of demyelination and enhancing remyelination in pre-clinical models of immune-mediated demyelination. How cystatin F impacts neurologic disease severity following viral infection of the central nervous system (CNS) has not been well characterized and was the focus of this study. We used cystatin F null-mutant mice (Cst7-/-) with a well-established model of murine coronavirus-induced neurologic disease to evaluate the contributions of cystatin F in host defense, demyelination and remyelination.

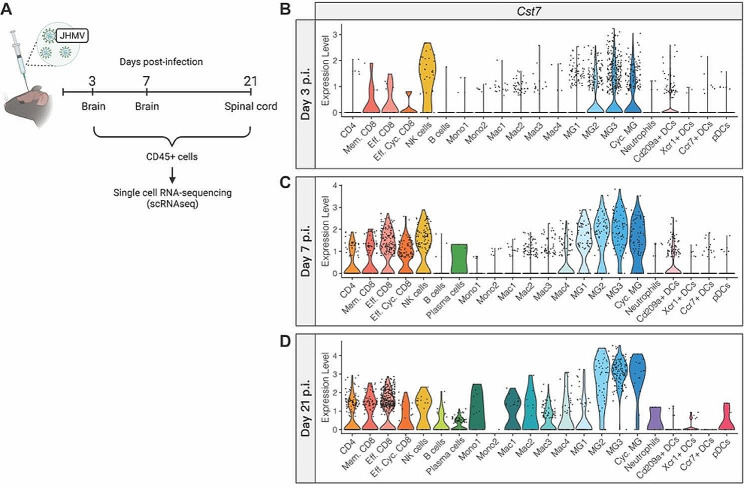
Methods: Wildtype controls and Cst7-/- mice were intracranially (i.c.) infected with a sublethal dose of the neurotropic JHM strain of mouse hepatitis virus (JHMV), with disease progression and survival monitored daily. Viral plaque assays and qPCR were used to assess viral levels in CNS. Immune cell infiltration into the CNS and immune cell activation were determined by flow cytometry and 10X genomics chromium 3' single cell RNA sequencing (scRNA-seq). Spinal cord demyelination was determined by luxol fast blue (LFB) and Hematoxylin/Eosin (H&E) staining and axonal damage assessed by immunohistochemical staining for SMI-32. Remyelination was evaluated by electron microscopy (EM) and calculation of g-ratios.

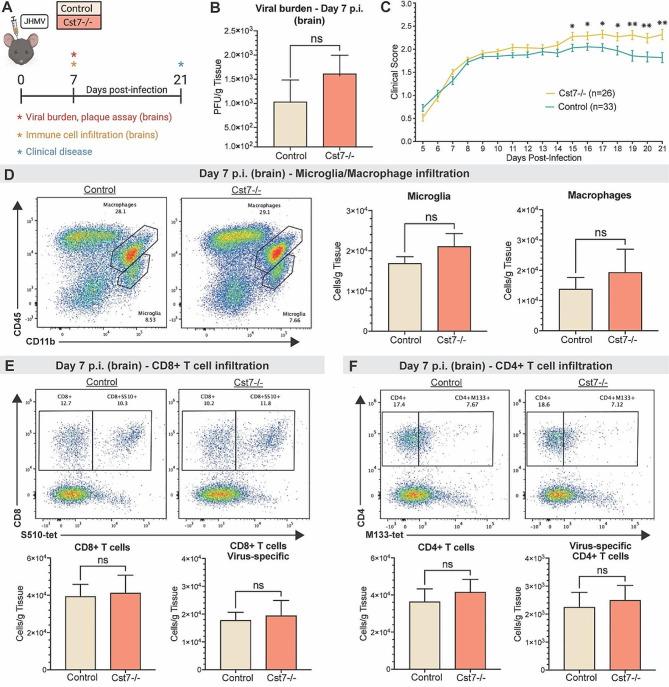
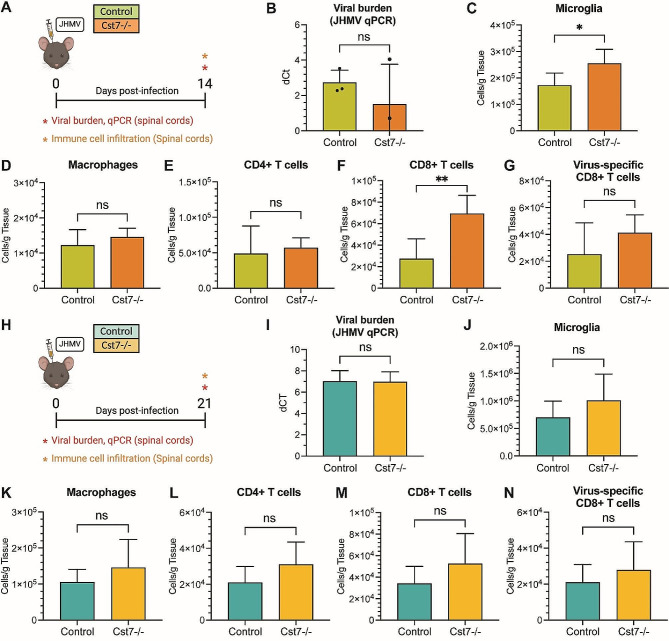
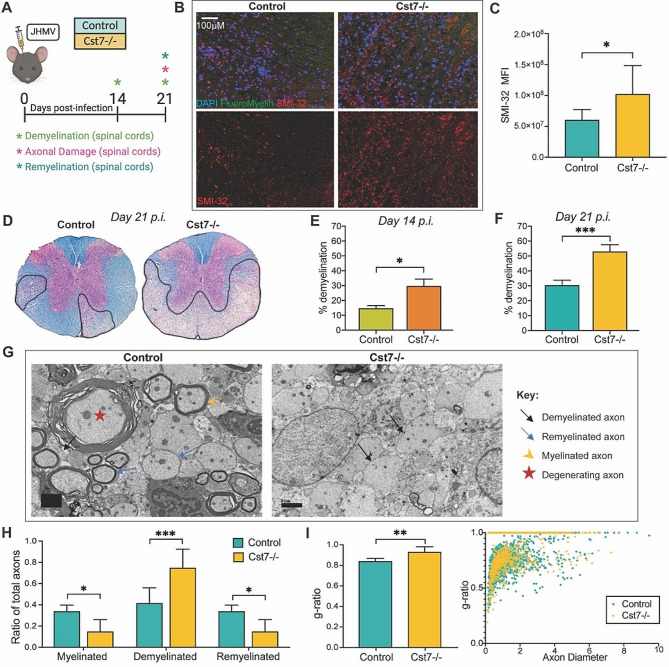
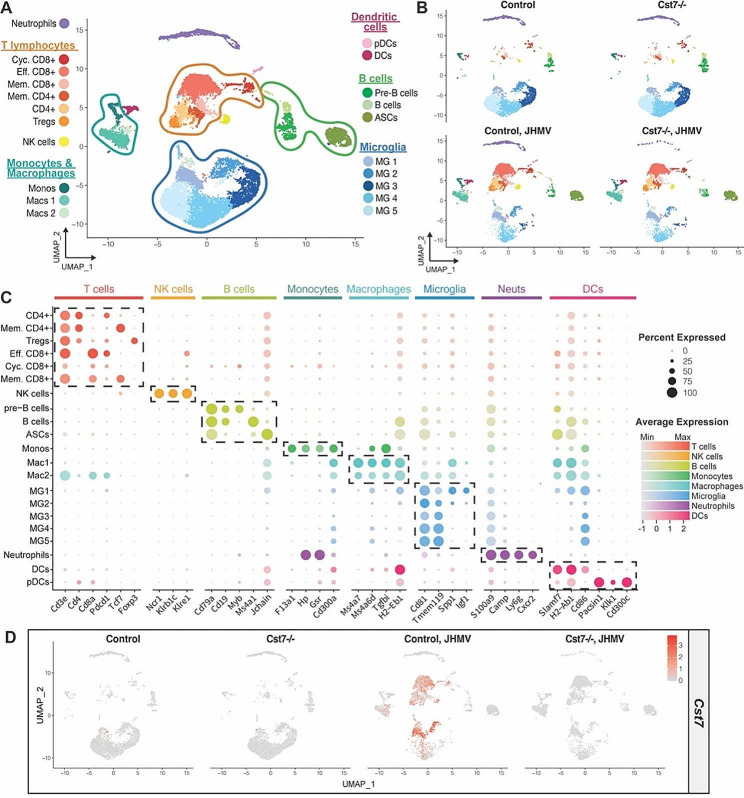
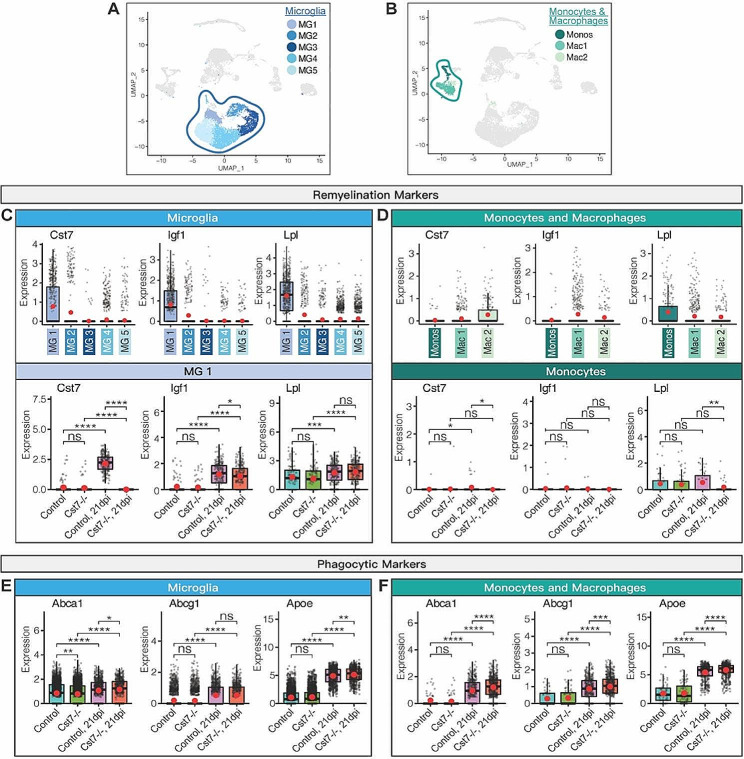
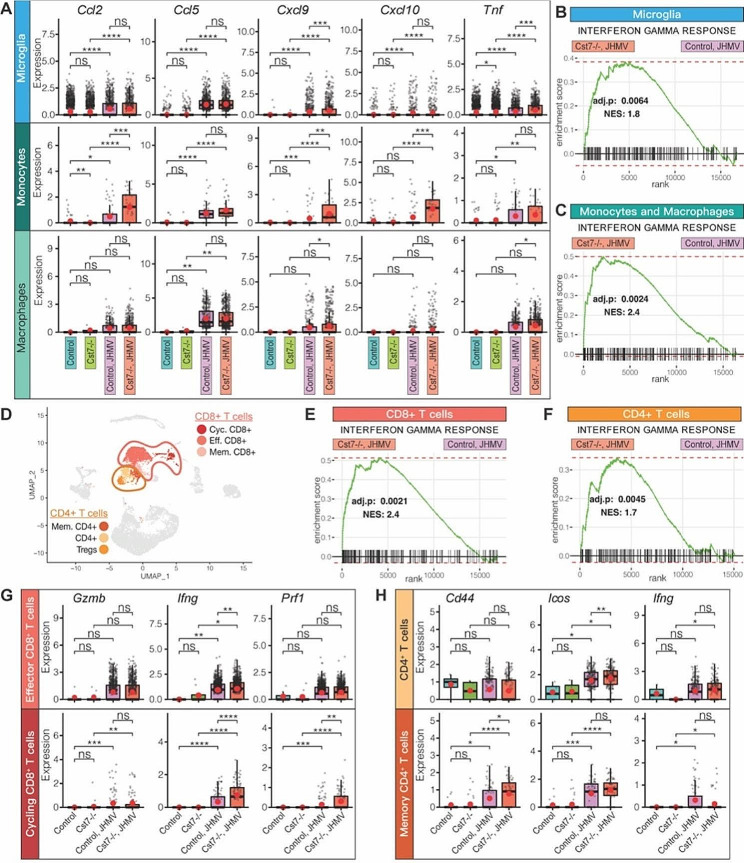
Results: JHMV-infected Cst7-/- mice were able to control viral replication within the CNS, indicating that cystatin F is not essential for an effective Th1 anti-viral immune response. Infiltration of T cells into the spinal cords of JHMV-infected Cst7-/- mice was increased compared to infected controls, and this correlated with increased axonal damage and demyelination associated with impaired remyelination. Single-cell RNA-seq of CD45 + cells enriched from spinal cords of infected Cst7-/- and control mice revealed enhanced expression of transcripts encoding T cell chemoattractants, Cxcl9 and Cxcl10, combined with elevated expression of interferon-g (Ifng) and perforin (Prf1) transcripts in CD8 + T cells from Cst7-/- mice compared to controls.

Conclusions: Cystatin F is not required for immune-mediated control of JHMV replication within the CNS. However, JHMV-infected Cst7-/- mice exhibited more severe clinical disease associated with increased demyelination and impaired remyelination. The increase in disease severity was associated with elevated expression of T cell chemoattractant chemokines, concurrent with increased neuroinflammation. These findings support the idea that cystatin F influences expression of proinflammatory gene expression impacting neuroinflammation, T cell activation and/or glia cell responses ultimately impacting neuroinflammation and neurologic disease.

Keywords: Coronavirus; Cystatin F; Demyelination; Microglia; Remyelination.


Conflict of interest statement

The authors declare no competing interests.

Figures

Fig. 1
Fig. 1
Expression profile of Cst7 transcripts in CD45 + cells from JHMV-infected mice. (A) scRNAseq was conducted on CD45 + cells from brains or spinal cords of JHMV-infected mice at defined times post-infection (p.i.) [29]. Violin plots showing expression levels of cystatin F (Cst7) within each cell cluster at (B) day 3 p.i. (brains), (C) day 7 p.i. (brains), and (D) day 21 p.i. (spinal cords). Dots shown in plots B-D represent individual cells
Fig. 2
Fig. 2
Cystatin F does not play a prominent role during acute disease following JHMV infection. (A) Cst7−/− mice and Cst7+/+ littermate controls were i.c. infected with JHMV. Brains were isolated at day 7 p.i. for flow cytometric analysis and viral titers (n = 7–9), and clinical disease was recorded. (B) Viral titers on brains at day 7 p.i. showed no significant difference between Cst7-/- (n = 7) and control mice (n = 9); level of sensitivity of plaque assay is ~ 100 PFU/g tissue (C) Increased clinical disease from day 15 to 21 p.i. was marked by a more severe hind-limb paralysis in Cst7-/- mice (n = 26) compared to controls (n = 33). (D) Representative flow cytometric plots show microglia (CD45loCD11b+) and infiltrating macrophage/myeloid cells (CD45hiCD11b+) in the brains of infected Cst7-/- (n = 8) or control mice (n = 6). Quantification of flow data indicates no difference in microglia or macrophage/myeloid cell numbers. (E) Representative staining for CD8 + and S510-518 tetramer revealed no difference in infiltrating CD8 + T cells and virus-specific CD8 + T cells between infected Cst7-/- and controls. (F) Staining for CD4 + and M133-147 tetramer showed similar numbers of infiltrating CD4 + T cells (p = 0.66) and virus-specific CD4 + T cells between infected groups. Data are presented as average ± SEM; ns - not significant; *p < 0.05, **p < 0.01
Fig. 3
Fig. 3
Silencing of Cst7 enhances immune cell infiltration into the spinal cord during early chronic disease following JHMV infection. (A) Cst7-/- and control mice were i.c. infected with JHMV, and spinal cords were isolated at day 14 p.i. to evaluate immune cell infiltration and viral burden. (B) There were no differences in viral RNA between infected Cst7-/- mice (n = 3) and controls (n = 3) at day 14 p.i. Quantification of flow cytometric data from spinal cords comparing (C) microglia (CD45loCD11b+), (D) macrophage/myeloid cells (CD45hiCD11b+), (E) CD4+ T cells, (F) CD8+ T cells, and (G) virus-specific CD8+ T cells (CD8+S510-518 tetramer+) between control (n = 5) and Cst7-/- (n = 8) mice demonstrates amplified infiltration of CD8 + T cells (p < 0.05) and microglia (p < 0.01) in Cst7-/- mice at day 14 p.i. (H) Cst7-/- and control mice were i.c. infected with JHMV, and spinal cords were isolated at day 21 p.i. to evaluate immune cell infiltration and viral burden. (I) No differences in viral RNA between infected Cst7-/- mice (n = 5) and controls (n = 5) were found at day 21 p.i. Quantification of flow cytometric data from spinal cords comparing (J) microglia, (K) macrophage/myeloid cells, (L) CD4+ T cells, (M) CD8+ T cells, and (N) virus-specific CD8+ T cells between control and Cst7-/- animals demonstrates no differences in immune cell populations in Cst7-/- mice at day 21p.i., (n = 5). Data are presented as average ± SD; ns - not significant; *p < 0.05; **p < 0.01
Fig. 4
Fig. 4
Cystatin F is necessary for remyelination following JHMV-induced demyelination. (A) Cst7−/− mice and littermate controls were i.c. infected with JHMV, and spinal cords were isolated at days 14 and 21 p.i. (B) Representative images showing increased SMI32 staining in spinal cords of JHMV-infected Cst7-/- mice compared to control mice; upper panels display DAPI (blue), fluoromyelin (green), and SMI32 (red); lower panels show only SMI32 staining at day 21 p.i. (C) Quantification of SMI32 staining in Cst7-/- mice (n = 7) and control mice (n = 7). (D) Representative spinal cord tissue stained with H&E and LFB (stains myelin fibers blue) from infected Cst7-/- and control mice at day 21 p.i., revealing demyelination within the ventral funiculus and lateral white matter columns (outlined by black line). Quantification of spinal cord demyelination at (E) day 14 p.i. (n = 4, control; n = 6, Cst7-/-) and (F) day 21 p.i. (n = 15, control; n = 12, Cst7-/-) between control and Cst7-/- mice. (G) Electron micrographs showing ultrathin spinal cord sections from control and Cst7-/- mice at day 21 p.i. highlighting myelinated, demyelinated, remyelinated axons and degenerated axons. Histological comparisons in the ventral funiculus and lateral white matter columns between Cst7-/- mice (n = 6) and controls (n = 6) were made from electron micrographs, including (H) ratios of myelinated, demyelinated axons, and remyelinated axons calculations, and (I) g-ratios (axon diameter/total fiber diameter), Scale bar for F is 2 μm. For H and I, 133–660 axons were analyzed per mouse. For SMI-32 analysis, data represents mean ± SD. All other data represent the mean ± SEM; *p < 0.05, **p < 0.01, ***p < 0.001
Fig. 5
Fig. 5
ScRNAseq reveals the immunological landscape within spinal cords of JHMV-infected Cst7-/- mice during chronic disease. Cst7−/− mice (n = 6) and controls (n = 6) were i.c. infected with JHMV, spinal cords from JHMV infected and uninfected mice were isolated day 21 p.i., and CD45 + cells were sorted for scRNAseq. (A) UMAP plot of scRNAseq data revealing 21 distinct cell clusters (aggregate data from uninfected and JHMV-infected Cst7-/- mice and controls at day 21 p.i.). (B) UMAP plots showing the immune landscape in uninfected and JHMV-infected Cst7-/- and control mice at day21 p.i. (C) Dot plot presenting expression of cell type specific markers within the 21 cell clusters. Dot size is representative of the percentage of cells from the cluster that express the gene, while the degree of color intensity exhibits the average expression level of the gene. The dashed boxes highlight commonly and uniquely expressed genes of clusters within overarching cell types. (D) Expression pattern and levels of Cst7 transcripts across each sample
Fig. 6
Fig. 6
Cst7 ablation produces altered expression of genes related to remyelination and phagocytosis following JHMV infection. UMAP plots highlighting (A) microglia and (B) monocyte/macrophage clusters. Expression of transcripts encoding remyelination markers cystatin F (Cst7), insulin-like growth factor-1 (Igf1), and lipoprotein lipase (Lpl) in (C) microglia and (D) monocytes/macrophages. For C and D, top rows show comparisons between clusters, while bottoms rows compare between uninfected and JHMV-infected Cst7-/-, and control mice, in specific clusters. Expression of phagocytic markers was examined in uninfected and JHMV-infected Cst7-/- and control mice, revealing an overall increase in expression of Abca1, Abcg1, and Apoe (apolipoprotein-E) in infected Cst7-/- compared to controls in both (E) microglia and (F) monocyte/macrophage clusters. In C-F, normalized expression values were used, and random noise was added. Box plots show interquartile range, median value (bold horizontal bar), and average expression per sample (red dot). Wilcoxon test was used; ns (not significant) p > 0.05, *p < 0.05, ** p < 0.01, *** p < 0.001, ****p < 0.0001
Fig. 7
Fig. 7
Cst7 ablation augments T cell activation and chemokine expression. (A) Levels of transcripts encoding macrophage chemoattractants, Ccl2 and Ccl5, T cell chemoattractants, Cxcl9 and Cxcl10, and tumor necrosis factor-alpha (TNF-α, Tnf) in monocyte, macrophage, microglia populations. Gene set enrichment analysis (GSEA) for IFN-γ responses in combined microglia (B) and monocyte/macrophage (C) clusters revealed elevated expression of genes related to IFN-γ responses in JHMV-infected Cst7-/- mice compared to controls. (D) UMAP plot highlighting CD8+ T cell clusters (Eff. CD8+, Cyc. CD8+, Mem. CD8+) and CD4+ T cell clusters (CD4+, Mem. CD4+). IFN-γ responses were also amplified in combined CD8+ T cells (E) and CD4+ T cells (F) in infected Cst7-/- mice compared to controls. (G) Eff. and Cyc. CD8+ T cells from infected Cst7-/- mice have increased expression of CD8+ T cell activation markers, granzyme b (Gzmb), perforin (Prf1), and IFN-γ (Ifng), compared with controls. Furthermore, expression levels of CD4+ T cell activation markers, Cd44 (CD44), Icos (inducible T cell co-stimulator), and Ifng (IFN-γ), were augmented in CD4+ T cells and Mem. CD4+ T cells from infected Cst7-/- mice compared to controls (H). In A, G-H, normalized expression values were used, and random noise was added. Box plots shows interquartile range, median value (bold horizontal bar), and average expression per sample (red dot). Wilcoxon test was used; ns - not significant; *p < 0.05, ** p < 0.01, *** p < 0.001, ****p < 0.0001

Similar articles

Cited by

References

    1. Templeton SP, Perlman S. Pathogenesis of acute and chronic central nervous system infection with variants of mouse hepatitis virus, strain JHM. Immunol Res. 2007;39:160–72. doi: 10.1007/s12026-007-0079-y. - DOI - PMC - PubMed
    1. Hosking MP, Lane TE. The Biology of persistent infection: inflammation and demyelination following murine coronavirus infection of the Central Nervous System. Curr Immunol Rev. 2009;5:267–76. doi: 10.2174/157339509789504005. - DOI - PMC - PubMed
    1. Ireland DD, Stohlman SA, Hinton DR, Atkinson R, Bergmann CC. Type I interferons are essential in controlling neurotropic coronavirus infection irrespective of functional CD8 T cells. J Virol. 2008;82:300–10. doi: 10.1128/JVI.01794-07. - DOI - PMC - PubMed
    1. Glass WG, Hickey MJ, Hardison JL, Liu MT, Manning JE, Lane TE. Antibody targeting of the CC chemokine ligand 5 results in diminished leukocyte infiltration into the central nervous system and reduced neurologic disease in a viral model of multiple sclerosis. J Immunol. 2004;172:4018–25. doi: 10.4049/jimmunol.172.7.4018. - DOI - PubMed
    1. Glass WG, Lane TE. Functional analysis of the CC chemokine receptor 5 (CCR5) on virus-specific CD8 + T cells following coronavirus infection of the central nervous system. Virology. 2003;312:407–14. doi: 10.1016/S0042-6822(03)00237-X. - DOI - PMC - PubMed

MeSH terms