. 2024 Jun 15;25(1):215.
doi: 10.1186/s12859-024-05836-0.

CPMI: comprehensive neighborhood-based perturbed mutual information for identifying critical states of complex biological processes

Affiliations

CPMI: comprehensive neighborhood-based perturbed mutual information for identifying critical states of complex biological processes

Jing Ren et al. BMC Bioinformatics. .

Abstract

Background: There exists a critical transition or tipping point during the complex biological process. Such critical transition is usually accompanied by the catastrophic consequences. Therefore, hunting for the tipping point or critical state is of significant importance to prevent or delay the occurrence of catastrophic consequences. However, predicting critical state based on the high-dimensional small sample data is a difficult problem, especially for single-cell expression data.

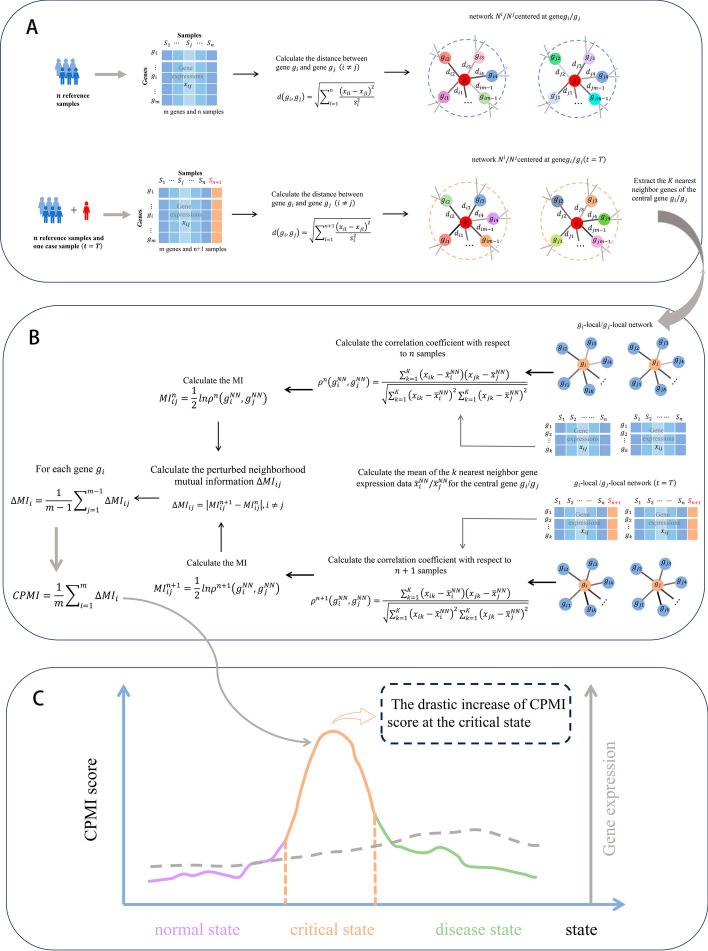
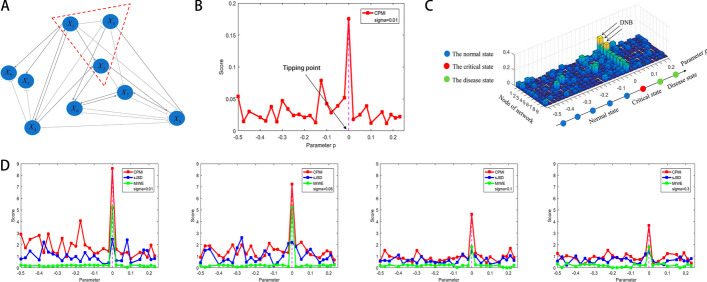
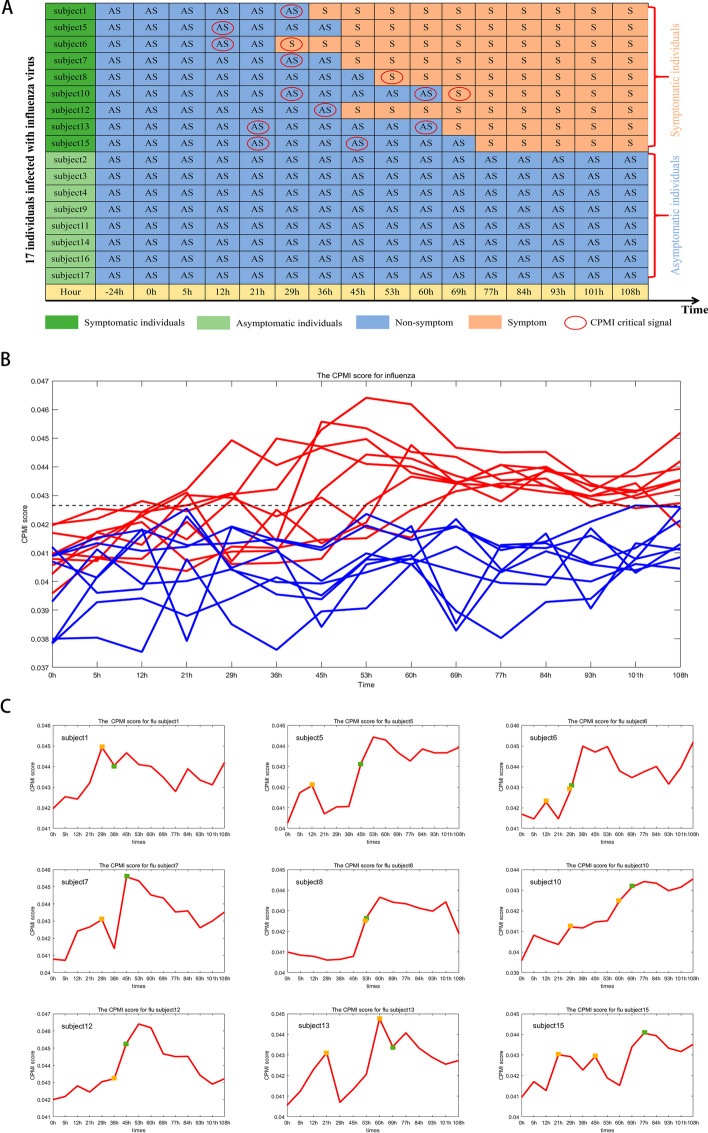
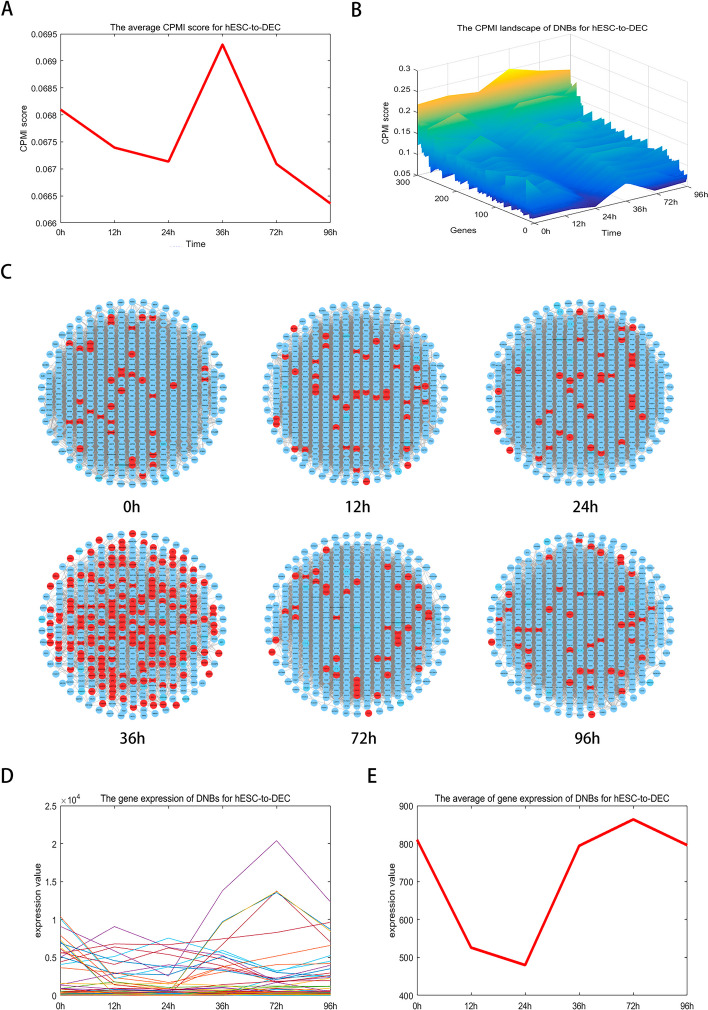
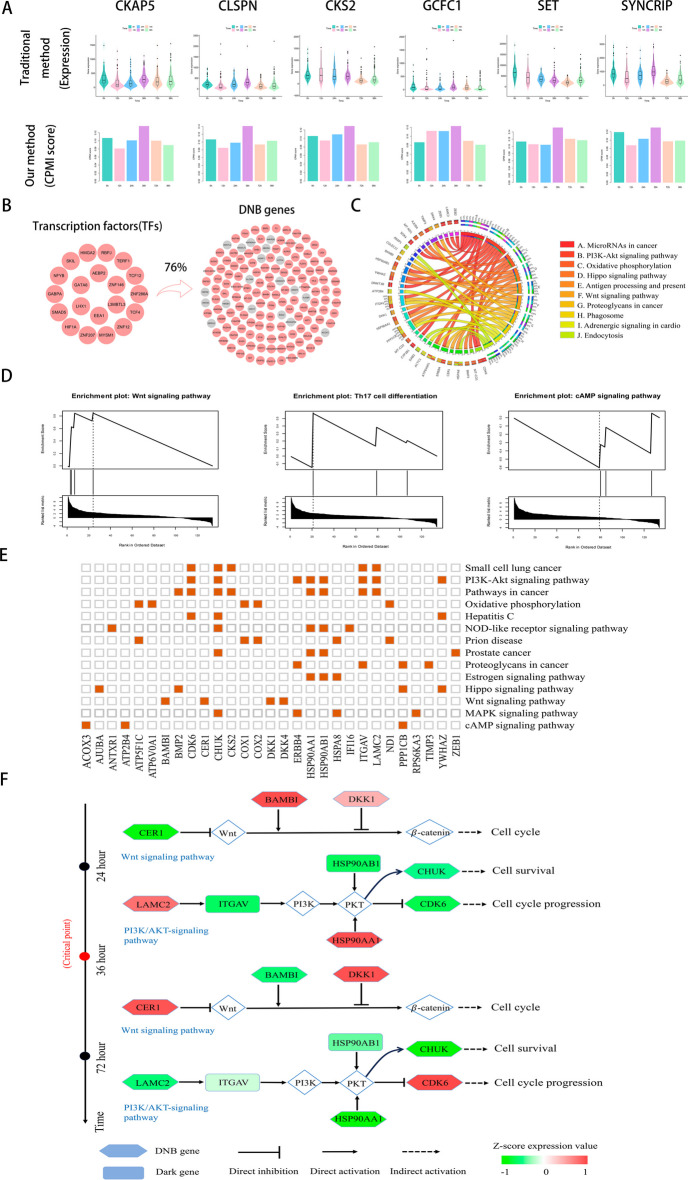
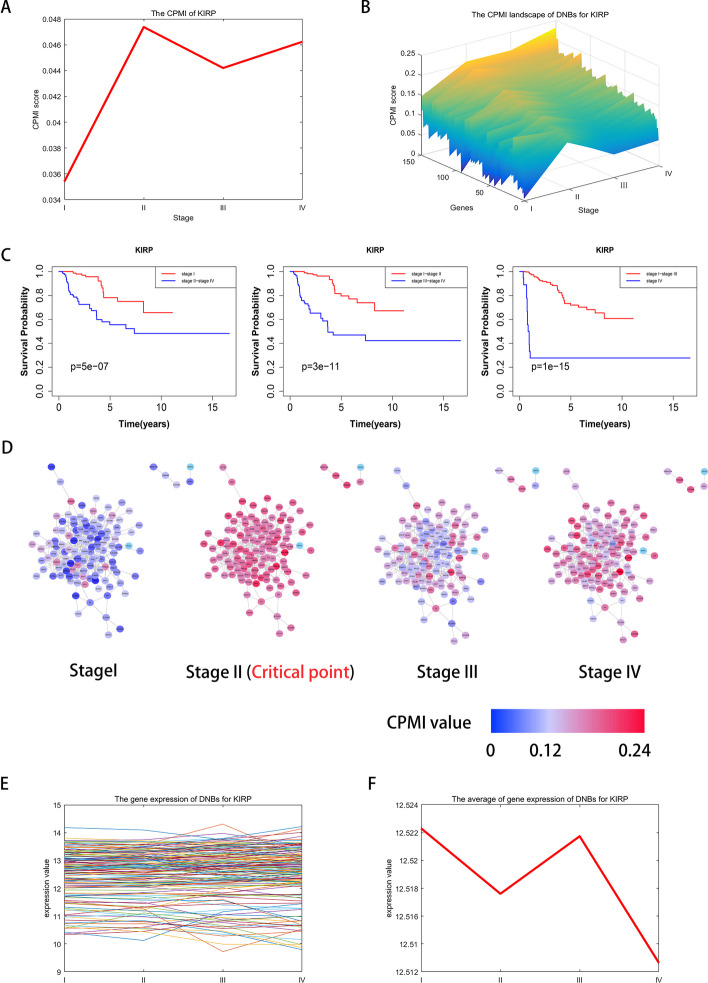
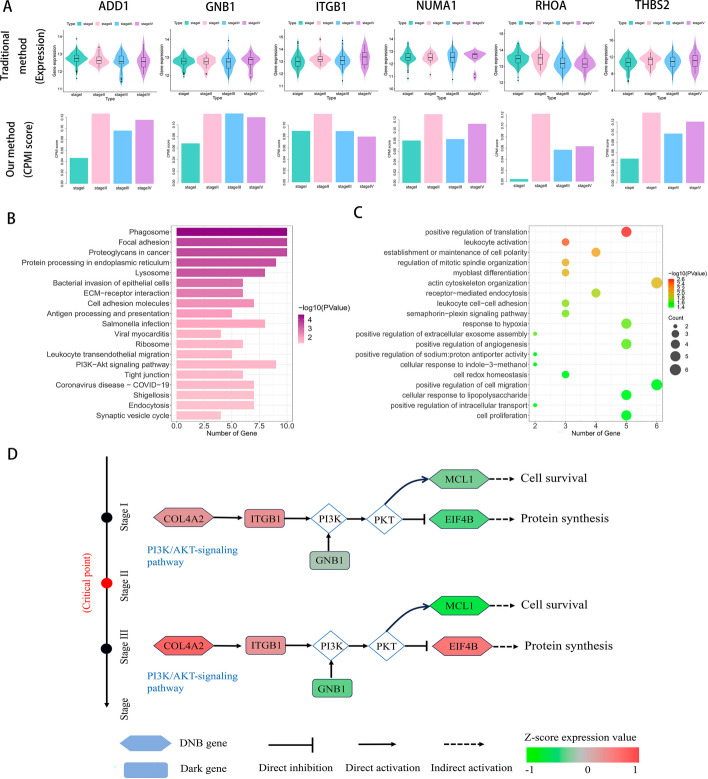
Results: In this study, we propose the comprehensive neighbourhood-based perturbed mutual information (CPMI) method to detect the critical states of complex biological processes. The CPMI method takes into account the relationship between genes and neighbours, so as to reduce the noise and enhance the robustness. This method is applied to a simulated dataset and six real datasets, including an influenza dataset, two single-cell expression datasets and three bulk datasets. The method can not only successfully detect the tipping points, but also identify their dynamic network biomarkers (DNBs). In addition, the discovery of transcription factors (TFs) which can regulate DNB genes and nondifferential 'dark genes' validates the effectiveness of our method. The numerical simulation verifies that the CPMI method is robust under different noise strengths and is superior to the existing methods on identifying the critical states.

Conclusions: In conclusion, we propose a robust computational method, i.e., CPMI, which is applicable in both the bulk and single cell datasets. The CPMI method holds great potential in providing the early warning signals for complex biological processes and enabling early disease diagnosis.

Keywords: Dark genes; Dynamic network biomarker (DNB); Perturbed neighbourhood mutual information (PMI); Tipping point; Transcription factors.


Conflict of interest statement

The authors declare that they have no competing interests. The authors declare that the research was conducted in the absence of any commercial or financial relationships that could be construed as a potential conflict of interest.

Figures

Fig. 1
Fig. 1
The schematic of the CPMI method for identifying the critical states of complex biological processes. A Given a group of control samples and case samples derived at time point t, the correlation network is constructed by a modified version of Mahalanobis distance. B Extract the K nearest neighbor genes of each gene. Thus, the local network is centered on gene gii=1,2,,m and contains other K neighbourhood genes gi1,gi2,,giK. Then, the CPMI is calculated for each gene. C During the progression of the biological process, The CPMI score increases significantly marking the imminence of a critical state
Fig. 2
Fig. 2
The validation of the CPMI method on a simulation dataset. A The model of an 9-node regulatory network, in which the arrow represents positive regulation whereas the blunt line denotes negative regulation. B The curve of the CPMI score of the global network. C The landscape of the CPMI scores for 9 nodes. D Comparison of the robustness between the CPMI method and MIWE, sJSD method at different noise strength
Fig. 3
Fig. 3
The identifification of the tipping point for influenza infection based on CPMI. A The temporal table of the time to the occurrence of influenza symptoms and the tipping point identified by CPMI for all individuals. B The CPMI score curve for all 17 subjects. The red curve represents the CPMI scores for nine symptomatic subjects. The blue curve represents the CPMI score for eight asymptomatic subjects. C The curves of the CPMI scores for nine symptomatic individuals. The green box represents the initial time to the appearance of influenza symptoms (clinical observation), and the orange box represents the critical state determined by the CPMI score
Fig. 4
Fig. 4
Identification of the cell fate transition of cell differentiation in hESC-to-DEC dataset. A The CPMI score curve of hESC-to-DEC. The significant increase of CPMI score at 36 h indicates the arrival of the critical state. B The CPMI landscape of DNBs for hESC-to-DEC. The overall CPMI score for the DNB gene is significantly higher at 36 h than at other time points, indicating that it is in a critical state. C The dynamic evolution of DNBs for hESC-to-DEC. At 36 h, a significant change in the network shows that a critical warning signal can be detected. D The gene expression of DNBs for hESC-to-DEC. E The average of gene expression of DNBs for hESC-to- DEC
Fig. 5
Fig. 5
Regulatory mechanisms of embryo development revealed by the DNB genes. A The comparison of gene expression and CPMI score of ‘dark genes’ for hESC-to DEC, CKAP5, CLSPN, HSP90AB1, ITGAV, SET and SYNCRIP were found to be ‘dark genes’ of hESC-to-DEC, whose CPMI scores were more sensitive to the early warning signal of embryonic differentiation. B The top 20 hub upstream TFs, which regulates 76% of the DNBs that were identified at 36h. C KEGG pathway enrichment analysis of regulated DNBs during the hESC-to-DEC process. The left side of the outer ring represents DNBs detected by CPMI algorithm and the right side of the outer ring represent detailed pathway in which these genes are involved. In the inner ring, the color and width of links respectively indicate diverse enrichment pathway and signifificant levels of genes function. D GSEA enrichment analysis of ‘dark genes’. The enriched pathways included Wnt signaling pathway, Th17 cell differentiation and cAMP signaling pathway. E DNBs are involved in important biological processes and KEGG pathways in hESC-to-DEC process. F For the hESC-to-DEC dataset, switching dynamics before and after critical point induced by other DNBs and ‘dark genes’
Fig. 6
Fig. 6
Identification of critical stage for KIRP. A The CPMI score curve of KIRP. The score reached its peak at the critical state stage II. B The CPMI landscape of DNBs for KIRP. DNBs scores increased significantly at stage II. C The comparison of KIRP survival times before and after every state. D The change of the DNBs CPMI values for KIRP. The dynamic evolution of the DNBs at different stages is shown, indicating that the critical state is at stageII. E The gene expression of DNBs for KIRP. F The average of gene expression of DNBs for KIRP
Fig. 7
Fig. 7
A The comparison of gene expression and CPMI score of ‘dark genes’ for KIRP, ADD1, GNB1, ITGB1, NUMA1, RHOA and THBS2, are found to be ‘dark genes’ of KIRP, whose CPMI scores are more sensitive to the early warning signal of disease deterioration. B GO analysis shows that DNB genes are involved in several biological processes associated with cancer. C Results of KEGG pathway enrichment analysis of DNB genes. D For the KIRP dataset, the underlying signaling mechanisms revealed by ‘dark genes’ and DNB genes

Similar articles

Cited by

References

    1. Liu R, Wang XD, Chen LN, et al. Early diagnosis of complex diseases by molecular biomarkers, network biomarkers, and dynamical network biomarkers. Med Res Rev. 2014;34(3):455–478. doi: 10.1002/med.21293. - DOI - PubMed
    1. Liu R, Chen P, Chen L. Single-sample landscape entropy reveals the imminent phase transition during disease progression. Bioinformatics. 2020;36:1522–1532. doi: 10.1093/bioinformatics/btz758. - DOI - PubMed
    1. Chen P, Li Y, Liu X, et al. Detecting the tipping points in a three-state model of complex diseases by temporal differential networks. J Transl Med. 2017;15:217. doi: 10.1186/s12967-017-1320-7. - DOI - PMC - PubMed
    1. Venegas JG, Winkler T, Musch G, et al. Self-organized patchiness in asthma as a prelude to catastrophic shifts. Nature. 2005;434(7034):777–782. doi: 10.1038/nature03490. - DOI - PubMed
    1. McSharry PE, Smith LA, Tarassenko L. Prediction of epileptic seizures: are nonlinear methods relevant? Nat Med. 2003;9:241–242. doi: 10.1038/nm0303-241. - DOI - PubMed

MeSH terms

Substances

LinkOut - more resources