

Distinct signatures of gut microbiota and metabolites in primary biliary cholangitis with poor biochemical response after ursodeoxycholic acid treatment
- PMID: 38879547
- PMCID: PMC11180406
- DOI: 10.1186/s13578-024-01253-1
Distinct signatures of gut microbiota and metabolites in primary biliary cholangitis with poor biochemical response after ursodeoxycholic acid treatment
Abstract
Background: About 1/3 of primary biliary cholangitis (PBC) patients suffered from poor response worldwide. And these patients present intestinal disturbances. We aimed to identify signatures of microbiota and metabolites in PBC patients with poor response, comparing to patients with response.
Methods: This study enrolled 25 subjects (14 PBC patients with response and 11 PBC patients with poor response). Metatranscriptomics and metabolomics analysis were carried out on their fecal.
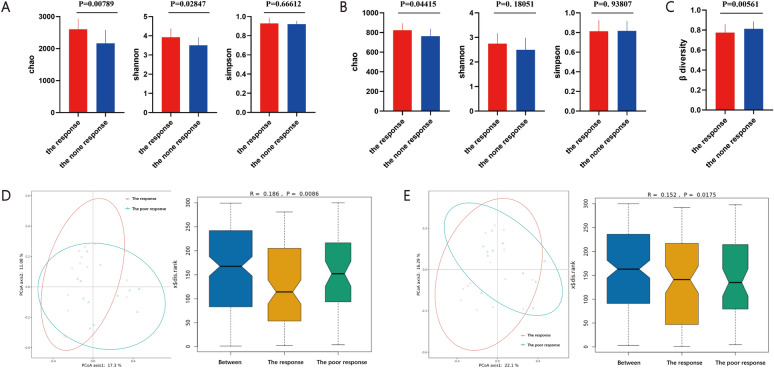
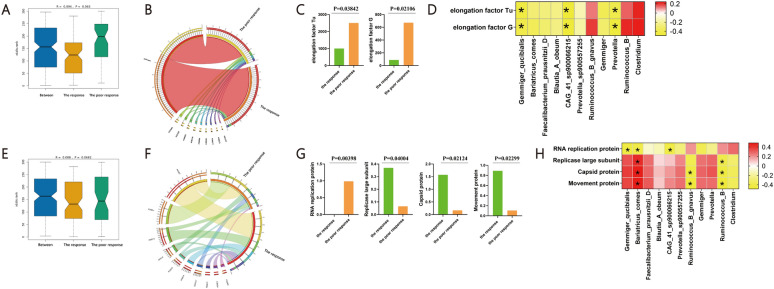
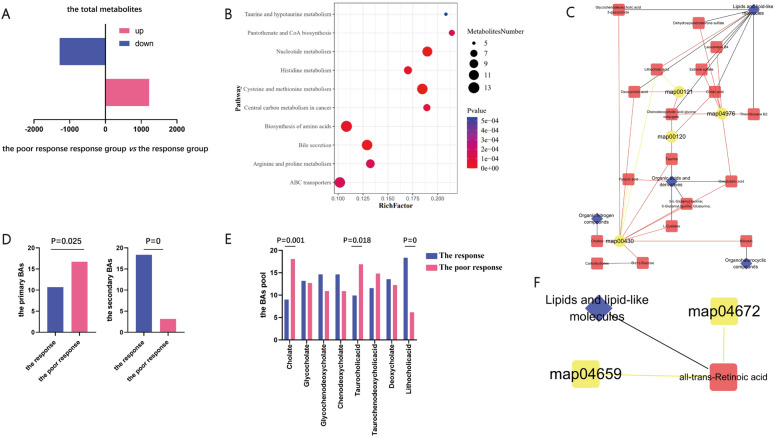
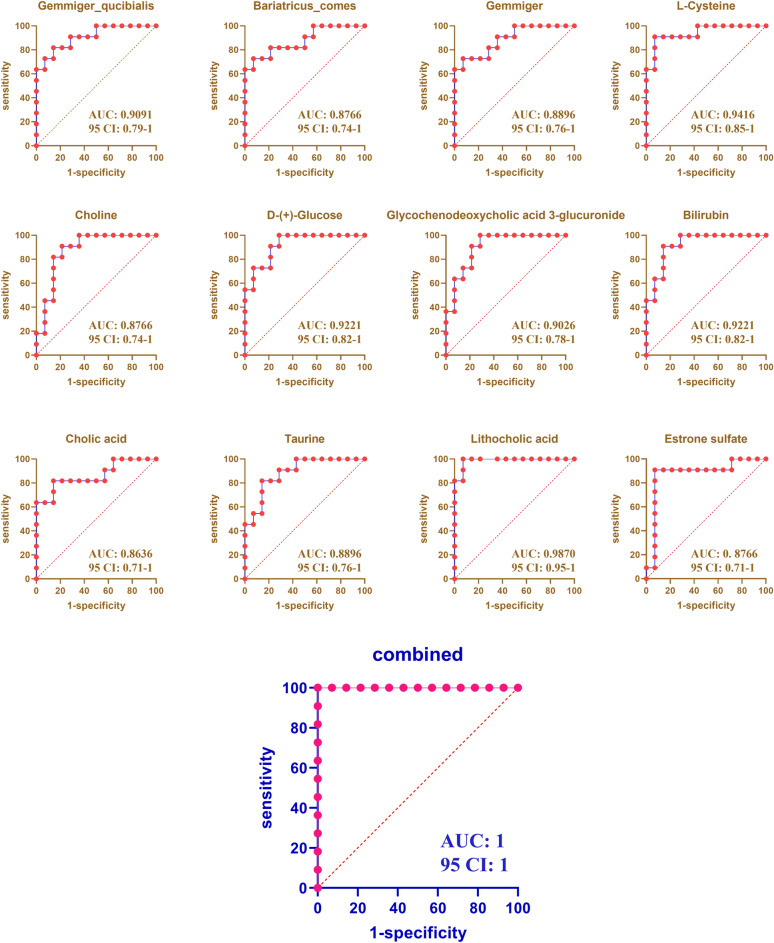
Results: PBC patients with poor response had significant differences in the composition of bacteria, characterized by decreased Gemmiger etc. and increased Ruminococcus etc. The differential microbiota functions characterized by decreased abundance of elongation factor Tu and elongation factor G base on the KO database, as well as decreased abundance of Replicase large subunit etc. based on the SWISS-PROT database. PBC with poor response also had significant differences in 17 kinds of bacterial metabolites, characterized by decreased level of metabolites vital in bile acids metabolism pathway (L-Cysteine etc.) and the all-trans-Retinoic acid, a kind of immune related metabolite. The altered microbiota was associated with the differential expressed metabolites and clinical liver function indicators. 1 bacterial genera, 2 bacterial species and 9 metabolites simultaneously discriminated PBC with poor response from PBC with response with high accuracy.
Conclusion: PBC patients with poor response exhibit unique changes in microbiota and metabolite. Gut microbiota and metabolite-based algorithms could be used as additional tools for differential prediction of PBC with poor prognosis.
© 2024. The Author(s).
Conflict of interest statement
The authors declare that they have no competing financial interests with the study.
Figures


Similar articles
-
Comprehensive Analysis of Serum and Fecal Bile Acid Profiles and Interaction with Gut Microbiota in Primary Biliary Cholangitis.Clin Rev Allergy Immunol. 2020 Feb;58(1):25-38. doi: 10.1007/s12016-019-08731-2. Clin Rev Allergy Immunol. 2020. PMID: 30900136
-
Machine learning-based characterization of the gut microbiome associated with the progression of primary biliary cholangitis to cirrhosis.Microbes Infect. 2024 Nov-Dec;26(8):105368. doi: 10.1016/j.micinf.2024.105368. Epub 2024 May 24. Microbes Infect. 2024. PMID: 38797428
-
Gut microbial profile is altered in primary biliary cholangitis and partially restored after UDCA therapy.Gut. 2018 Mar;67(3):534-541. doi: 10.1136/gutjnl-2016-313332. Epub 2017 Feb 17. Gut. 2018. PMID: 28213609
-
Exploring Advanced Therapies for Primary Biliary Cholangitis: Insights from the Gut Microbiota-Bile Acid-Immunity Network.Int J Mol Sci. 2024 Apr 13;25(8):4321. doi: 10.3390/ijms25084321. Int J Mol Sci. 2024. PMID: 38673905 Free PMC article. Review.
-
Targeting Gut Microbiota for the Treatment of Primary Biliary Cholangitis: From Bench to Bedside.J Clin Transl Hepatol. 2023 Aug 28;11(4):958-966. doi: 10.14218/JCTH.2022.00408. Epub 2023 Mar 1. J Clin Transl Hepatol. 2023. PMID: 37408823 Free PMC article. Review.
Cited by
-
Gut feeling gone wrong: Tangled relationship between disorders of gut-brain interaction and liver disease.World J Hepatol. 2025 May 27;17(5):105582. doi: 10.4254/wjh.v17.i5.105582. World J Hepatol. 2025. PMID: 40501467 Free PMC article. Review.
References
-
- Pariente A, Chazouilleres O, Causse X, Hanslik B, Arpurt JP, Henrion J, Rosa I, Renou C, Garioud A, Corpechot C. Management of primary biliary cholangitis: results from a large real-life observational study in France and Belgium. Eur J Gastroenterol Hepatol. 2021;33:e197–e205. doi: 10.1097/MEG.0000000000002011. - DOI - PubMed
-
- Lv LX, Fang DQ, Shi D, Chen DY, Yan R, Zhu YX, Chen YF, Shao L, Guo FF, Wu WR, Li A, Shi HY, Jiang XW, Jiang HY, Xiao YH, Zheng SS, Li LJ. Alterations and correlations of the gut microbiome, metabolism and immunity in patients with primary biliary cirrhosis. Environ Microbiol. 2016;18:2272–2286. doi: 10.1111/1462-2920.13401. - DOI - PubMed
LinkOut - more resources
Full Text Sources
Research Materials
