. 2024 Jun 15;26(1):121.
doi: 10.1186/s13075-024-03354-1.

Baricitinib ameliorates inflammatory and neuropathic pain in collagen antibody-induced arthritis mice by modulating the IL-6/JAK/STAT3 pathway and CSF-1 expression in dorsal root ganglion neurons

Affiliations

Baricitinib ameliorates inflammatory and neuropathic pain in collagen antibody-induced arthritis mice by modulating the IL-6/JAK/STAT3 pathway and CSF-1 expression in dorsal root ganglion neurons

Kenta Makabe et al. Arthritis Res Ther. .

Abstract

Background: Janus kinase (JAK) inhibitors, such as baricitinib, are widely used to treat rheumatoid arthritis (RA). Clinical studies show that baricitinib is more effective at reducing pain than other similar drugs. Here, we aimed to elucidate the molecular mechanisms underlying the pain relief conferred by baricitinib, using a mouse model of arthritis.

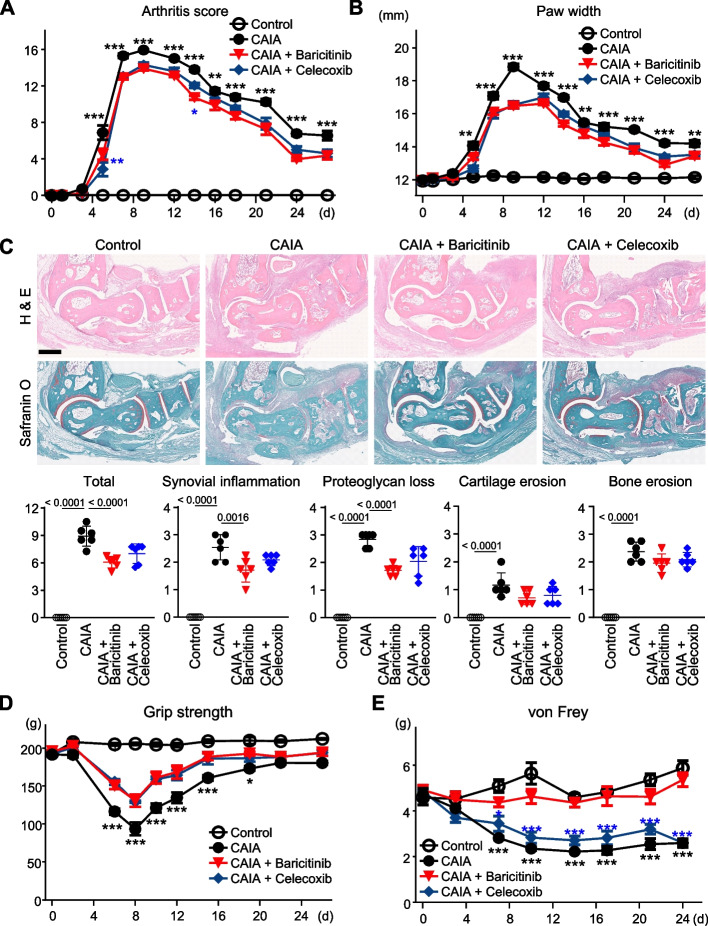
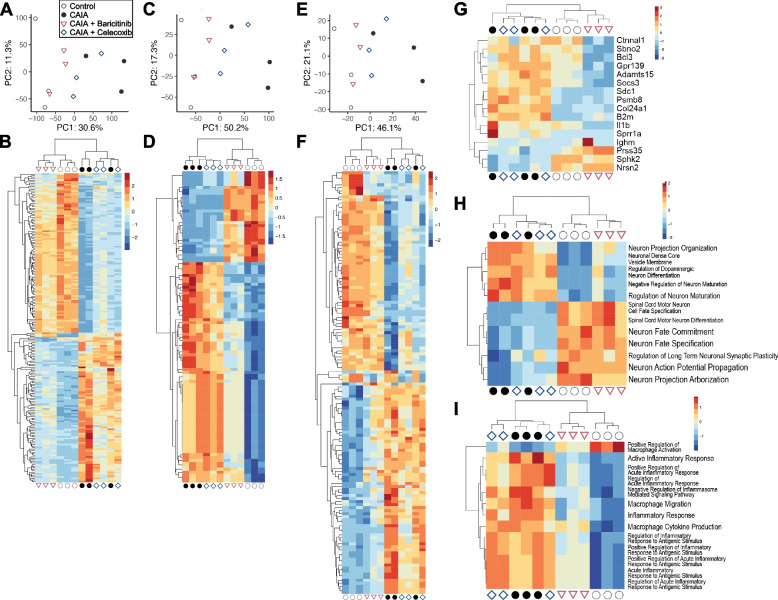
Methods: We treated collagen antibody-induced arthritis (CAIA) model mice with baricitinib, celecoxib, or vehicle, and evaluated the severity of arthritis, histological findings of the spinal cord, and pain-related behaviours. We also conducted RNA sequencing (RNA-seq) to identify alterations in gene expression in the dorsal root ganglion (DRG) following baricitinib treatment. Finally, we conducted in vitro experiments to investigate the direct effects of baricitinib on neuronal cells.

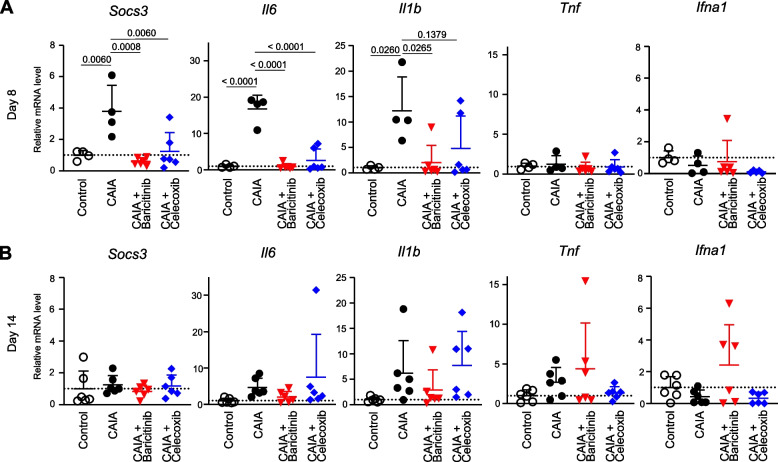
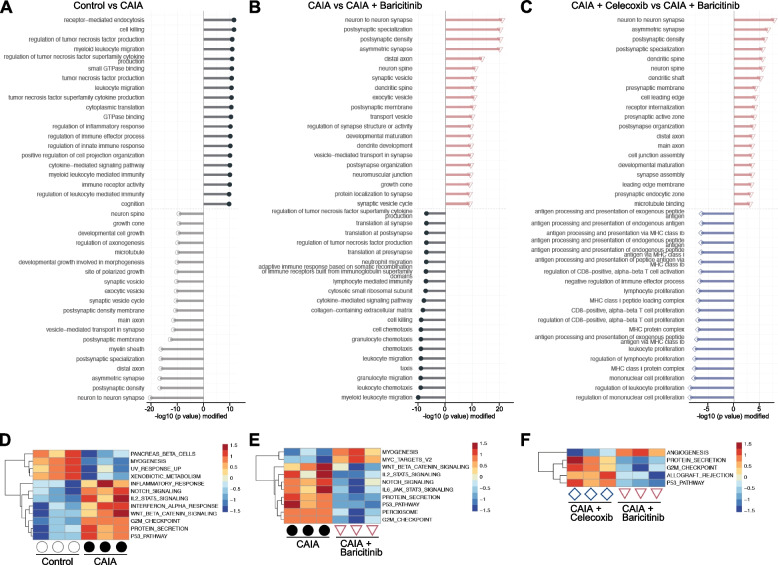
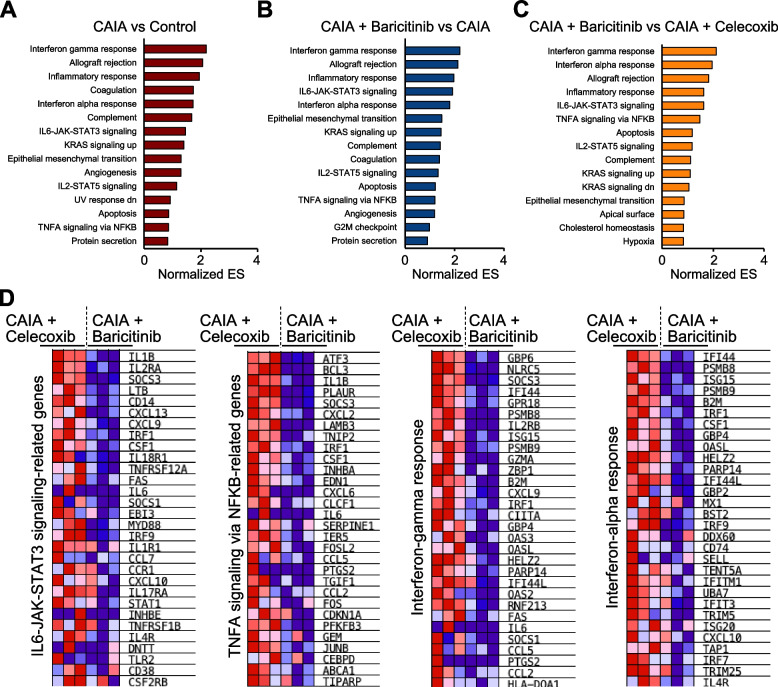
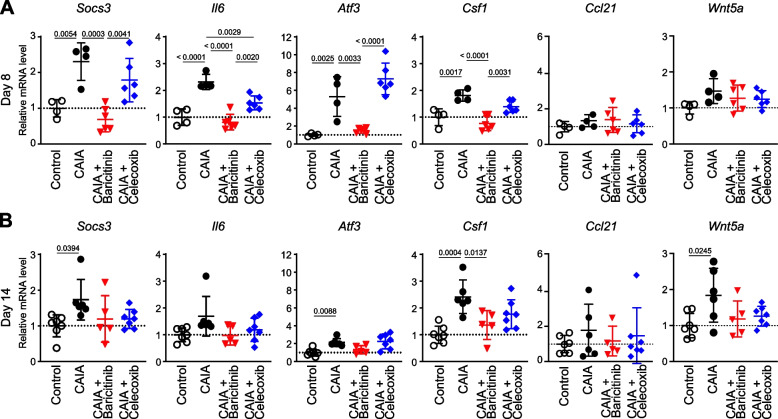
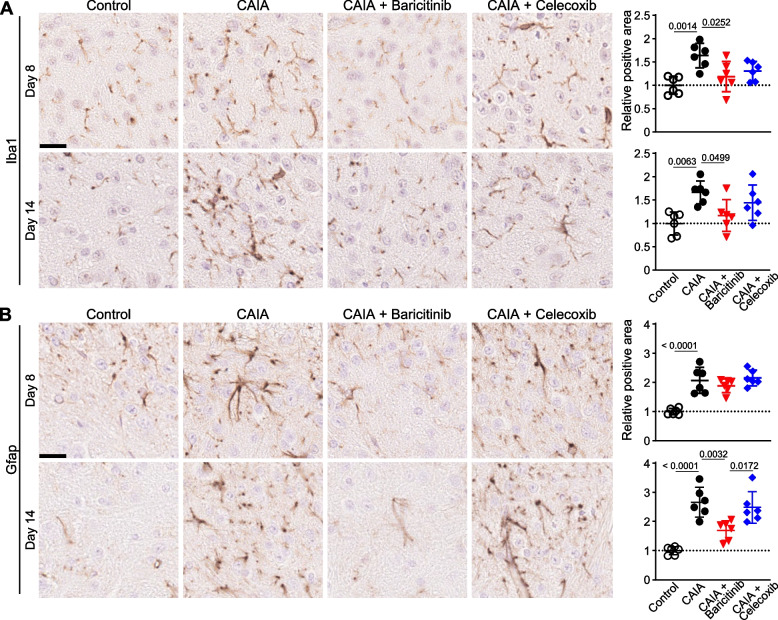
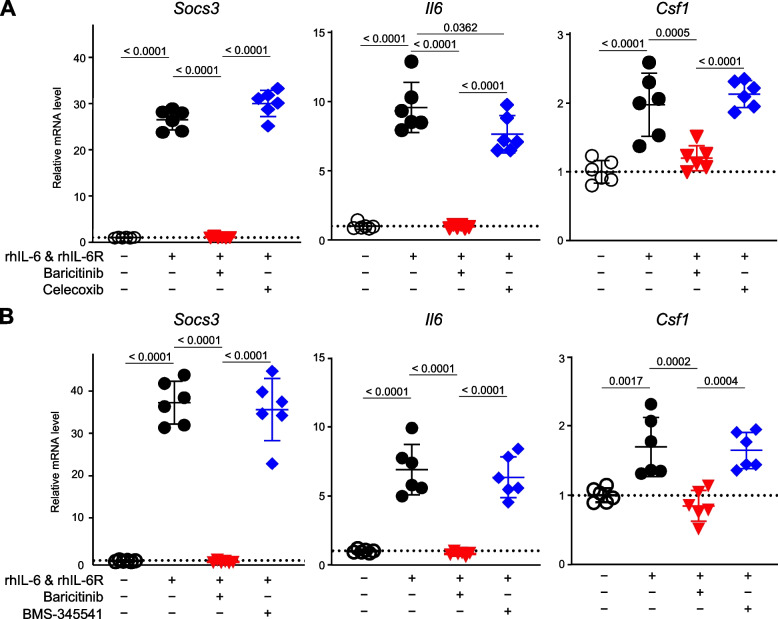
Results: Both baricitinib and celecoxib significantly decreased CAIA and improved arthritis-dependent grip-strength deficit, while only baricitinib notably suppressed residual tactile allodynia as determined by the von Frey test. CAIA induction of inflammatory cytokines in ankle synovium, including interleukin (IL)-1β and IL-6, was suppressed by treatment with either baricitinib or celecoxib. In contrast, RNA-seq analysis of the DRG revealed that baricitinib, but not celecoxib, restored gene expression alterations induced by CAIA to the control condition. Among many pathways changed by CAIA and baricitinib treatment, the interferon-alpha/gamma, JAK-signal transducer and activator of transcription 3 (STAT3), and nuclear factor kappa B (NF-κB) pathways were considerably decreased in the baricitinib group compared with the celecoxib group. Notably, only baricitinib decreased the expression of colony-stimulating factor 1 (CSF-1), a potent cytokine that causes neuropathic pain through activation of the microglia-astrocyte axis in the spinal cord. Accordingly, baricitinib prevented increases in microglia and astrocytes caused by CAIA. Baricitinib also suppressed JAK/STAT3 pathway activity and Csf1 expression in cultured neuronal cells.

Conclusions: Our findings demonstrate the effects baricitinib has on the DRG in relation to ameliorating both inflammatory and neuropathic pain.

Keywords: Baricitinib; CAIA model; JAK/STAT3 pathway; Pain-related behaviour; Rheumatoid arthritis.


Conflict of interest statement

This work was partially supported by Eli Lilly Japan K.K. NI and MT are employees of Eli Lilly Japan K.K. and a minor shareholders of Eli Lilly and Company. The authors declare no other potential competing interests.

Figures

Fig. 1
Fig. 1
Arthritis transition of CAIA model mice. The transition of arthritis score (A) and paw width (B) of mice without CAIA induction (Control), CAIA-induced mice without treatment (CAIA), CAIA-induced mice treated with baricitinib (CAIA + Baricitinib) or celecoxib (CAIA + Celecoxib), during a four-week period following CAIA induction. (C) H&E and safranin O staining of ankle joints of the four groups at day 8. Scale bar, 5 mm. Lower panels indicate quantified scores for histological findings. (D) The transition of grip strength of the four groups over the four weeks. (E) The transition of withdrawal threshold of the four groups over the four weeks, based on von Frey test results. The data are expressed as line graphs and means ± SEM (A, B, D, E) or as dot plots and means ± SD (C) (n = 6 mice/group for A, B, D and E, and n = 6 sections with 3 mice/group for C). *P < 0.05, **P < 0.01, ***P < 0.005; two-way ANOVA (A, B, D, E), or P-values determined by one-way ANOVA (C) followed by Tukey’s post hoc test. Black and blue asterisks indicate the P-values of CAIA + Baricitinib vs CAIA, or CAIA + Baricitinib vs CAIA + Celecoxib, respectively
Fig. 2
Fig. 2
mRNA expression of marker genes in ankle synovium obtained from mice in the four groups: mice without CAIA induction (Control), CAIA-induced mice without treatment (CAIA), CAIA-induced mice treated with baricitinib (CAIA + Baricitinib) or celecoxib (CAIA + Celecoxib) at days 8 (A) and 14 (B). All data are expressed as dot plots and means ± SD. P-values were determined by one-way ANOVA followed by Tukey’s post hoc test
Fig. 3
Fig. 3
Comprehensive RNA-seq analyses of gene expression in the DRG. PCA (A, C, E) and heatmaps (B, D, F) of DEGs in DRG samples of the four groups at day 8 (n = 3 mice/group). The analyses were based on genes (A and B), GO terms (C and D) and pathways (E and F). All significantly changed genes (B), GO terms (D) and pathways (F) are shown in the heatmaps. Heatmaps with the names of genes, GO terms and pathways can be found in Supplementary Fig. 1–3. (G) A heatmap of genes that were significantly altered in the CAIA + Baricitinib group. (H) Heatmaps of neuron-related GO terms that were significantly altered in the CAIA + Baricitinib group. (I) Heatmaps of macrophage inflammation-related GO terms that were significantly altered in the CAIA + Baricitinib group. The colours of the heatmaps represent the expression levels of each gene or gene set. High levels of expression are depicted in red, while low levels of expression are depicted in blue
Fig. 4
Fig. 4
Enriched terms and pathways between respective two groups. Distinct top-20 GO terms in DRGs between Control vs CAIA (A), CAIA vs CAIA + Baricitinib (B), and CAIA + Celecoxib vs CAIA + Baricitinib (C), determined using by clusterProfiler. Heatmaps of significantly enriched Hallmark pathways in DRG between Control vs CAIA (D), CAIA vs CAIA + Baricitinib (E), and CAIA + Celecoxib vs CAIA + Baricitinib (F)
Fig. 5
Fig. 5
Pathway analyses by gene set enrichment analysis (GSEA). Altered pathways in DRG between Control vs CAIA (A), CAIA + Baricitinib vs CAIA (B), and CAIA + Baricitinib vs CAIA + Celecoxib (C). (D) Heatmaps of the top-30 ranked genes in each Hallmark pathway related to the JAK/STAT3, NK-κB, and interferon-gamma or -alpha pathways
Fig. 6
Fig. 6
mRNA levels of marker genes in the DRG. qRT-PCR data of DRG from the four groups at days 8 (n = 4–6 mice/group) (A) and 14 (n = 5–7 mice/group) (B). All data are expressed as dot plots and means ± SD. P-values were determined by one-way ANOVA followed by Tukey’s post hoc test
Fig. 7
Fig. 7
Alteration of microglia and astrocytes in the SDH. Immunohistochemistry for the microglia marker Iba1 (A) and the astrocyte marker Gfap (B) in the SDH of the four groups at days 8 and 14. Scale bar, 20 µm. The right-hand panels indicate positive areas relative to the control (n = 6 sections with 3 mice/group). All data are expressed as dot plots and means ± SD. P-values were determined by one-way ANOVA followed by Tukey’s post hoc test
Fig. 8
Fig. 8
mRNA levels of Socs3, Il6 and Csf1 in Neuro-2a cells. Neuro-2a cells were cultured with or without 50 ng/mL rhIL-6, 50 ng/mL rhIL-6R, 400 ng/mL baricitinib, and 300 ng/mL celecoxib (A), or 50 ng/mL BMS (B) for 8 h (n = 6 biological replicates/group). All data are expressed as dot plots and means ± SD. P-values were determined by one-way ANOVA followed by Tukey’s post hoc test

Similar articles

Cited by

References

    1. Ibrahim SSA, Huttunen KM. Orchestrated modulation of rheumatoid arthritis via crosstalking intracellular signaling pathways. Inflammopharmacology. 2021;29(4):965–974. doi: 10.1007/s10787-021-00800-3. - DOI - PubMed
    1. Liu S, Ma H, Zhang H, Deng C, Xin P. Recent advances on signaling pathways and their inhibitors in rheumatoid arthritis. Clin Immunol. 2021;230:108793. doi: 10.1016/j.clim.2021.108793. - DOI - PubMed
    1. Fan Y, Mao R, Yang J. NF-kappaB and STAT3 signaling pathways collaboratively link inflammation to cancer. Protein Cell. 2013;4(3):176–185. doi: 10.1007/s13238-013-2084-3. - DOI - PMC - PubMed
    1. Berghea F, Berghea CE, Zaharia D, Trandafir AI, Nita EC, Vlad VM. Residual Pain in the Context of Selecting and Switching Biologic Therapy in Inflammatory Rheumatic Diseases. Front Med (Lausanne) 2021;8:712645. doi: 10.3389/fmed.2021.712645. - DOI - PMC - PubMed
    1. Boakye PA, Tang SJ, Smith PA. Mediators of Neuropathic Pain; Focus on Spinal Microglia, CSF-1, BDNF, CCL21, TNF-alpha, Wnt Ligands, and Interleukin 1beta. Front Pain Res (Lausanne) 2021;2:698157. doi: 10.3389/fpain.2021.698157. - DOI - PMC - PubMed

MeSH terms

Supplementary concepts