. 2024 Jun 15;21(1):158.
doi: 10.1186/s12974-024-03150-3.

Neonatal Chlamydia muridarum respiratory infection causes neuroinflammation within the brainstem during the early postnatal period

Affiliations

Neonatal Chlamydia muridarum respiratory infection causes neuroinflammation within the brainstem during the early postnatal period

Kateleen E Hedley et al. J Neuroinflammation. .

Abstract

Respiratory infections are one of the most common causes of illness and morbidity in neonates worldwide. In the acute phase infections are known to cause wide-spread peripheral inflammation. However, the inflammatory consequences to the critical neural control centres for respiration have not been explored. Utilising a well characterised model of neonatal respiratory infection, we investigated acute responses within the medulla oblongata which contains key respiratory regions. Neonatal mice were intranasally inoculated within 24 h of birth, with either Chlamydia muridarum or sham-infected, and tissue collected on postnatal day 15, the peak of peripheral inflammation. A key finding of this study is that, while the periphery appeared to show no sex-specific effects of a neonatal respiratory infection, sex had a significant impact on the inflammatory response of the medulla oblongata. There was a distinct sex-specific response in the medulla coincident with peak of peripheral inflammation, with females demonstrating an upregulation of anti-inflammatory cytokines and males showing very few changes. Microglia also demonstrated sex-specificity with the morphology of females and males differing based upon the nuclei. Astrocytes showed limited changes during the acute response to neonatal infection. These data highlight the strong sex-specific impact of a respiratory infection can have on the medulla in the acute inflammatory phase.

Keywords: Astrocytes; Cytokines; Medulla oblongata; Microglia; Sex-specific.


Conflict of interest statement

All authors declare that they have no known competing financial interests or personal relationships that could have appeared to influence the work reported in this paper.

Figures

Fig. 1
Fig. 1
Brain atlas for identification of nuclei. Nuclei were identified using a brain atlas [17], at bregma level − 7.48 mm, with central canal (CC), area postrema (AP) and hypoglossal nucleus (nXII) for reference, with NTS outlined in red, DMX outlined in green
Fig. 2
Fig. 2
Acute effects of a neonatal respiratory infection on weight. The A) average gross weight and B) weight gain per day of SPG (solid line) and CMU (dotted line) infected mice, with significance between weight gain on a single day, SPG n = 27, CMU n = 28 (*p < 0.05, **p < 0.01, ****p < 0.0001)
Fig. 3
Fig. 3
Upregulation in the expression of all inflammatory mediators in the lungs following neonatal infection. Graphs show gene expression levels (mean ± SEM) for SPG (solid bars) and CMU (hatched bars) females (grey) and males (black), with total number of samples shown in each bar. Inflammatory mediator expression; A) 16s (SPG vs. CMU ***p < 0.001), B) CXCL9 (SPG vs. CMU ***p < 0.001), C) NLRP3 (SPG vs. CMU ***p < 0.001), D) TNFα (SPG vs. CMU **p < 0.01) and E) IL-1β (SPG vs. CMU ***p < 0.001)
Fig. 4
Fig. 4
Upregulation of inflammatory mediators in the medulla oblongata of infected females. Graphs show A) CXCL9 (FSPG vs. FCMU **p < 0.01), B) CXCL10 (FSPG vs. FCMU *p < 0.05), C) IL-13 (FSPG vs. FCMU *p < 0.05), D) KCNN4 (FSPG vs. FCMU *p < 0.05), E) BDNF (FSPG vs. FCMU *p < 0.05) and F) TGFβ relative gene expression levels (mean ± SEM) at P15. Graphs presented as SPG (solid bars), CMU (hatched bars), females (grey) and males (black), with total number of samples shown in each bar
Fig. 5
Fig. 5
Downregulation of inflammatory mediators in the medulla oblongata of infected males. Graphs show A) Stat6 (MSPG vs. MCMU *p < 0.05), B) PTGS2 (MSPG vs. MCMU *p < 0.05), C) IFNγ, D) Stat1, E) NLRP3, F) TNFα and G) IL-1β relative gene expression levels (mean ± SEM) at P15. Graphs presented as SPG (solid bars), CMU (hatched bars), females (grey) and males (black), with total number of samples shown in each bar
Fig. 6
Fig. 6
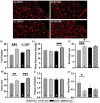
Iba1 immunofluorescent images and quantification of microglia in the NTS. Brainstem sections were labelled with Iba1 to identify microglia and nuclei were identified using a brain atlas. A-D) representative images of all groups showing the area selected for NTS with the area postrema removed, scale bars represent 100 μm. Graphs show E) number of cells (FSPG vs. MCMU ***p < 0.001), F) MFI (MSPG vs. MCMU ***p < 0.001), G) % area (FSPG vs. FCMU ***p < 0.001, FSPG vs. MSPG *p < 0.05), H-J) units in pixels, with H) soma area (FSPG vs. FCMU **p < 0.01, MSPG vs. MCMU ***p < 0.001), I) number of primary branches and J) number of secondary branches (branch points) (FSPG vs. FCMU *p < 0.05), (mean ± SEM). Graphs presented as SPG (solid bars), CMU (hatched bars), females (grey) and males (black), with total number of samples shown in each bar
Fig. 7
Fig. 7
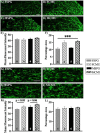
Iba1 immunofluorescent images and quantification of microglia in the DMX. Brainstem sections were labelled with Iba1 to identify microglia and nuclei were identified using a brain atlas. A-D) representative images of all groups showing the area selected for DMX, scale bars represent 100 μm. Graphs show E) number of cells (FSPG vs. FCMU *p < 0.05, MSPG vs. MCMU **p < 0.01), F) MFI (FSPG vs. FCMU **p < 0.01, MSPG vs. MCMU ***p < 0.001), G) % area, H-J) units in pixels, with H) soma area (FSPG vs. MSPG *p < 0.05), I) number of primary branches and J) number of secondary branches (branch points) (mean ± SEM). Graphs presented as SPG (solid bars), CMU (hatched bars), females (grey) and males (black), with total number of samples shown in each bar
Fig. 8
Fig. 8
GFAP immunofluorescent images and quantification of astrocytes in the NTS and DMX. Brainstem sections were labelled with GFAP to identify astrocytes and nuclei were identified using a brain atlas. A-D) representative images of all groups showing the area selected for NTS with the area postrema removed, G-J) representative images of all groups showing the area selected for DMX, scale bars represent 100 μm. Graphs show E) MFI and F) % area (SPG vs. CMU ***p < 0.001) in the NTS and K) MFI and L) % area in the DMX (mean ± SEM). Graphs presented as SPG (solid bars), CMU (hatched bars), females (grey) and males (black), with total number of samples shown in each bar

Similar articles

References

    1. Hocker AD, Stokes JA, Powell FL, Huxtable AG. The impact of inflammation on respiratory plasticity. Exp Neurol. 2017;287(Pt 2):243–53. doi: 10.1016/j.expneurol.2016.07.022. - DOI - PMC - PubMed
    1. Rowland R, Sass Z, Ponsonby A-L, Pezic A, Tang ML, Vuillermin P, et al. Burden of infection in Australian infants. J Paediatr Child Health. 2021;57(2):204–11. doi: 10.1111/jpc.15174. - DOI - PubMed
    1. Rours GI, Hammerschlag MR, Van Doornum GJ, Hop WC, de Groot R, Willemse HF, et al. Chlamydia trachomatis respiratory infection in Dutch infants. Arch Dis Child. 2009;94(9):705–7. doi: 10.1136/adc.2008.152066. - DOI - PubMed
    1. Colarizi P, Chiesa C, Pacifico L, Adorisio E, Rossi N, Ranucci A, et al. Chlamydia trachomatis-associated respiratory disease in the very early neonatal period. Acta Paediatr. 1996;85(8):991–4. doi: 10.1111/j.1651-2227.1996.tb14200.x. - DOI - PubMed
    1. Beigelman A, Bacharier LB. Early-life respiratory infections and asthma development: role in disease pathogenesis and potential targets for disease prevention. Curr Opin Allergy Clin Immunol. 2016;16(2):172–8. doi: 10.1097/ACI.0000000000000244. - DOI - PMC - PubMed