. 2024 Jun 15;15(1):5119.
doi: 10.1038/s41467-024-49543-z.

A tripartite organelle platform links growth factor receptor signaling to mitochondrial metabolism

Affiliations

A tripartite organelle platform links growth factor receptor signaling to mitochondrial metabolism

Deborah Mesa et al. Nat Commun. .

Abstract

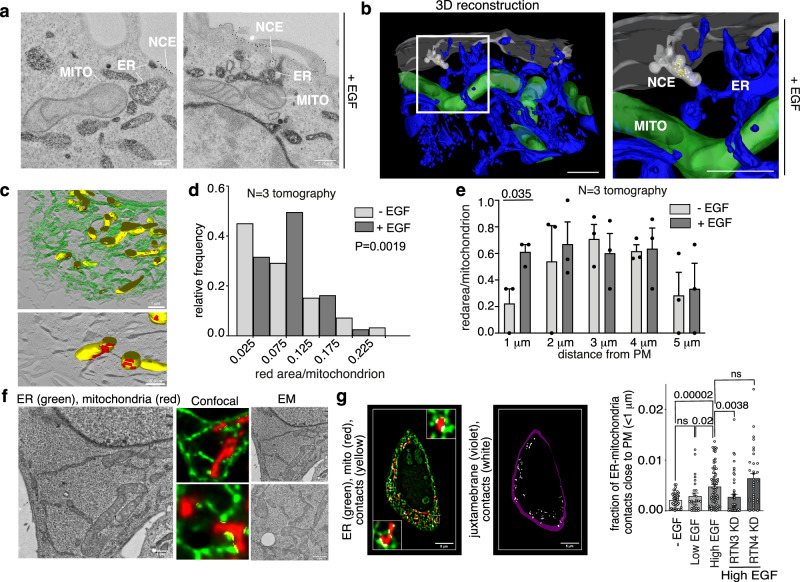
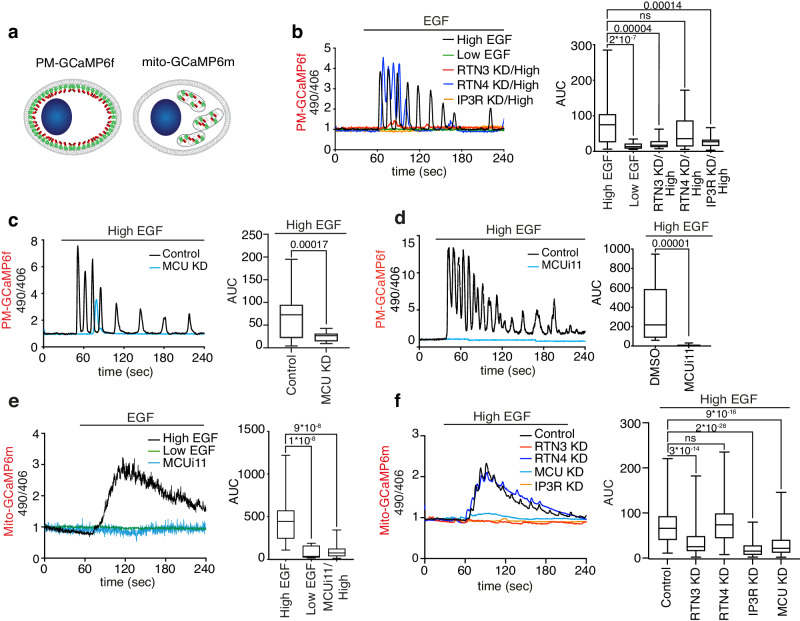
One open question in the biology of growth factor receptors is how a quantitative input (i.e., ligand concentration) is decoded by the cell to produce specific response(s). Here, we show that an EGFR endocytic mechanism, non-clathrin endocytosis (NCE), which is activated only at high ligand concentrations and targets receptor to degradation, requires a tripartite organelle platform involving the plasma membrane (PM), endoplasmic reticulum (ER) and mitochondria. At these contact sites, EGFR-dependent, ER-generated Ca2+ oscillations are sensed by mitochondria, leading to increased metabolism and ATP production. Locally released ATP is required for cortical actin remodeling and EGFR-NCE vesicle fission. The same biochemical circuitry is also needed for an effector function of EGFR, i.e., collective motility. The multiorganelle signaling platform herein described mediates direct communication between EGFR signaling and mitochondrial metabolism, and is predicted to have a broad impact on cell physiology as it is activated by another growth factor receptor, HGFR/MET.


Conflict of interest statement

The authors declare no competing interests.

Figures

Fig. 1
Fig. 1. EGFR-NCE involves tripartite PM-ER-mitochondria contact sites.
a Representative immuno-EM image of a tripartite contact between an NCE structure positive for CD147 (gold-immunolabelled), ER (stained with HRP-KDEL) and mitochondrion (n = 3). HeLa cells were stimulated with high dose EGF (5 min). Bar, 0.25 μM. b Tomographic 3D reconstruction of the cortical region of a HeLa cell as in (a) showing the proximity between NCE structures (light gray) containing the cargo CD147 (yellow dots), the ER (blue) and mitochondria (green). Right, magnification. Bar, 1 μm. c Upper panel, tomographic 3D reconstruction of the ER (green) and mitochondrial networks (yellow) as in a. Lower panel, the ER signal was removed and areas of contact (<20 nm) with mitochondria are highlighted in red. Bars, 1 μM (upper), 500 nm (lower). d Quantification of the red area/mitochondrion (>0.05) as in (c) in unstimulated vs. high dose EGF-stimulated cells. Results are expressed as the frequency of mitochondria displaying an ad hoc defined range of red area/mitochondrion ratios relative to the total of mitochondria. P-value, χ2 test of the absolute values, two-tailed (N = 3). e The fraction of mitochondria in contact with the ER, determined as in c, is reported as a function of distance from the PM. Mean ± SD. f Left, representative deconvolved image of an ultrathin-section of resin-embedded HRP-KDEL-transfected HeLa cells. Center/right, cells stained with FITC-Tyramide (ER in green) and mitotracker (in red). Representative CLEM images showing fluorescence (center) and EM (right) images of the same cell sections (n = 2). Contact sites were recognized by ImageJ JACoP-plugin (yellow). Bars, 1 μm. g Control, RTN3-KD and RTN4-KD HeLa cells, transfected with HRP-KDEL, were stimulated as indicated. Left, representative deconvolved image of resin-thin-section of HeLa control cells stained as in f. Center, ER-mitochondria contacts (white), juxtamembrane area (violet). Right, ER-mitochondria contacts in the juxtamembrane area quantified with ImageJ JACoP-plugin. Bar, 5 μm. Mean density of ER-mitochondrial contacts within 1 μm from the PM ± SEM is reported. N = number of cells: -EGF/N = 44, LowEGF/N = 28, HighEGF/N = 78, RTN3-KD/N = 50, RTN4-KD/N = 34. Exact p-values are shown (Each Pair Student’s t test, two-taileda); ns not significant, n biological replicate. Source data are provided as a Source Data file.
Fig. 2
Fig. 2. EGFR-NCE induces Ca2+ oscillations at the PM which rely on mitochondrial Ca2+ buffering activity.
a Schematic of the GCaMP6f Ca2+ probe targeted to the PM inner leaflet (PM-GCaMP6f, left) or to inside mitochondria (mito-GCaMP6m, right). b HeLa PM-GCaMP6f cells were stimulated with low dose EGF/N = 31 or high dose EGF in the presence of RTN3-KD/N = 25, RTN4-KD/N = 26 or IP3R-KD/N = 25 or mock control/N = 40 and fluorescence monitored (n = 3). N number of cells. Results (here and in panels c-f) are presented as the ratio of the emission at 490/406 nm. Left, representative single-cell response curves. Right, area under the curve (AUC) is shown. c, d HeLa PM-GCaMP6f cells subjected or not to MCU KD (c) or MCUi11 treatment (d) and stimulated with high dose EGF. c Control/N = 44, MCU-KD/N = 21 (n = 4); (d) Control/N = 20, MCUi11-treated/N = 20, one representative experiment of n = 2 is shown. e HeLa mito-GCaMP6m cells treated with low EGF/N = 12 or high EGF alone/N = 27 or with MCUi11/N = 30 (n = 1). f HeLa mito-GCaMP6m cells subjected or not to the indicated KDs and stimulated with high dose EGF. Control/N = 123; RTN3-KD/N = 135; RTN4-KD/N = 95; IP3R-KD/N = 123; MCU-KD/N = 102 (n = 4). In the box plots, the lower and upper boundaries of the box are the first and third quartiles, with the median annotated with a line inside the box. The whiskers extend to the maximum and minimum values. Exact p-values are shown in all panels (Each Pair Student’s t test, two-tailed); ns not significant, n biological replicates. Source data are provided as a Source Data file.
Fig. 3
Fig. 3. NCE-associated Ca2+ oscillations induce mitochondrial ATP production.
a Representative images of TMRM fluorescence in HeLa cells stimulated or not with low or high dose EGF after 45 s since recording started. Bar, 10 µM. b Left, time course of TMRM fluorescence intensity in cells treated as in “a”. Right, Total peak area±SD: -EGF/N = 219; LowEGF/N = 217; HighEGF/N = 205; N = number of cells (n = 5). c TMRM fluorescence measured in HeLa cells, subjected to the indicated KD or mock control, and stimulated with high dose EGF (5 min). Mock unstimulated cells (-EGF), negative control. Total peak area is reported. N=number of cells: -EGF/N = 68, Control/N = 421, RTN3-KD/N = 316, RTN4-KD/N = 324, IP3R-KD/N = 265, IP3R-KD/N = 228 (n ≥ 3). d Left, representative TPEF images of HeLa cells mock transfected/unstimulated (Control/-EGF) or subjected to RTN3 KD or mock transfection (Control) and stimulated with high dose EGF (5 min). Images have a dimension of 70 × 70 µm2. Scale bar: 10 µm. Right, quantification of the distribution of TPEF signal in HeLa cells treated as in left panel: N, Field of View, -EGF/N = 26, Control/High EGF/N = 32, RTN3-KD/High EGF/N = 27 (n = 3). Statistical significance was calculated using the non-parametric U-Mann Whitney test, two-tailed. e Left, schematic showing luciferase targeted to the PM inner leaflet by fusion with the PM-targeting domain of SNAP25. Right, representative IF staining showing the localization of the SNAP25-luciferase fusion protein [SNAP(PM)-Luc] (n = 3). Bar, 10 μm. f Luminescence was measured in HeLa cells expressing PM-Luc stimulated with low or high EGF. Left, representative curves of luminescence over the baseline; cps, count per second. Right, mean AUC ± SD. N=number of coverslips (for panels fh): HighEGF/N = 11, LowEGF/N = 12 (n = 2). g, h Luminescence was measured in HeLa cells expressing PM-Luc were subjected or not to the indicated KDs (g) or inhibitor treatments (h) and stimulated with high dose EGF. Results are presented as in f. g Control/N = 4, RTN3-KD/N = 4, RTN4-KD/N = 4; a representative experiment of n = 4 is shown. (h) Control/N = 18, MCUi11/N = 12, oligomycin (OMY)/N = 10, xestospongin (XeC)/N = 12 (n ≥ 3). Box plots (panels bd) are defined as in Fig. 2f. Each Pair Student’s t test, two-tailed (panels b, c, fh); exact p-values are shown; ns not significant, n biological replicates. Source data are provided as a Source Data file.
Fig. 4
Fig. 4. HGFR is internalized via NCE and relies on the same Ca2+/ATP circuitry as EGFR.
a CD147 internalization (green) was monitored in vivo in HeLa cells stimulated with HGF (100 ng/ml, 8 min). Control cells were left unstimulated. Acid wash treatment was applied prior to fixation. HGFR was stained with a specific antibody after fixation and permeabilization (red). Blue, DAPI. Bar, 20 µm. b Representative immuno-EM image of a tripartite contact between a NCE structure positive for CD147 (immunolabelled with gold), ER (stained with HRP-KDEL) and mitochondrion. HeLa cells were stimulated with HGF (100 ng/ml, 5 min). Images in a, b are representative of n = 2. c HGFR internalization was measured in HeLa cells stimulated with HGF (100 ng/ml, 8 min) under different KD conditions. After fixation, HGFR was stained prior to permeabilization to detect PM-HGFR. Cells were then further fixed and permeabilized to enable total HGFR staining. Left, representative IF images of total HGFR (red). Bar, 20 µm. Right, quantification of the ratio PM-HGFR/total-HGFR. Image analysis was performed using ImageJ software. N, number of cells, Control/N = 114, RTN3-KD/N = 130, Clathrin-KD/N = 126, RTN3/Clathrin-KD/N = 122 (n = 2). d CD147 internalization followed as in a was quantified under different KD conditions. Mean integrated fluorescence intensity is expressed as a percentage of control. N, number of cells: Control/N = 94, RTN3-KD/N = 105, Clathrin-KD/N = 111, RTN3/Clathrin-KD/N = 94 (n = 2). e HeLa PM-GCaMP6f cells were subjected to the indicated KDs or a mock control, and stimulated or not with HGF (250 ng/ml). Fluorescence was monitored; results are presented as the ratio of emission at 490/406 nm. Left, representative single-cell response curves. Right, area under the curve (AUC). -HGF/N = 10, Control/N = 37, RTN3-KD/N = 32, MCU-KD/N = 30, IP3R-KD/N = 30 (n = 1). f TMRM fluorescence was measured in HeLa cells subjected to the indicated KDs or a mock control and stimulated with HGF (100 ng/ml, 5 min) after a 45-s recording period. Mock/unstimulated cells (-HGF), negative control. Left, representative traces. Right, total peak area. -HGF/N = 55, Control/N = 193, RTN3-KD/N = 219, RTN4-KD/N = 148, MCU-KD/N = 276, IP3R-KD/N = 199 (n = 1). Box plots (panels c-f) are defined as in Fig. 2f. Exact p-values (Each Pair Student’s t test, two-tailed) are shown; ns not significant, n biological replicates. Source data are provided as a Source Data file.
Fig. 5
Fig. 5. EGF-induced Ca2+ waves and mitochondrial ATP production are required for NCE execution.
a CD147 internalization was monitored in vivo by IF in HeLa cells subjected to the indicated KDs or mock control, stimulated with high dose Alexa-555-EGF. Cells were subjected to acid wash prior to fixation to remove membrane-bound antibodies. Left, representative IF images. Blue, DAPI. Bar, 10 µm. Right, quantification of CD147 fluorescence intensity expressed as % of control. N = number of cells: Control/N = 699, IP3R-KD/N = 673 (n = 8); Control/N = 258, MCU-KD/N = 239 (n = 5). b Internalization of CD147 and Alexa-555 EGF was monitored as in a in HeLa cells subjected to the indicated KDs, treated or not with OMY (1 μM). CD147 and Alexa-555-EGF fluorescence intensity is expressed as % of control. N = number of cells: Control/N = 222, Control+OMY/N = 217, Clathrin-KD/N = 201, ClathrinKD+OMY/N = 252 (n = 4); RTN3-KD/N = 106, RTN3-KD + OMY/N = 132 (n = 2). c HeLa cells transfected with PM-Luc, were treated or not with luciferin (100 μM). CD147 internalization was monitored as in a. Top, representative IF images, blue, DAPI. Bar, 10 µm. Bottom, CD147 fluorescence intensity expressed as % of control. N = number of cells: Control/N = 189, Control+Luciferin/N = 142 (n = 3); SNAP-Luc/N = 116, SNAP-Luc+Luciferin/N = 78 (n = 4). d, e EM morphometric analysis of the length of EGFR gold-positive TIs or CCPs in HeLa cells subjected to the indicated KDs or drug treatments. d Left, criteria used to assign TIs or CCPs as short or long. Right, quantification of the ratio of long vs. short NCE-TIs normalized to 100 μm length PM profiles, mean ± SD. N = cell profiles: Control/N = 70, MCU-KD/N = 39, Dyn-KD/N = 35, DMSO/N = 50, OMY/N = 56, XeC/N = 20 (n ≥ 2). e Quantification of the ratio of long vs. short CCPs normalized to 100 μm length PM profiles. N = cell profiles: Control/N = 70/n = 3; MCU-KD/N = 39/n = 2; Dyn-KD/N = 45/n = 3; DMSO/N = 46/n = 3; OMY/N = 56/n = 3; XeC/N = 20/n = 2. f HeLa cells were subjected to MCU KD or mock control and treated or not with histamine and/or succinate. CD147 internalization was monitored as in a. Quantification of CD147 fluorescence intensity expressed as % of control. N = number of cells: Control/N = 281, MCU-KD/N = 345, Histamine/N = 177, MCU-KD+Histamine/N = 264, Succinate/N = 169, MCU-KD+Succinate/N = 202, Histamine/Succinate/N = 225, MCU-KD+Histamine/Succinate/N = 230 (n = 3). Box plots (panels ac, f) are defined as in Fig. 2f. Exact p-values (Each Pair Student’s t test, two-tailed) are shown; ns not significant, n biological replicates. Source data are provided as a Source Data file.
Fig. 6
Fig. 6. Ca2+ and ATP are required for cortical actin cytoskeleton remodeling needed for the fission of NCE Tis.
a CD147 internalization was monitored in HeLa cells subjected to N-WASP-KD, RTN3-KD or treatment with CK666 and stimulated with high dose EGF. Left, representative IF images, CD147 (green), EGF (red), DAPI (blue), Bar, 10 µm. Right upper, quantification of relative CD147 fluorescence intensity expressed as % of control. N = number of cells: Control/N = 338 (n = 4); RTN3 = KD/N = 158, NWASP-KD/N = 237, CK666/N = 250 (n = 3). Right lower, Alexa647-Tf internalization was monitored for 8 min at 37 °C in HeLa cells treated as above. The data reported for RTN3 KD are the same as displayed in Fig. 4b. N=number of cells: Control/N = 246 (n = 6); RTN3-KD/N = 185, NWASP-KD/N = 276, CK666/N = 295 (n = 3). Box plots are defined as in Fig. 2f. b, c EM morphometric analysis of the length of EGFR gold-positive TIs (b) and CCPs (c) in HeLa cells subjected to dynamin KD (Dyn-KD) and/or treated with CK666. Data are expressed as Fig. 4d, mean ± SD; N = cell profiles. Control/N = 10, CK666/N = 10, Dyn-KD/N = 9, Dyn-KD/CK666/N = 10 (b); Control/N = 10, CK666/N = 10, Dyn-KD/N = 9, Dyn-KD/CK666/N = 10 (c); a representative experiment of n = 2 is shown. d Ratiometric analysis of membrane proximal actin (MPA) density. HeLa cells were subjected or not to RTN3 KD, followed by MPAct-mCherry and YFP-CaaX co-transfection, and stimulated with high or low EGF or left unstimulated (-EGF). Left, two representative images of the ratiometric analysis of MPA density (MPAct signal normalized over the CaaX PM marker). Bar, 10 μm. e Right, mean raw integrated fluorescence intensity ±SD is reported as a percentage relative to control cells. N = number of cells: -EGF/N = 424, LowEGF/N = 495, HighEGF/N = 568 (n = 7). f, g Ratiometric analysis of MPA density as in d, in HeLa cells subjected to the indicated KDs (f) or inhibitor treatments (g) and stimulated with high dose EGF. Data are expressed as mean ± SD. Inhibitors were present during the stimulation. N = number of cells: (f) -EGF/N = 316/n = 5, Control/N = 356/n = 5, RTN3-KD/N = 409/n = 5, RTN4-KD/N = 311/n = 4, NWASP-KD/N = 370/n = 4; (g) Control/N = 306, CK666/N = 228, XeC/N = 231, MCUi11/N = 232, OMY/N = 189 (n = 3). Exact p-values (Each pair Student’s t test, two-tailed) are shown in all panels; ns, not significant; n=biological replicates. Source data are provided as a Source Data file.
Fig. 7
Fig. 7. The EGFR-NCE multiorganelle platform mediates EGF-induced migration in keratinocytes.
a CD147 internalization in HaCaT cells subjected to the indicated KDs or mock transfection (Ctrl). Internalized CD147 was measured by IF after stimulation with high dose Alexa647-EGF for 12 min at 37 °C, as described in Fig. 4a. Mean integrated fluorescence intensity is reported as a percentage of the control cells. N = number of cells: Control/N = 301/n = 6, RTN3-KD/N = 97/n = 3, RTN4-KD/N = 179/n = 5, MCU-KD/N = 221/n = 4, IP3R-KD/N = 210/n = 4. b HaCaT cells expressing the Ca2+ sensor PM-GCaMP6f were stimulated with high or low EGF. Left, Representative single-cell Ca2+ response curves presented as the ratio of fluorescence emission at 490/406 nm. Right, AUC of the Ca2+ response. N=number of cells: High EGF/N = 17, Low EGF/N = 20 (n = 2). c Ca2+ response in HaCaT cells subjected to RTN3 or RTN4 KD or to mock transfection (Ctrl) and stimulated with high EGF dose as in b. AUC is shown. N = number of cells: Control/N = 18, RTN3-KD/N = 25, RTN4-KD/N = 14. A representative experiment of three independent replicates is shown. d ΔΨm in HaCaT cells stimulated or not with low or high EGF, measured using TMRM. Total peak area is reported. N=number of cells: -EGF/N = 206, Low EGF/N = 253, High EGF/N = 327. A representative experiment of n = 2 is shown. e Wound healing in sub-confluent HaCaT cells stimulated or not with low or high EGF was monitored by time-lapse video microscopy. Left, representative images at the indicated time points. Middle, distance covered by cells in the different conditions corrected to the baseline at t = 0. Right, wound closure velocity (μm/h) at t = 24 h is shown. N=number of cells: -EGF/N = 15, Low EGF/N = 23, HighEGF/N = 34 (n = 3). f Wound closure velocity (μm/h) in sub-confluent HaCaT cells stimulated with high EGF dose and subjected to RTN3 KD or the indicated treatments for 24 h. N = number of cells: Control/N = 98/n = 6, DMSO/N = 24/n = ), RTN3-KD/N = 40/n = 2, OMY/N = 44/n = 3, MCUi11/N = 22/n = 2, CK666/N = 28/n = 2, XeC/N = 30/n = 2). g Schematic showing the crosstalk between EGFR-NCE, ER, and mitochondria in controlling EGFR endocytosis, receptor fate and cell migration. Box plots in all panels are defined as in Fig. 2f. Exact p-values (each pair Student’s t-test, two-tailed) are shown; ns not significant, n biological replicates. Source data are provided as a Source Data file.

References

    1. Burgess AW. Regulation of signaling from the epidermal growth factor family. J. Phys. Chem. B. 2022;126:7475–7485. doi: 10.1021/acs.jpcb.2c04156. - DOI - PubMed
    1. Lemmon MA, Schlessinger J, Ferguson KM. The EGFR family: not so prototypical receptor tyrosine kinases. Cold Spring Harb. Perspect. Biol. 2014;6:a020768. doi: 10.1101/cshperspect.a020768. - DOI - PMC - PubMed
    1. Freed DM, et al. EGFR ligands differentially stabilize receptor dimers to specify signaling kinetics. Cell. 2017;171:683–695.e618. doi: 10.1016/j.cell.2017.09.017. - DOI - PMC - PubMed
    1. Wilson KJ, Gilmore JL, Foley J, Lemmon MA, Riese DJ., 2nd Functional selectivity of EGF family peptide growth factors: implications for cancer. Pharmacol. Ther. 2009;122:1–8. doi: 10.1016/j.pharmthera.2008.11.008. - DOI - PMC - PubMed
    1. Caldieri G, et al. Reticulon 3-dependent ER-PM contact sites control EGFR nonclathrin endocytosis. Science. 2017;356:617–624. doi: 10.1126/science.aah6152. - DOI - PMC - PubMed