. 2024 Jun 15;15(1):5114.
doi: 10.1038/s41467-024-48563-z.

Acoustic ejection mass spectrometry empowers ultra-fast protein biomarker quantification

Affiliations

Acoustic ejection mass spectrometry empowers ultra-fast protein biomarker quantification

Bart Van Puyvelde et al. Nat Commun. .

Abstract

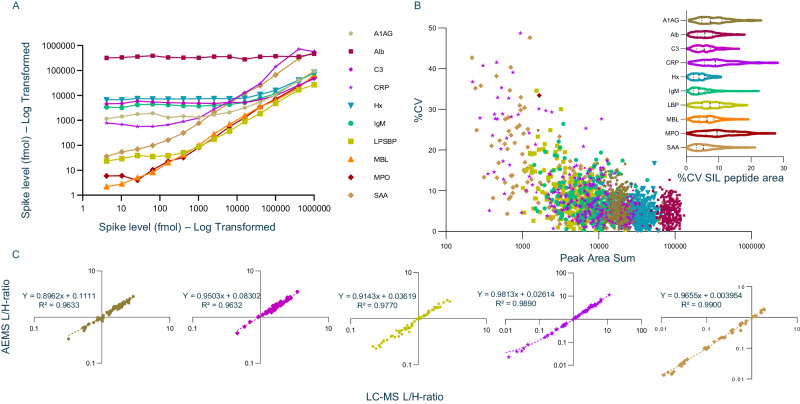
The global scientific response to COVID 19 highlighted the urgent need for increased throughput and capacity in bioanalytical laboratories, especially for the precise quantification of proteins that pertain to health and disease. Acoustic ejection mass spectrometry (AEMS) represents a much-needed paradigm shift for ultra-fast biomarker screening. Here, a quantitative AEMS assays is presented, employing peptide immunocapture to enrich (i) 10 acute phase response (APR) protein markers from plasma, and (ii) SARS-CoV-2 NCAP peptides from nasopharyngeal swabs. The APR proteins were quantified in 267 plasma samples, in triplicate in 4.8 h, with %CV from 4.2% to 10.5%. SARS-CoV-2 peptides were quantified in triplicate from 145 viral swabs in 10 min. This assay represents a 15-fold speed improvement over LC-MS, with instrument stability demonstrated across 10,000 peptide measurements. The combination of speed from AEMS and selectivity from peptide immunocapture enables ultra-high throughput, reproducible quantitative biomarker screening in very large cohorts.


Conflict of interest statement

The authors declare the following competing interest(s): C.L.H. was an employee of SCIEX. S.S. is an employee of Beckman Coulter Life Sciences. M.P., M.R. and L.A. are employees of SISCAPA Assay Technologies. The remaining Authors declare no competing interest.

Figures

Fig. 1
Fig. 1. High-throughput peptide quantification using peptide immunocapture on an Acoustic Ejection Mass Spectrometry (AEMS) platform.
A SISCAPA high affinity anti-peptide antibodies coupled to magnetic beads extensively purify peptide targets of interest from plasma and nasopharyngeal samples, which after acidic elution are ready for analysis by AEMS. In this study, the resulting data was used to monitor SARS-CoV-2 infection dynamics on two sample cohorts. Figure 1A, created with http://BioRender.com, released under a Creative Commons Attribution-NonCommercial-NoDerivs 4.0 International License. B In the first step of AEMS, ADE creates a standing wave in a sample well, and when the amplitude reaches a critical point, a single droplet is ejected. Sample volumes ranging from 2.5 nanoliters (nL) to hundreds of nL can be ejected with high reproducibility from a 384-well plate. This stream of droplets is captured in the Open Port interface (OPI) which is a pair of coaxial tubes, where carrier solvent flows through the outer tube and nebulizing gas draws the solvent through the inner tube to the electrospray ionization (ESI) source creating a solvent vortex. Acoustic ejection directs sample droplets into this vortex, facilitating rapid dilution and transfer to the mass spectrometer. Mass spectrometry at high acquisition rates is performed across the sharp ejection peaks for all samples from a 384-well plate, allowing a peptide to be quantified at a rate of 1–2 s per sample. Figure modified from Zhang et al..
Fig. 2
Fig. 2. Reproducibility of replicate AEMS peptide ejections over 5.25 h.
A The measurement of a peptide across 384 sample wells at the acquisition rate of 1.5 secs per well requires 10.5 min to acquire. B This measurement of the complete plate was repeated 30 times (acquiring 11490 sample ejections in total) and the peak area and peak area ratio percent coefficient of variation (%CV) were determined for each plate run. The %CV for the peak areas for the light and heavy peptides (Light AYNVTQAFGR (blue), heavy AYNVTQAFGR (orange)) were between 4.6 and 6.4% and the peak area ratios (summed L/H peak area ratio (green)) were between 6.2 and 7.2%.
Fig. 3
Fig. 3. Performance of AEMS for 10-plex APR assay.
A The dynamic range of the 10-plex APR was explored in pooled human plasma using a standard addition curve, spanning a range of almost > 1000000, highlighting their varying abundance levels and potential implications for physiological processes. B Reproducibility of endogenous peptide areas for the acute phase response peptide areas from plasma captures (n = 268). As expected, the reproducibility observed for the endogenous peptides from triplicate technical measurements correlates with the observed peptide area or abundance, with the higher abundance peptides showing very good reproducibility (<10%) and the less abundant, lower area peptides having more variance. Data was subjected to the outlier rejection strategy and rejected data points were not plotted. Inset shows the reproducibility of acute phase response SIL peptide areas from plasma captures, in a violin plot. Data are represented by the median, first and third quartiles, and range. The reproducibility of the SIL peptide for each enriched sample measured in triplicate was found to be very good, with average %CV values across the 267 measured samples between 4.2% and 10.5%. C Correlation of measured AEMS L/H peptide ratios with LC-MS data (n = 71) for the most biologically relevant acute phase response proteins, namely A1AG, C3, LBP, CRP and SAA. The ratios measured by LC-MS were very similar to the ratios determined using the Echo MS system. After outlier rejection, the slopes for all proteins were very close to 1 and the R² values were 0.96 and higher.
Fig. 4
Fig. 4. Measured ratios of the eight quantified acute phase response protein in plasma cohort (n = 268).
Samples were classified according to SARS-CoV-2 status (Positive/Negative) and disease severity (Supplementary table 8), then the light endogenous peptide ratio to the stable isotope labelled peptide was plotted (L/H ratio). Data are presented as following: minima, the smallest data point within 1.5 times the interquartile range (IQR) below the first quartile; maxima, the largest data point within 1.5 times the IQR above the third quartile; centre, the median of the dataset, representing the midpoint of the data; bounds of box, the lower and upper bounds of the box represent the first quartile and third quartile respectively, defining the IQR; whiskers, extending from the bounds of the box to the minimum and maximum values within 1.5 times the IQR from the first and third quartile respectively; and percentile, where Q1 represents the 25th percentile and Q3 represents the 75th percentile of the dataset. Four proteins were seen to increase in the disease samples (CRP, LBP, SAA, A1AG), and one protein (ALB) was found to decrease slightly in all disease samples. Figure 4, SARS-CoV-2 icon, created with http://BioRender.com, released under a Creative Commons Attribution-NonCommercial-NoDerivs 4.0 International License.
Fig. 5
Fig. 5. Evaluation of the SARS-CoV-2 NCAP assay with AEMS.
A Linearity of the average summed Light to Heavy (L/H) ratio with the spiked concentration of NCAP protein in Universal Transport Medium (UTM). B Overlay of the XIC of the three target peptides across samples with a prior dilution series in UTM and ending with a dilution series in ammonium bicarbonate (ABC). Each peak represents one patient sample. C Secondary axis plots of the raw measurements of E-gene Cycle threshold (Ct) (red dots) and AYNVTQAFGR logarithmically transformed MS Peak Area (Log2Area) (green bars) for results sorted from low to high Log2Area. A strong linear correlation illustrates the level of agreement between RT-qPCR and AEMS, with Log2Area flattening at 7.5 (green line), i.e. beyond Ct > 26 (red line). A high percent positive (PPA = TP/(TP + FN)) and negative agreement (PNA = TN/(TN + FP)) between RT-qPCR (Ct) and MS (AYN Log2Area) is achieved, especially below Ct 26.

References

    1. Nakayasu ES, et al. Tutorial: best practices and considerations for mass-spectrometry-based protein biomarker discovery and validation. Nat. Protoc. 2021 16:8. 2021;16:3737–3760. - PMC - PubMed
    1. Thomas SN, French D, Jannetto PJ, Rappold BA, Clarke WA. Liquid chromatography–tandem mass spectrometry for clinical diagnostics. Nat. Rev. Methods Prim. 2022;2:96. doi: 10.1038/s43586-022-00175-x. - DOI - PMC - PubMed
    1. Shen B, et al. Proteomic and metabolomic characterization of COVID-19 patient sera. Cell. 2020;182:59–72.e15. doi: 10.1016/j.cell.2020.05.032. - DOI - PMC - PubMed
    1. Messner CB, et al. Ultra-high-throughput clinical proteomics reveals classifiers of COVID-19 infection. Cell Syst. 2020;11:11–24.e4. doi: 10.1016/j.cels.2020.05.012. - DOI - PMC - PubMed
    1. Viode A, et al. A simple, time- and cost-effective, high-throughput depletion strategy for deep plasma proteomics. Sci. Adv. 2023;9:eadf9717. doi: 10.1126/sciadv.adf9717. - DOI - PMC - PubMed