. 2024 Jun 15;15(1):5135.
doi: 10.1038/s41467-024-48870-5.

Deep cell phenotyping and spatial analysis of multiplexed imaging with TRACERx-PHLEX

Affiliations

Deep cell phenotyping and spatial analysis of multiplexed imaging with TRACERx-PHLEX

Alastair Magness et al. Nat Commun. .

Abstract

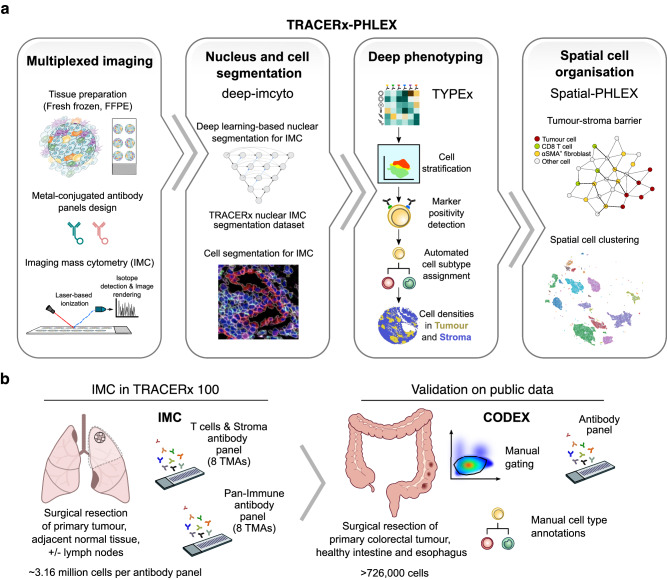
The growing scale and dimensionality of multiplexed imaging require reproducible and comprehensive yet user-friendly computational pipelines. TRACERx-PHLEX performs deep learning-based cell segmentation (deep-imcyto), automated cell-type annotation (TYPEx) and interpretable spatial analysis (Spatial-PHLEX) as three independent but interoperable modules. PHLEX generates single-cell identities, cell densities within tissue compartments, marker positivity calls and spatial metrics such as cellular barrier scores, along with summary graphs and spatial visualisations. PHLEX was developed using imaging mass cytometry (IMC) in the TRACERx study, validated using published Co-detection by indexing (CODEX), IMC and orthogonal data and benchmarked against state-of-the-art approaches. We evaluated its use on different tissue types, tissue fixation conditions, image sizes and antibody panels. As PHLEX is an automated and containerised Nextflow pipeline, manual assessment, programming skills or pathology expertise are not essential. PHLEX offers an end-to-end solution in a growing field of highly multiplexed data and provides clinically relevant insights.


Conflict of interest statement

C.S. acknowledges grant support from Bristol Myers Squibb related to this work and grants from AstraZeneca, Boehringer-Ingelheim, Pfizer, Roche-Ventana, Invitae, Ono Pharmaceutical, and Personalis outside of the submitted work. He is Chief Investigator for the AZ MeRmaiD 1 and 2 clinical trials and is the Steering Committee Chair. He is also Co-Chief Investigator of the NHS Galleri trial funded by GRAIL and a paid member of GRAIL’s Scientific Advisory Board. During the conduct of the study outside the submitted work, C.S. has received consultant fees from Achilles Therapeutics (also a SAB member), Bicycle Therapeutics (also a SAB member), Genentech, Medicxi, China Innovation Centre of Roche (CICoR) formerly Roche Innovation Centre—Shanghai, Metabomed (until July 2022), Relay Therapeutics SAB member, Saga Diagnostics SAB member and the Sarah Cannon Research Institute. Outside of the submitted work, C.S. has received honoraria from Amgen, AstraZeneca, Bristol Myers Squibb, GlaxoSmithKline, Illumina, MSD, Novartis, Pfizer, Medixci, and Roche-Ventana. C.S. has previously held stock options in Apogen Biotechnologies and GRAIL, and currently has stock options in Epic Bioscience, Bicycle Therapeutics, Relay Therapeutics, and has stock options and is co-founder of Achilles Therapeutics. C.S. declares a patent application (PCT/US2017/028013) for methods for lung cancer; targeting neoantigens (PCT/EP2016/059401); identifying patient response to immune checkpoint blockade (PCT/EP2016/071471); methods for lung cancer detection (US20190106751A1); identifying patients who respond to cancer treatment (PCT/GB2018/051912); determining HLA LOH (PCT/GB2018/052004); predicting survival rates of patients with cancer (PCT/GB2020/050221); methods for systems and tumour monitoring (PCT/EP2022/077987). C.S. is an inventor on a European patent application (PCT/GB2017/053289) relating to assay technology to detect tumour recurrence. This patent has been licensed to a commercial entity and under their terms of employment C.S. is due a revenue share of any revenue generated from such license(s). M.A. is a co-inventor on a European patent application (PCT/EP2020/059272) about methods for predicting and preventing cancer in patients with premalignant lesions. J.D. reports grants, personal fees, and nonfinancial support from AstraZeneca, personal fees from Bayer, Jubilant, Theras, BridgeBio, Vividion, Novartis, and grants and nonfinancial support from Bristol Myers Squibb and Revolution Medicines, outside the submitted work. E.S. has received funded research agreements from Merck Sharp Dohme, AstraZeneca and personal fees from Phenomic outside the submitted work. C.T.H. has received speaker fees from AstraZeneca, holds a paid advisory role for GenesisCare UK, research funding and support from Roche, AstraZeneca and Personalis. S.A.Q. reports other support from Achilles Therapeutics, grants from Roche, and Sairoopa outside the submitted work. J.L.R. reports speaker fees from Boehringer Ingelheim and GlaxoSmithKline, consults for Achilles Therapeutics Ltd and has filed patents for cancer early detection (PCT/EP2023/076521 and PCT/EP2023/076511). D.A.M. reports speaker fees from AstraZeneca and Takeda, consultancy fees from AstraZeneca, Thermo Fisher, Takeda, Amgen, Janssen, MIM Software, Bristol Myers Squibb and Eli Lilly and educational support from Takeda and Amgen. The remaining authors declare no competing interests.

Figures

Fig. 1
Fig. 1. TRACERx-PHLEX workflow overview and application in multiplexed imaging studies.
a PHLEX integrates three modules that cover the primary tasks in multiplexed imaging analysis: nucleus and cell segmentation (deep-imcyto), deep phenotyping (TYPEx) and spatial cell organisation analysis (Spatial-PHLEX). The module deep-imcyto performs image preprocessing, segmentation and image quality control. TYPEx annotates cell types and states on the basis of marker intensities. Spatial-PHLEX detects and quantifies spatial patterns in tissue organisation. b PHLEX was developed and applied on imaging mass cytometry (IMC) using resected tumour, lymph node and tumour-adjacent normal tissue from the TRACERx 100 cohort of patients with non-small cell lung cancer (NSCLC, n = 60 markers, 83 patients, 236 cores, ~3.16 million cells per antibody panel). Two antibody panels were profiled, a T cells & Stroma panel and a Pan-Immune panel. We validated PHLEX using orthogonal data within the TRACERx study and three public co-detection by indexing (CODEX) imaging datasets, which included manually curated cell type annotations. The colorectal cancer dataset also included manual gating information (Schürch et al., n = 56 markers, 140 TMA cores from 35 CRC patients). The datasets from Barrett’s oesophagus (Brbić et al.) and healthy intestine (HuBMAP) included fresh frozen, whole-slide tissue sections (n = 44–48 markers, >726,000 cells). FFPE formalin-fixed paraffin-embedded, TMA tissue microarray.
Fig. 2
Fig. 2. The deep-imcyto segmentation pipeline for IMC images.
a Overview of the processing workflows available in deep-imcyto: QC, simple segmentation and CellProfiler segmentation. b Example standard image outputs of the deep-imcyto segmentation workflows: [1] nuclear and whole-cell segmentation masks for input IMC images, [2] preprocessed channel images, [3] pseudo-H&E images constructed from intensity projected IMC channel data. The whole-cell segmentation mask was generated using deep-imcyto in simple mode. The cell outlines were overlaid on an IMC composite image (red pancytokeratin, green CD8a, cyan CD45, blue DNA, magenta CD4, yellow CD31/ɑSMA). c Single cell spatial plots produced by the deep-imcyto simple workflow give the user a quick look at the spatial distribution of all markers in their experiment. All markers are normalised independently per image for visualisation purposes. H&E haematoxylin and eosin.
Fig. 3
Fig. 3. Automated deep cell phenotyping from multiplexed imaging using TYPEx.
a Using a cell-by-marker intensity matrix and cell-type defining config file as input, TYPEx performs four steps: cell stratification through combination of existing methods (1–3), marker positivity detection, cell-type assignment and tissue segmentation. b To determine marker positivity, each cluster derived from the cell-stratification step is compared pairwise with all other clusters, and for each marker, the probability that a random cell from the given cluster has a higher intensity of that marker than cells from another cluster is calculated. Examples of probability distributions for a cluster A expressing a given marker (top left) and a cluster B that does not express that marker (top right) are illustrated. The D-score represents the maximum positive distance from the cumulative to the background distribution (bottom). c For each confidence group and across all possible D-score cutoffs (0–1 range, step 0.0001), the number of cells expressing a combination of user-provided markers is calculated. c illustrates an example for the high-confidence group in the T cells & Stroma panel using the default T-cell markers, based on which, three types of T-cell populations are defined: rare, dominant, and variable (vary depending on the dataset). The optimal cutoff minimises the rare (left) and maximises the dominant (right) T-cell subpopulations. d The ratio of rare to dominant T-cell populations against the range of D-score cutoffs. The cutoff range in which any of the dominant populations has zero cell count is not considered (grey area). At the lowest values of the D-score cutoff, the number of double-positive (CD3+/−)CD8a+CD4+ T cells and overall Ambiguous cells increases; as the D-score cutoff exceeds the optimal, the number of single-positive CD3CD8a+ T (overall Unassigned cells) increases. The optimal D-score cutoff, shown with a vertical black line (c, d), is determined individually for the low- and high-confidence groups in each study and panel. e To output cell densities, TYPEx uses a random forest classifier for tissue segmentation, a user-specific model, or binary masks of tissue domains as input. Source data are provided as a Source Data file.
Fig. 4
Fig. 4. Example image outputs from TYPEx in the TRACERx 100 IMC dataset.
TYPEx outputs various images for the user, examples of which are shown for two cases from the PHLEX test dataset (T cells & Stroma panel), including: a A map of cell objects coloured by cell subtype for each analysed sample. b, c For each major cell lineage marker, the samples with the highest cell counts are selected for visual inspection. The positive cell objects for a corresponding marker are overlaid onto a raw single-channel intensity image (b). Each cell object is visualised with a different colour. A raw single-channel intensity image for the markers in major cell lineage definitions is also provided (c). d Tissue segmentation masks based on tumour- and stroma-specific markers. The cell maps and overlays in a, b are generated when the mask of segmented cell objects is provided as input for TYPEx. Scatter plots of annotated cell objects are output as an alternative. LUAD lung adenocarcinoma, LUSC lung squamous cell carcinoma.
Fig. 5
Fig. 5. The Spatial-PHLEX analysis pipeline.
a Spatial-PHLEX runs multiple spatial analyses with simple input and minimal configuration. b Its density-based clustering workflow applies the DBSCAN and alpha shape algorithms to cell position data to find dense domains of a given cell type. Outputs include (i) intracluster densities of cell types, (ii) spatial cluster composition, (iii) distances of all cells to the boundary of the nearest cluster, with a negative distance assigned to cells within the spatial cluster and a positive distance to those outside, (iv) masks for clusters, and (v) overlap metrics for spatial clusters of different cell types. c Conceptual overview of Spatial-PHLEX barrier scoring and the concept of barrier fibroblasts between CD8 T cells and tumour. bottom, Illustrative barrier quantification from a shortest paths analysis. d Intracluster densities of cell types in CD8 T-cell spatial clusters in the TRACERx 100 cohort (Pan-Immune panel; n = 3878 clusters from n = 130 tumour cores, n = 2 benign tumour-adjacent cores). e Log10-transformed image-level median distance-to-nearest-epithelial-cell-cluster measurements for CD8 T cells in tumour versus normal tissue (n = 139 tumour, n = 46 normal cores). Two-tailed Wilcoxon p = 0.0045. f Quantification of immune cell cluster and tumour cell cluster co-localisation through Dice scoring (n = 136 tumour cores). Two-tailed Wilcoxon p values: CD4 T cells p = 0.006, B cells p = 1e-4. g Example low and high ɑSMA+ fibroblast barrier score cases. Scale bar = 150 µm. h Paired violin plots of barrier scores for CD8 T cells to non-tumour and tumour epithelial cells within the same tumour cores (n = 67 cores). Paired two-tailed Wilcoxon p value shown. i Spearman correlation of barrier score vs CD8 T-cell density in the lung tumour tissue compartment (n = 121 cores). All boxplots show median and lower and upper quartile values, and whiskers extend up to 1.5*IQR above and below quartiles. h, i The all-paths adjacent barrier fraction score and tumour cores from LUAD and LUSC histologies are used. P values are represented by: *p < 0.05, **p < 0.01, ***p < 0.001, ****p < 0.0001. No adjustments for multiple testing. Source data are provided as a Source Data file.
Fig. 6
Fig. 6. Evaluation of PHLEX segmentation performance compared to standard approaches.
a Instance segmentation similarity metric (Al-kofahi et al.), Dice, precision and recall scoring performance of deep-imcyto nuclear segmentation vs other publicly available methods: Mesmer, Cellpose, the Stardist “versatile” model and Stardist trained on DSBowl 2018 data, as well as a Stardist model retrained with the TRACERx nuclear IMC segmentation dataset (TRACERx NISD). Each score is calculated per image, and the test dataset covers 6453 nuclei across n = 16 TRACERx NISD images, which were not included in the training of any of the models. Significance values indicate the results of a two-tailed Mann–Whitney U test. b Heatmap summary of the mean segmentation performance of each metric shown in Supplementary Fig. 8. Upper panel shows scores, where higher values indicate superior performance. The lower two panels show scores, where a lower value is indicative of a better performance. *Bijective cardinality was normalised by the total possible number of correct detections in the test dataset. c Qualitative comparison between the deep-imcyto simple segmentation workflow (1 pixel dilation) and Mesmer, as well as the MCCS procedure run in deep-imcyto’s CellProfiler mode. All methods perform well at identifying cellular material; however, MCCS captures challenging cell morphologies and identifies non-nucleated stromal cell content (ɑSMA - putative fibroblasts in yellow and CD31 - endothelial cells in teal). Five example tiles from five different tissue cores (three tumour, one benign tumour-adjacent, one lymph node) from the TRACERx 100 study (T cells & Stroma antibody panel). All tiles are 256 × 256 µm, scale bar = 75 µm. Box plots in (a) show lower and upper quartile values, and whiskers extend up to 1.5*IQR above and below the quartiles. Source data are provided as a Source Data file.
Fig. 7
Fig. 7. Evaluation of TYPEx performance in cell phenotyping and benchmarking against alternative approaches.
ac Validation of TYPEx using orthogonal TRACERx data. Correlation of whole-exome sequencing (WES)-derived T-cell percentages calculated using T cell ExTRECT with the IMC-derived T-cell percentage on paired regional TMA tumour cores (a). Correlation of immunochemistry (IHC)-derived CD3+ cells with the T-cell density in the stromal area (b) or the proportion of T cells over all cells in the intraepithelial area (c) detected from IMC on paired regional TMA cores (T cells & Stroma panel). d Comparison of cell densities calculated with TYPEx between two antibody panels from serial tissue sections within the TRACERx 100 cohort. The heatmap shows Spearman correlation coefficients between cell densities of markers and samples profiled with the Pan-Immune and T cells & Stroma panels. e Cell subtype annotations from TYPEx and published manually adjusted annotations from X-shift were correlated with the cell counts of annotations derived from manual gating in the CRC CODEX dataset (Spearman correlation). f Comparison of clustering approaches with TYPEx with and without the stratification by confidence step (no strat). The fraction of Ambiguous and Unassigned cells in TRACERx 100 IMC (left) and CODEX (right) data were annotated according to the D score-derived positivity or published cell annotations (Schürch et al.). g The fraction of double-positive T cells derived from TYPEx compared to the three clustering approaches in the TRACERx 100 IMC cohort (n = 275 cores, T cells & Stroma panel). h Performance metrics F1-scores per cell subtype on the CRC CODEX dataset (n = 70 cores/TMA). CELESTA metrics on the TMA A cores were derived from a published confusion matrix (Zhang et al.). Dashed lines show the macro F1-scores across cell subtypes for each method. i Performance metrics F1-scores per cell subtype on Barrett’s oesophagus (BE) CODEX data. j, Macro F1-scores for the three validation datasets. STELLAR scores were published previously (Brbić et al.). ac represents Spearman correlation coefficient with unadjusted p values. Source data are provided as a Source Data file. TILs tumour-infiltrating lymphocytes, H&E haematoxylin and eosin, CRC colorectal cancer, WSI whole-slide image.

References

    1. Dries R, et al. Giotto: a toolbox for integrative analysis and visualization of spatial expression data. Genome Biol. 2021;22:78. doi: 10.1186/s13059-021-02286-2. - DOI - PMC - PubMed
    1. Windhager J, et al. An end-to-end workflow for multiplexed image processing and analysis. Nat. Protoc. 2023;18:3565–3613. doi: 10.1038/s41596-023-00881-0. - DOI - PubMed
    1. Bortolomeazzi M, et al. A SIMPLI (Single-cell Identification from MultiPLexed Images) approach for spatially-resolved tissue phenotyping at single-cell resolution. Nat. Commun. 2022;13:781. doi: 10.1038/s41467-022-28470-x. - DOI - PMC - PubMed
    1. Schapiro D, et al. MCMICRO: a scalable, modular image-processing pipeline for multiplexed tissue imaging. Nat. Methods. 2022;19:311–315. doi: 10.1038/s41592-021-01308-y. - DOI - PMC - PubMed
    1. Zhang W, et al. Identification of cell types in multiplexed in situ images by combining protein expression and spatial information using CELESTA. Nat. Methods. 2022;19:759–769. doi: 10.1038/s41592-022-01498-z. - DOI - PMC - PubMed