. 2024 Jun 15;15(1):5115.
doi: 10.1038/s41467-024-49298-7.

G6PD and ACSL3 are synthetic lethal partners of NF2 in Schwann cells

Affiliations

G6PD and ACSL3 are synthetic lethal partners of NF2 in Schwann cells

Athena Kyrkou et al. Nat Commun. .

Abstract

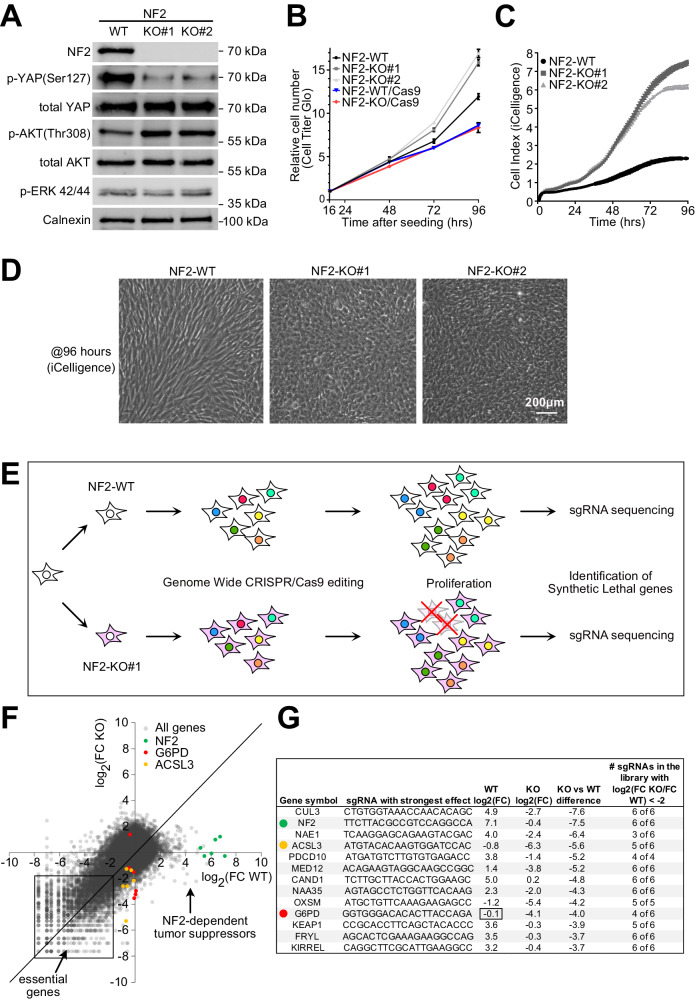
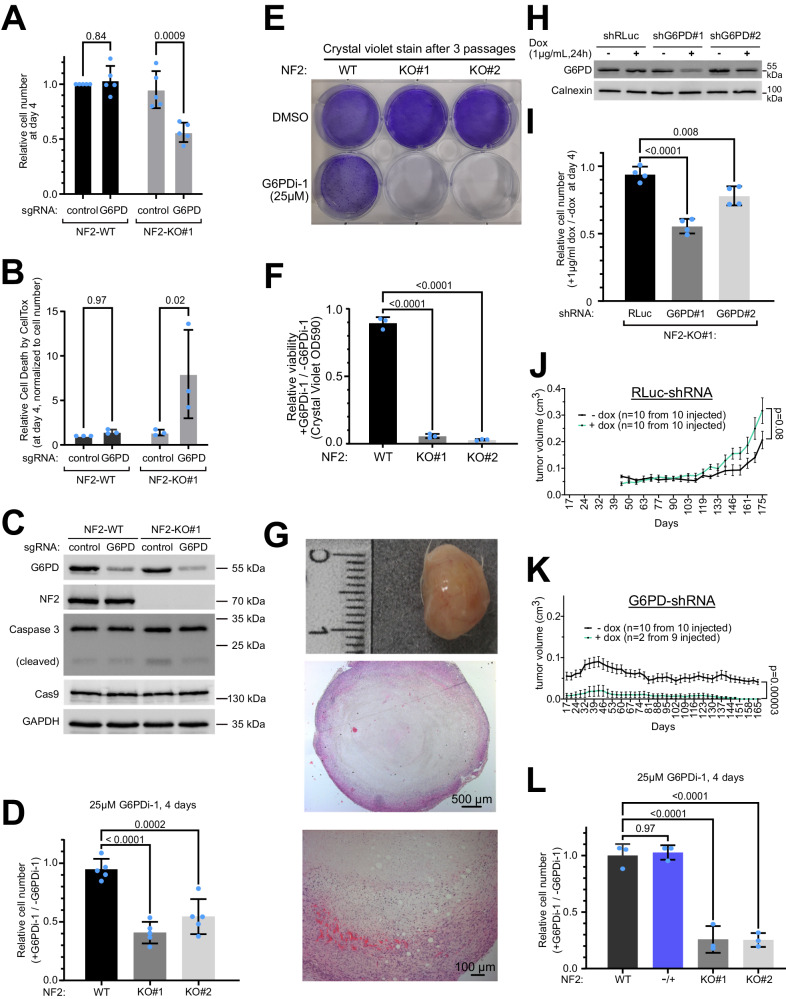
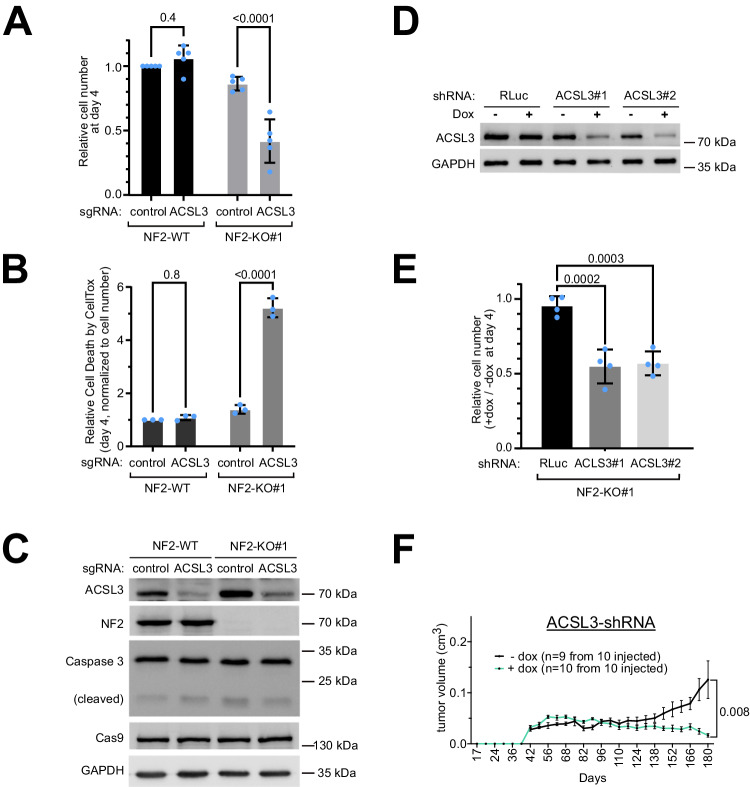
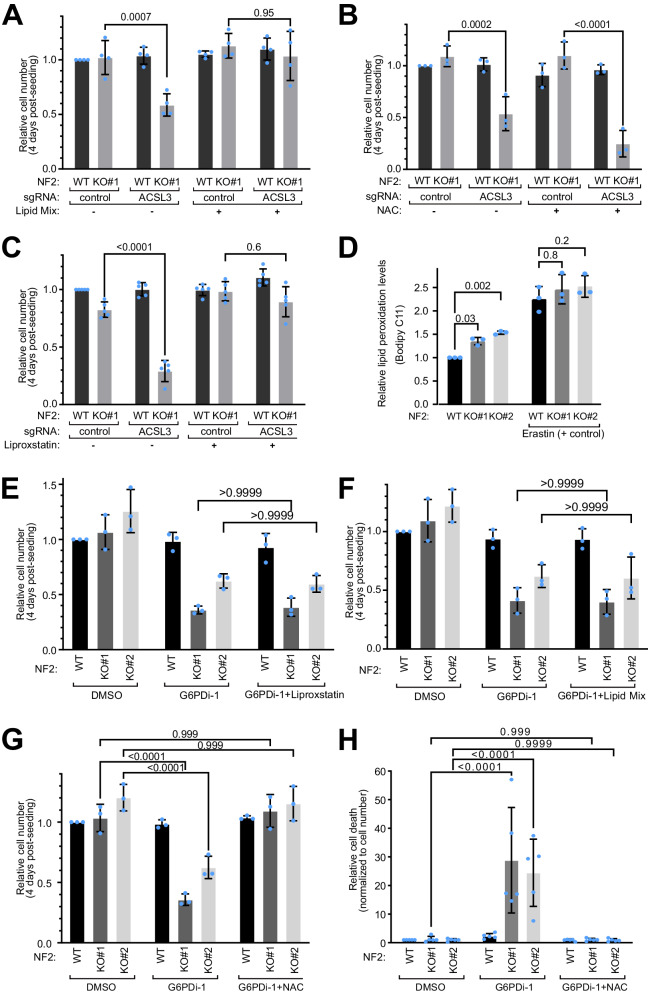
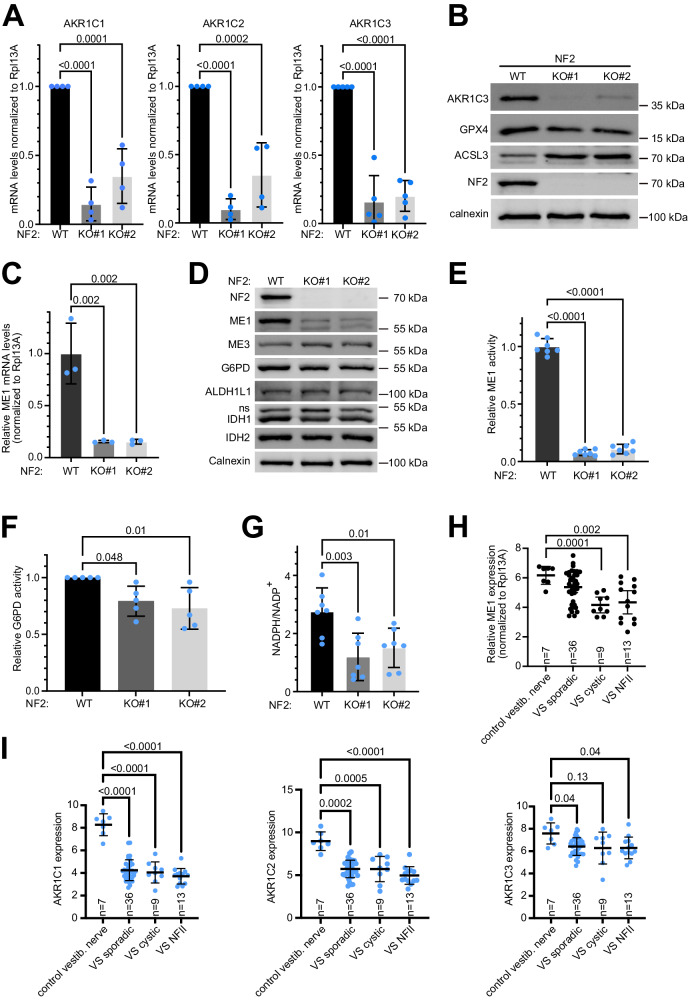
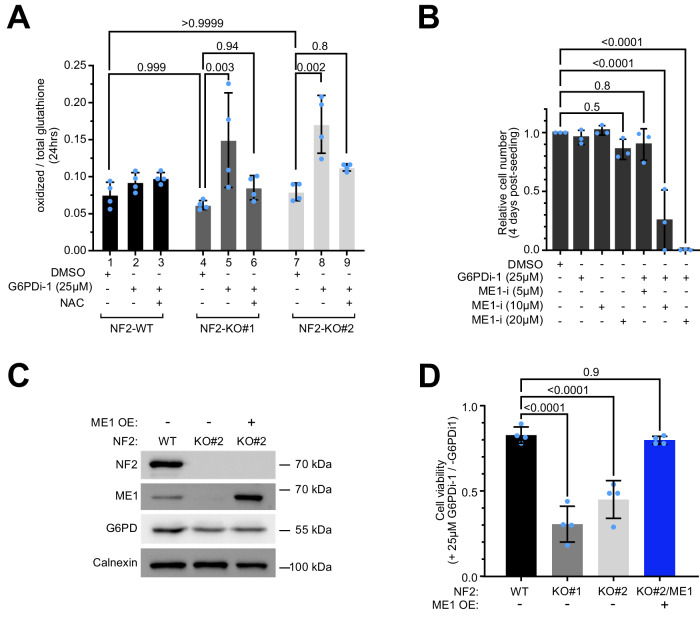
Neurofibromatosis Type II (NFII) is a genetic condition caused by loss of the NF2 gene, resulting in activation of the YAP/TAZ pathway and recurrent Schwann cell tumors, as well as meningiomas and ependymomas. Unfortunately, few pharmacological options are available for NFII. Here, we undertake a genome-wide CRISPR/Cas9 screen to search for synthetic-lethal genes that, when inhibited, cause death of NF2 mutant Schwann cells but not NF2 wildtype cells. We identify ACSL3 and G6PD as two synthetic-lethal partners for NF2, both involved in lipid biogenesis and cellular redox. We find that NF2 mutant Schwann cells are more oxidized than control cells, in part due to reduced expression of genes involved in NADPH generation such as ME1. Since G6PD and ME1 redundantly generate cytosolic NADPH, lack of either one is compatible with cell viability, but not down-regulation of both. Since genetic deficiency for G6PD is tolerated in the human population, G6PD could be a good pharmacological target for NFII.


Conflict of interest statement

The authors declare no competing interests.

Figures

Fig. 1
Fig. 1. Synthetic lethality screen identifies G6PD and ACSL3 as NF2-synthetic-lethal genes.
A NF2 knockout (NF2-KO) cells have reduced YAP phosphorylation and elevated Akt phosphorylation. Western blot analysis of lysates from isogenic NF2 WT and KO human Schwann cell lines. pERK 42/44: pThr 202/pTyr204. B At low cell density (2500 cells/0.32cm2), NF2-KO cells proliferate at roughly the same rate as NF2-WT cells. Relative cell number measured by CellTiter-Glo. Results are shown as a fold-change relative to the first timepoint (16 hrs postseeding). n = 4 wells. Bars = mean ± SD. C NF2-KO cells are not contact inhibited compared to NF2 WT cells. Real-time, impedance-based (iCelligence) cell growth analysis of NF2 WT and KO isogenic Schwann cells starting at medium confluence (5000 cells/0.32cm2). n = 4 wells. Bars = mean ± SD. D At high confluence, NF2 KO Schwann cells are more packed and less elongated compared to NF2 WT cells. Images taken at full confluence (96 hrs timepoint from panel C). Representative of >20 experiments. E Schematic diagram of the genome-wide synthetic lethality screen to identify genes that are synthetic-lethal with NF2 loss-of-function. F Scatter plot of the abundance of each sgRNA from the library at passage 7 (endpoint) normalized to passage 0 for both NF2-WT (x-axis) and NF2-KO#1 (y-axis) cells. Each dot represents a single sgRNA, and abundance is calculated as the log2 Fold Change (FC) of passage 7 / passage 0. G Top hits showing a differential proliferative/viability effect in NF2 KO cells compared to NF2-WT cells. Source data are provided as a Source Data file.
Fig. 2
Fig. 2. Validation of NF2/G6PD synthetic lethality.
A–C sgRNA-mediated depletion of G6PD reduces the viability of NF2-KO but not NF2-WT cells. A Relative cell number 4 days after seeding (7 days postinfection), assessed by CellTiter-Glo. B Cell toxicity analyzed with CellTox, normalized to cell number. C Immunoblot to assess G6PD knock-out efficiency. Bars = mean ± SD. Significance by two-way ANOVA and Sidak’s multiple comparisons test. n = 5 (A) or 3 (B) independent experiments in biological quadruplicates. D Pharmacological inhibition of G6PD reduces the viability of NF2-KO but not NF2-WT Schwann cells. Bars = mean ± SD. Significance by one-way ANOVA and Dunnett’s multiple comparisons test. n = 5 biological replicates. E–F Pharmacological inhibition of G6PD strongly reduces viability of NF2-KO cells, as seen if the cells are passaged 3 times in the presence or absence of G6PDi-1. Passaging prevents wild-type cells from reaching confluence and no longer proliferating. Cells stained with crystal violet. E Representative image. F Significance by one-way ANOVA and Dunnett’s multiple comparisons test. n = 3 biological replicates. Bars = mean ± SD. G NF2-KO Schwann cells form tumors when implanted subcutaneously in NOD SCID gamma mice. Top panel: the macroscopic image of the excised tumor. Middle & bottom panels: hematoxylin and eosin stained tumor at two different magnifications. Representative of 10 tumors. H–I G6PD knockdown with shRNAs impairs the viability of NF2 KO cells. H Immunoblot control of G6PD knockdown. I Relative cell number 4 days after induction of control or G6PD shRNA, each compared to non-induced controls (DMSO). Bars = mean ± SD. Significance by one-way ANOVA and Dunnett’s multiple comparisons test. n = 4 biological replicates. J–K G6PD knockdown reduces the growth of NF2-KO Schwann cell tumor xenografts. Tumor volumes as a function of time of NSG mice injected subcutaneously and treated +/- Dox for 25 weeks. Renilla Luciferase (RLuc) shRNA = negative control. Animals were randomized into groups. Graphs show mean volumes; error bars=SEM. Significance by multiple unpaired t-test comparison analysis. L Inhibition of G6PD does not kill NF2-/+ heterozygous Schwann cells. Significance by one-way ANOVA and Dunnett’s multiple comparisons test. n = 3 biological replicates. Bars = mean ± SD Source data are provided as a Source Data file.
Fig. 3
Fig. 3. Validation of ACSL3/G6PD synthetic lethality.
A–C sgRNA-mediated depletion of ACSL3 causes reduced viability of NF2-KO cells but not NF2-WT cells. (A) Relative cell number 4 days after seeding (7 days post infection), assessed by CellTiter-Glo. Bars = mean ± SD. (B) Cell toxicity analyzed with CellTox. Values are normalized to total cell number (CellTiter-Glo). Bars = mean ± SD. C Representative control immunoblots to assess ACSL3 knock-out efficiency. AB Significance by two-way ANOVA and Sidak’s multiple comparisons test. n = 5 (A) or 3 (B) biological replicates. D–E Induction of ACSL3 knockdown with two different shRNAs impairs viability of NF2 KO cells. D Immunoblot control of ACSL3 knockdown upon Dox treatment (1 µg/mL for 24 hrs) of human Schwann cell lines stably transfected to carry indicated shRNAs. E Relative cell number 4 days after induction (1 μg/ml doxycycline) of control or ACSL3 shRNA, each compared to non-induced controls (DMSO). Bars = mean ± SD. Significance by one-way ANOVA and Dunnett’s multiple comparisons test. n = 4 biological replicates. F ACSL3 knockdown reduces growth of NF2-KO Schwann cell tumor xenografts. Tumor volume as a function of time of NSG mice injected subcutaneously with indicated Schwann cell lines and treated +/- Dox for 25 weeks. Animals were randomized into the +dox vs -dox groups. Graphs show mean volumes; error bars=SEM. Significance by multiple unpaired t-test comparison analysis. Source data are provided as a Source Data file.
Fig. 4
Fig. 4. Characterization of the synthetic lethality caused by G6PD or ACSL3.
A–B The synthetic lethality between ACSL3 and NF2 is rescued by treating cells with a lipid mix (1%) (A) but not by the antioxidant n-acetylcysteine (NAC, 1 mM) (B). Relative cell number (CellTiter-Glo) normalized to the control sgRNA for each condition. Bars = mean ± SD. Significance by two-way ANOVA and Tukey’s multiple comparisons test. n = 4 (A) or 3 (B) biological replicates. C Synthetic lethality of NF2 and ACSL3 is rescued by Liproxstatin. Relative cell number (CellTiter-Glo) upon treatment with the ferroptosis inhibitor Liproxstatin. Values are normalized to control sgRNA. Bars = mean ± SD. Statistical analysis shown is a two-way ANOVA and Tukey’s multiple comparisons test; n = 5 biological replicates. D NF2 knockout Schwann cells have mildly elevated lipid peroxidation levels, assessed using BODIPY 581/591 C11 and flow cytometry. Ratio of oxidized/reduced lipids were normalized to untreated NF2-WT background levels. Erastin treatment (10μM-5hrs) was used as a positive control for lipid peroxidation. Bars = mean ± SD. Significance by two-way ANOVA and Tukey’s multiple comparisons test. n = 3 biological replicates. E–G The synthetic lethality between NF2 and G6PD is rescued by (G) the antioxidant n-acetylcysteine (NAC, 1 mM), but not by (E) Liproxstatin (1 μM), or by (F) supplementation with 1% Lipid Mix. Relative cell numbers, normalized to the DMSO control treatment condition, assayed by CellTiter-Glo. G6PDi-1 used at 25 µM. Bars = means ± SD. Significance by two-way ANOVA and Tukey’s multiple comparisons test. n = 3 biological replicates. H G6PDi-1 induces cell death (assayed by CellTox) in NF2-KO Schwann cells, and is rescued by NAC. Cell death values are normalized to cell number (CellTiter-Glo). Bars = mean ± SD. Significance by two-way ANOVA and Tukey’s multiple comparisons test. n = 5 independent experiments each with biological quadruplicates. Source data are provided as a Source Data file.
Fig. 5
Fig. 5. NF2-KO Schwann cells are more oxidized than control cells.
A NF2 KO Schwann cells have reduced AKR1C1, 2 and 3 mRNA levels compared to isogenic NF2-WT controls, assayed by Q-RT-PCR. Bars = mean ± SD. Dots = biological replicates. Significance by one-way ANOVA and Dunnett’s multiple comparisons test. n = 4 biological replicates B NF2 KO Schwann cells have reduced AKR1C3 and increased ACSL3 protein levels compare to isogenic NF2-WT controls. C NF2-KO Schwann cells have reduced ME1 mRNA levels, assayed by Q-RT-PCR, compared to NF2 WT isogenic controls. Bars = mean ± SD. n = 3 biological replicates, Significance by one-way ANOVA and Dunnett’s multiple comparisons test. D NF2-KO Schwann cells have reduced levels of ME1 protein compared to NF2-WT isogenic controls. E NF2-KO Schwann cells have reduced ME1 activity compared to NF2 WT isogenic controls. Bars = mean ± SD. n = 7 biological replicates. Significance by two-way ANOVA and Tukey’s multiple comparisons test. F NF2-KO Schwann cells have reduced G6PD activity compared to NF2 WT isogenic control cells. Bars = mean ± SD. Significance by one-way ANOVA and Dunnett’s multiple comparisons test. n = 5 biological replicates. G NF2-KO Schwann cells have a reduced NADPH/NADP+ ratio compared to isogenic controls. Dots = biological replicates. Bars = mean ± SD. Significance by one-way ANOVA and Dunnett’s multiple comparisons test. n = 8 biological replicates. H ME1 mRNA levels are significantly reduced in NF2 mutant and cystic vestibular schwannomas from patients compared to control vestibular nerve. Data are re-analyzed from. Dots = individual patients. Bars = mean ± SD Significance by Brown-Forsythe and Welch ANOVA and Dunnetts’s multiple comparisons test. I AKR1C1, 2 and 3 mRNA levels are consistently reduced in different types of vestibular schwannomas (VS: sporadic, cystic and NF2) compared to control vestibular nerve. Data are re-analyzed from. Dots = individual patients. Bars = mean ± SD. Significance by Brown-Forsythe and Welch ANOVA and Dunnetts’s multiple comparisons test. Source data are provided as a Source Data file.
Fig. 6
Fig. 6. NF2 and ME1 are synthetic lethal in Schwann cells.
A Relative oxidized glutathione levels are increased in NF2-KO Schwann cells after treatment with G6PDi-1 and rescued by n-acetylcysteine (NAC). Bars = mean ± SD. Significance by two-way ANOVA and Tukey’s multiple comparisons test. n = 4 biological replicates. B G6PD inhibition and ME1 inhibition display synthetic lethality in Schwann cells. Cell number (by CellTiter-Glo) of NF2-WT cells treated +/- G6PDi-1 + /- ME1 inhibitor, normalized to the non-treated DMSO condition. Bars = mean ± SD. Significance by one-way ANOVA and Dunnett’s multiple comparisons test. n = 3 biological replicates. C, D Re-expression of ME1 rescues the sensitivity of NF2-KO Schwann cells to G6PD inhibition. C Immunoblot of ME1 levels in NF2-WT cells, NF2-KO cells, and a monoclonal line of NF2-KO cells transfected to express ME1. D Relative cell numbers of the indicated cell lines 4 days after treatment with 25 µM G6PDi-1, normalized to untreated cells. Bars = mean ± SD. Significance by one-way ANOVA and Dunnett’s multiple comparisons test. n = 4 biological replicates. Source data are provided as a Source Data file.

References

    1. Evans DG. Neurofibromatosis type 2 (NF2): a clinical and molecular review. Orphanet J. Rare Dis. 2009;4:16. doi: 10.1186/1750-1172-4-16. - DOI - PMC - PubMed
    1. Petrilli AM, Fernandez-Valle C. Role of Merlin/NF2 inactivation in tumor biology. Oncogene. 2016;35:537–548. doi: 10.1038/onc.2015.125. - DOI - PMC - PubMed
    1. Baser ME. Contributors to the International NFMD. The distribution of constitutional and somatic mutations in the neurofibromatosis 2 gene. Hum. Mutat. 2006;27:297–306. doi: 10.1002/humu.20317. - DOI - PubMed
    1. Cumpston EC, Rhodes SD, Yates CW. Advances in Targeted Therapy for Neurofibromatosis Type 2 (NF2)-Associated Vestibular Schwannomas. Curr. Oncol. Rep. 2023;25:531–537. doi: 10.1007/s11912-023-01388-3. - DOI - PubMed
    1. Feltri ML, Weaver MR, Belin S, Poitelon Y. The Hippo pathway: Horizons for innovative treatments of peripheral nerve diseases. J. Peripher Nerv. Syst. 2021;26:4–16. doi: 10.1111/jns.12431. - DOI - PMC - PubMed