. 2024 Jun 15;15(1):5120.
doi: 10.1038/s41467-024-48951-5.

Kinetics and mapping of Ca-driven calmodulin conformations on skeletal and cardiac muscle ryanodine receptors

Affiliations

Kinetics and mapping of Ca-driven calmodulin conformations on skeletal and cardiac muscle ryanodine receptors

Robyn T Rebbeck et al. Nat Commun. .

Abstract

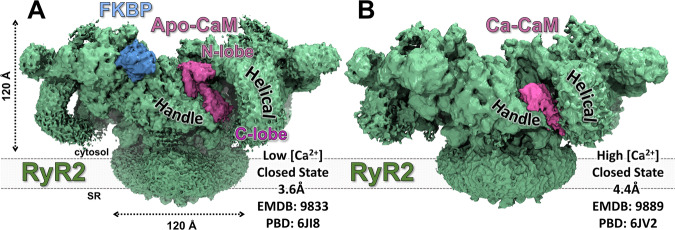
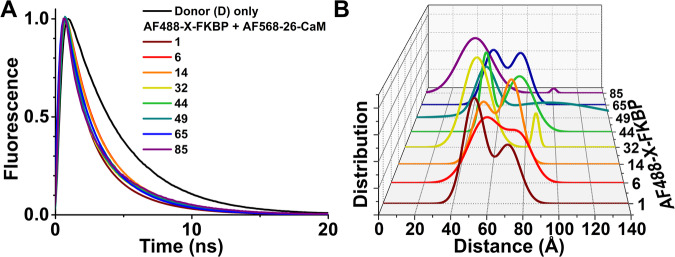
Calmodulin transduces [Ca2+] information regulating the rhythmic Ca2+ cycling between the sarcoplasmic reticulum and cytoplasm during contraction and relaxation in cardiac and skeletal muscle. However, the structural dynamics by which calmodulin modulates the sarcoplasmic reticulum Ca2+ release channel, the ryanodine receptor, at physiologically relevant [Ca2+] is unknown. Using fluorescence lifetime FRET, we resolve different structural states of calmodulin and Ca2+-driven shifts in the conformation of calmodulin bound to ryanodine receptor. Skeletal and cardiac ryanodine receptor isoforms show different calmodulin-ryanodine receptor conformations, as well as binding and structural kinetics with 0.2-ms resolution, which reflect different functional roles of calmodulin. These FRET methods provide insight into the physiological calmodulin-ryanodine receptor structural states, revealing additional distinct structural states that complement cryo-EM models that are based on less physiological conditions. This technology will drive future studies on pathological calmodulin-ryanodine receptor interactions and dynamics with other important ryanodine receptor bound modulators.


Conflict of interest statement

All authors declare no competing interests. R.L.C. is currently an employee of the National Institutes of Health. This work was conducted during his previous employment, at the University of Minnesota – Twin Cities. The opinions expressed in this article are the author’s own and do not reflect the view of the National Institutes of Health, the Department of Health and Human Services, or the United States government.

Figures

Fig. 1
Fig. 1. Cryo-EM maps of RyR2 reveal CaM binding to RyR2.
Ca-free (apo) and Ca-bound -states of CaM bind at distinct locations. A RyR2 (green) in a closed-pore state with FKBP12.6 (Light Blue) and apo-CaM (Purple) under EGTA conditions (< 0.2 nM Ca2+). B RyR2 in a closed-pore state with Ca-CaM bound at 20 μM Ca2+,.
Fig. 2
Fig. 2. Labeling and locations of FRET probes.
In silico predictions of the donor and acceptor fluorophore locations were conducted by simulated annealing for donors bound to FKBP, and by a method based on probability distributions for acceptors bound to CaM. Shown here are results for RyR2 (green) at low Ca2+ (EMDB: 9833, PDB: 6JI8). A The volume sampled by the fluorophore is shown as a pink bubble for the donor attached at FKBP residue 1. The average center position of the probe is shown as an orange sphere inside the pink bubble. The example CaM probe location is displayed as a pink bubble with the average acceptor location shown as a red sphere. B The predicted FRET distances from all donor-labeled sites on FKBP to acceptor-labeled site 26 in the N-lobe and site 99 in the C-lobe of CaM are shown with yellow and tan colored lines, respectively. The acceptor probe bound at CaM residue 110 is hidden behind the Handle domain.
Fig. 3
Fig. 3. Representative FLT-FRET detection of distance distributions between D-FKBP and A-CaM probes.
At 30 nM Ca2+, SR membranes from skeletal muscle were labeled with D-FKBP (AF488-X-FKBP; X = Cys mutation site for fluorescence labeling), and then incubated with 800 nM A-CaM (labeled with acceptor probe at the N-lobe residue T26C). For each label site on FKBP, site 1 is maroon, site 6 is red, site 14 is orange, site 32 is yellow, site 44 is green, site 49 is teal, site 65 is blue and site 85 is purple. A Representative FLT-detected waveforms for each of the eight different D-FKBP. These waveforms were acquired at least three times with similar results. B Multi-exponential analysis of FLT-FRET data yielded a two-distance Gaussian distribution model for the separation between D-FKBP and A-CaM within RyR1. Averaged data shown in Supplementary Fig. 3. These waveforms were acquired at least three times with similar results. Source data are provided as a Source Data file.
Fig. 4
Fig. 4. Location of trilaterated acceptor fluorophore loci on RyR1 and RyR2.
Cryo-EM maps of (A) RyR1 (EMDB: 8342, PDB: 5T15) and (B) RyR2 (EMDB: 9833, PDB: 6JI8) bound to the atomic structure of FKBP (orange), with trilaterated loci of AF568 attached to CaM residues as indicated. Trilaterated loci of probes bound to CaM in assay conditions containing 30 nM and 30 μM free Ca2+ are represented in blue and red, respectively. Trilaterated loci for probes bound to Ca2+ insensitive CaM (CaM1234) in assay conditions containing 30 nM and 30 μM free Ca2+ are represented in light blue and light red, respectively.
Fig. 5
Fig. 5. Kinetics of A-CaM binding to RyR1 and RyR2 in 30 nM and μM Ca2+.
SR membranes from porcine skeletal (brown) or cardiac (green) muscle were labeled with D-FKBP (AF488-85-FKBP), and then FLT time course was acquired after rapid (2 ms) mixing with 800 nM (final) A-CaM (AF568-26-CaM), in 30 nM Ca2+(dark brown for RyR1 and dark green for RyR2) or 30 μM Ca2+ (light brown for RyR1 and light green for RyR2). A Representative FRET time course following mixing. The FRET time courses were acquired in three independent experiments with similar results. B Amplitude-weighted average time constant from three-exponential analysis of FLT-FRET data for CaM binding to RyR1 or RyR2 at 30 nM or 30 μM Ca2+. Data is shown as mean (open square) ±SD, n = 3 individual experiments (filled circle) prepared on different days. Significance calculated using unpaired, two-way Student’s T test. Parameters from three-component fitting are shown in Supplementary Fig. 13. Source data are provided as a Source Data file.
Fig. 6
Fig. 6. Calcium-driven structural transitions of A-CaM bound to RyR1 or RyR2.
SR membranes from porcine skeletal and cardiac muscle were labeled with D-FKBP (AF488-85-FKBP), incubated with 1.6 μM A-CaM, and then FLT time course was acquired after rapid (2 ms) mixing with Ca2+ to increase [Ca2+] from 30 nM to μM (pink), or EGTA to decrease [Ca2+] from 30 μM to nM (green). Representative FLT waveforms are shown in Supplementary Fig. 14. A With A-CaM bound to RyR1, representative FLT-FRET time course following rapid [Ca2+] shift. FRET data for nM to μM Ca2+ transition fit best to two-exponential analysis with parameters shown in Supplementary Fig. 15. For μM to nM, Ca2+ transition fit best to one-exponential function. The FRET time courses were acquired in three independent experiments with similar results. B Averaged time constants per Ca2+ transition. Data shown as mean (closed diamond) ± SD, n = 3 individual (solid black diamond) experiments prepared on different days. Significance calculated using unpaired, two-way Student’s T test. C Schematic of structural transition of CaM (30 nM Ca2+ in blue, 30 μM Ca2+ in red) on RyR1 (light brown) relative to FKBP (light blue) based on PDBs 6JI8 and 6JV2, with time constants based on Ca2+-driven FRET shift. D With A-CaM bound to RyR2, representative FRET time courses following rapid [Ca2+] shift. For μM to nM, Ca2+ transition fits best to one-exponential fitting. The FRET time courses were acquired in three independent experiments with similar results. Within the first tenth of a second, FRET data for nM to μM Ca2+ transition was multiphasic, which was shown to be reproducible, as illustrated in the right panel, where each phase 10 ms, 10–30 ms and > 30 ms is indicated by numbers 1, 2 and 3, respectively. E Time constant for μM to nM Ca2+ transition for A-CaM bound to RyR2. Data are shown as mean (closed diamond) ± SD, n = 3 individual experiments (solid black diamond) prepared on different days. F Schematic of structural transition of CaM (30 nM Ca2+ in blue, 30 μM Ca2+ in red) on RyR2 (green) relative to FKBP (light blue) based on PDBs 6JI8 and 6JV2, with time constants based on Ca2+-driven FRET shift. Source data are provided as a Source Data file.
Fig. 7
Fig. 7. Overall Ca2+ driven structural transitions of A-CaM probe loci on RyR1 or RyR2.
The center of the trilaterated loci for AF568 probes bound to indicated CaM residues are shown as spheres, drawn in blue for nM Ca2+ (apo-CaM) and red for μM Ca2+ (Ca-CaM). The spheres are connected by lines to better show the shape of and change in rotation of sites in the lobes of CaM. A The cryo-EM density map of RyR1 is shown in brown. FKBP is shown as a ribbon representation in blue with the donor probe positions shown as orange spheres. A Ca2+ induced 180° rotation and a shift downward is observed in the N-lobe and a shift upward is observed in the C-lobe. B The cryo-EM density map of RyR2 is shown in green. FKBP is shown as a ribbon representation in light blue with the donor probe positions shown as orange spheres. A Ca2+ induced ~ 90° rotation is observed in the N-lobe and a minor shift upward is observed in the C-lobe. Arrows indicate the direction and rotation of structural shift between nM and μM Ca2+.

References

    1. des Georges A, et al. Structural basis for gating and activation of RyR1. Cell. 2016;167:145–157. doi: 10.1016/j.cell.2016.08.075. - DOI - PMC - PubMed
    1. Peng W, et al. Structural basis for the gating mechanism of the type 2 ryanodine receptor RyR2. Science. 2016;354:aah5324. doi: 10.1126/science.aah5324. - DOI - PubMed
    1. Woll KA, Haji-Ghassemi O, Van Petegem F. Pathological conformations of disease mutant Ryanodine Receptors revealed by cryo-EM. Nat. Commun. 2021;12:807. doi: 10.1038/s41467-021-21141-3. - DOI - PMC - PubMed
    1. Gong D, et al. Modulation of cardiac ryanodine receptor 2 by calmodulin. Nature. 2019;572:347–351. doi: 10.1038/s41586-019-1377-y. - DOI - PubMed
    1. Ma R, et al. Structural basis for diamide modulation of ryanodine receptor. Nat. Chem. Biol. 2020;16:1246–1254. doi: 10.1038/s41589-020-0627-5. - DOI - PubMed

MeSH terms