. 2024 Jun 15;10(1):116.
doi: 10.1038/s41531-024-00728-9.

Tau seeding activity in skin biopsy differentiates tauopathies from synucleinopathies

Affiliations

Tau seeding activity in skin biopsy differentiates tauopathies from synucleinopathies

Ilaria Linda Dellarole et al. NPJ Parkinsons Dis. .

Abstract

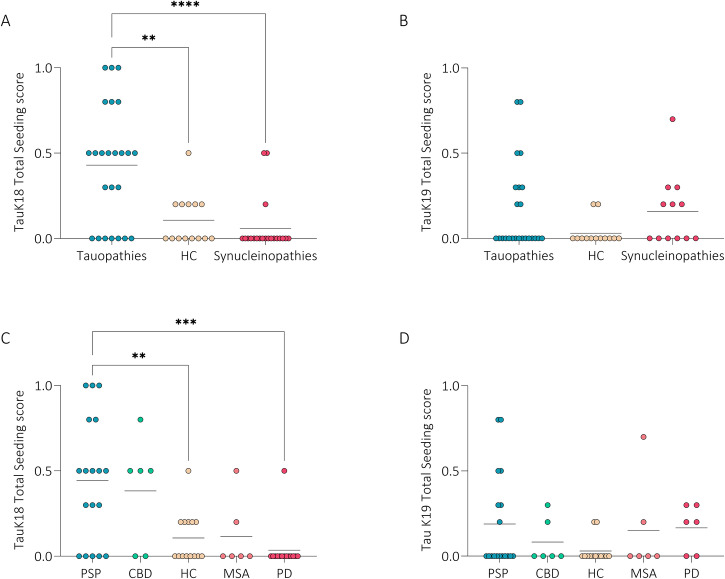
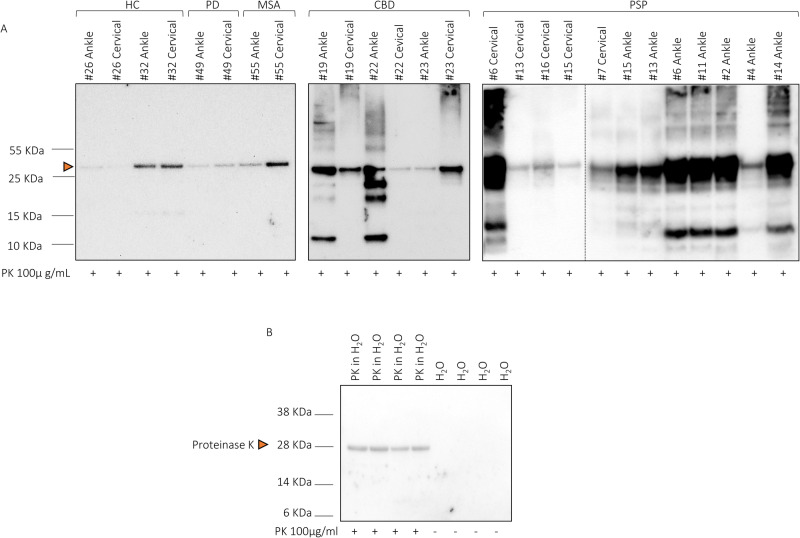
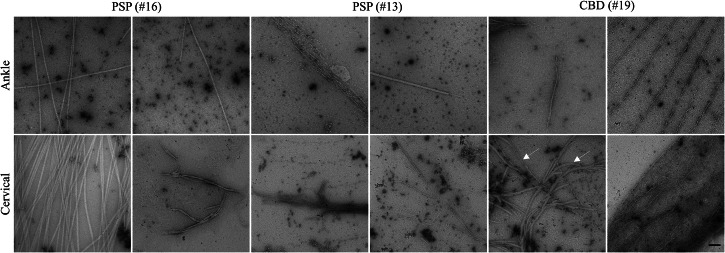
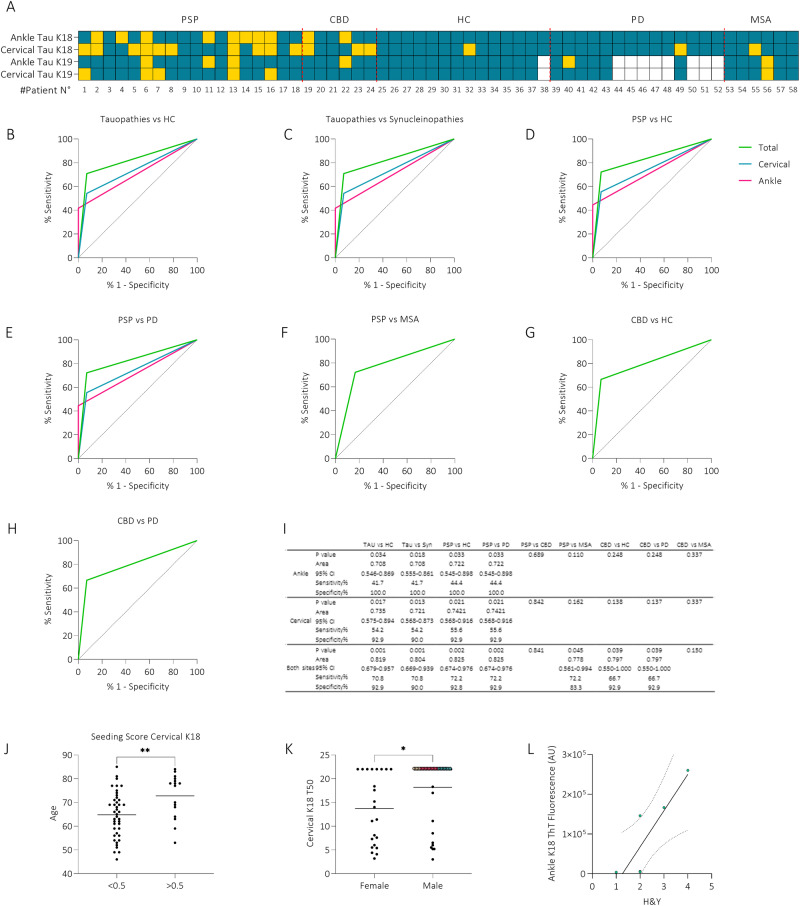
Most neurodegenerative diseases lack definitive diagnostic tests, and the identification of easily accessible and reliable biomarkers remains a critical unmet need. Since tau protein is highly expressed in skin of tauopathies patients, we aimed to exploit the ultrasensitive seeding activity assay (SAA) to assess tau seeding activity in skin of patients with tauopathies. In this multicentric, case-control study, patients with tauopathies and synucleinopathies were consecutively recruited and sex-matched to healthy controls (HC). Subjects underwent a double 3 mm skin biopsy in cervical area and ankle. Skin tau-SAA, using TauK18 and TauK19 as reaction substrates for 4R and 3R isoforms, seeding score, clinical scales, biochemical and morphological characterization of SAA end-products were evaluated. We analyzed 58 subjects: 24 tauopathies (18 progressive supranuclear palsy, PSP, and 6 corticobasal degeneration, CBD), 20 synucleinopathies (14 Parkinson's disease, PD, and 6 multiple system atrophy, MSA), and 14 HC. PSP and CBD showed higher tau seeding activity at both anatomical sites. A greater sensitivity of 4R-SAA than 3R-SAA was observed. 4R tau-SAA identified tauopathies with 71% sensitivity and 93% specificity. Accuracy was higher for PSP than CBD: PSP vs HC / PD (AUC 0.825), while CBD vs HC / PD (AUC 0.797), and PSP vs MSA (AU 0.778). SAA end-products showed differences in biochemical and morphological characterization according to the anatomical site. Skin tau-SAA identifies tauopathies with good accuracy and can be used to implement the in-vivo clinical diagnosis of patients with neurodegenerative diseases. Further characterization of peripheral tau seed in skin may elucidate the structure of tau deposits in brain.


Conflict of interest statement

The authors declare no competing interests.

Figures

Fig. 1
Fig. 1. TauK18- and TauK19-SAA analyses at ankle and cervical sites in tauopathies, synucleinopathies, and healthy controls.
Kinetic curves of TauK18 and TauK19 seeding activity in ankle (A, K) and cervical (F, P) sites, respectively. Each dot represents the mean (±SE) of the ThT fluorescence intensity of all samples tested per group against time. The dotted line indicates the selected threshold at 10.000 arbitrary units (AU). B, G, L, Q Scatter plot of final ThT fluorescence intensities: dots represent mean values of final ThT fluorescence intensity for individual patients and bars the mean of the group. C, H, M, R Box and Whisker Plot showing the Lag time defined as the reaction time required to pass the threshold of 10.000 AU. The dotted line shows the selected time points (7 h for TauK18 or 18 h for TauK19) to define the positive and negative subjects. D, I, N, S Box and Whisker Plot showing the T50, defined as the reaction time required to reach 50% of maximum fluorescence detected. E, J, O, T Seeding score defined as the number of replicates out of three that cross the threshold of 10.000 AU at 7 h. Each dot represents a patient and bars the mean of the group.
Fig. 2
Fig. 2. TauK18- and TauK19-SAA analyses at ankle and cervical sites in disease sub-groups.
Kinetic curves of TauK18 and TauK19 seeding activity in the ankle (A, K) and cervical (F, P) sites, respectively. Each dot represents the mean (±SE) of ThT fluorescence intensity of all samples tested per group against time. The dotted line indicates the selected threshold at 10.000 arbitrary units (AU). B, G, L, Q Scatter plot of final ThT fluorescence intensities: dots represent the mean values of the final ThT fluorescence intensity for individual patients and bars the mean of the group. C, H, M, R Box and Whisker Plot showing the Lag time defined as the reaction time required to pass the threshold of 10.000 AU. The dotted line shows the selected time points (7 h for TauK18 or 18 h for TauK19) to define the positive and negative subjects. D, I, N, S Box and Whisker Plot showing the T50 defined as the reaction time required to reach 50% of the maximum fluorescence detected. E, J, O, T Seeding score defined as the number of replicates out of three that cross the threshold of 10.000 AU at 7 h. Each dot represents a patient and bars the mean of the group.
Fig. 3
Fig. 3. Total seeding score.
Seeding score, defined as the number of positive replicates out of three for TauK18 and TauK19, considering the three main groups (A, B), or subgroups of diseases (C, D).
Fig. 4
Fig. 4. Western blot analysis of TauK18-SAA end-products after digestion with Proteinase K.
A Band profiles of representative cases in each disease group in ankle and cervical sites are shown. The head arrow indicates that the band at 28 kDa might be partially due to an unspecific signal of PK. B Technical control confirming PK unspecific signal at 28 KDa. Experiments were performed three times, and gels were processed in parallel.
Fig. 5
Fig. 5. TauK18-SAA end-products.
TEM images of TauK18-SAA end-products from ankle and cervical sites in PSP and CBD subjects. Arrows indicate different morphologies of tau fibrils within the same patient and anatomical site. Scale bar 100nm.
Fig. 6
Fig. 6. Diagnostic performance and correlation analysis.
A Heatmap showing positive (yellow) and negative (blue) patients analyzed with TauK18 and TauK19 in ankle and cervical sites. BH ROC curves analysis of TauK18 positivity/negativity in ankle (fuchsia), cervical (blue), and both sites (green). The referral line is reported in black. I The table provides the asymptotic significance, AUC with 95% CI, sensitivity, and specificity for each comparison. P-values < 0.05 were considered significant. J Box plot showing differences in age between subjects with seeding scores lower or higher than 0.5. Each dot represents a patient and bars the mean of the group. K Box plot showing differences in cervical TauK18 T50 between male and female subjects. Each dot represents a patient and bars the mean of the group. L Correlation between ankle TauK18 ThT fluorescence signal and H&Y in CBD (R = 0.865, P = 0.026, n = 6). The regression line is reported together with its 95% CI (dashed line).

References

    1. Vacchi, E., Kaelin-Lang, A. & Melli, G. Tau and Alpha Synuclein Synergistic Effect in Neurodegenerative Diseases: When the Periphery Is the Core. Int. J. Mol. Sci. 21, 10.3390/ijms21145030 (2020). - PMC - PubMed
    1. Zhang Y, Wu KM, Yang L, Dong Q, Yu JT. Tauopathies: new perspectives and challenges. Mol. Neurodegener. 2022;17:28. doi: 10.1186/s13024-022-00533-z. - DOI - PMC - PubMed
    1. Kovacs GG, Ghetti B, Goedert M. Classification of diseases with accumulation of Tau protein. Neuropathol. Appl Neurobiol. 2022;48:e12792. doi: 10.1111/nan.12792. - DOI - PMC - PubMed
    1. Combs B, Mueller RL, Morfini G, Brady ST, Kanaan NM. Tau and Axonal Transport Misregulation in Tauopathies. Adv. Exp. Med. Biol. 2019;1184:81–95. doi: 10.1007/978-981-32-9358-8_7. - DOI - PMC - PubMed
    1. Limorenko G, Lashuel HA. Revisiting the grammar of Tau aggregation and pathology formation: how new insights from brain pathology are shaping how we study and target Tauopathies. Chem. Soc. Rev. 2022;51:513–565. doi: 10.1039/D1CS00127B. - DOI - PubMed