

A versatile automated pipeline for quantifying virus infectivity by label-free light microscopy and artificial intelligence
- PMID: 38879641
- PMCID: PMC11180103
- DOI: 10.1038/s41467-024-49444-1
A versatile automated pipeline for quantifying virus infectivity by label-free light microscopy and artificial intelligence
Abstract
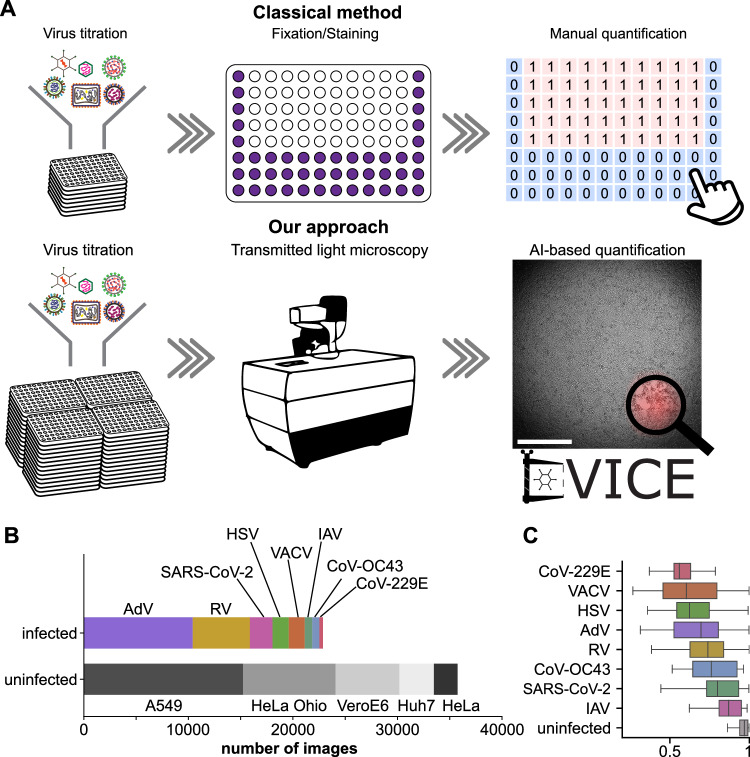
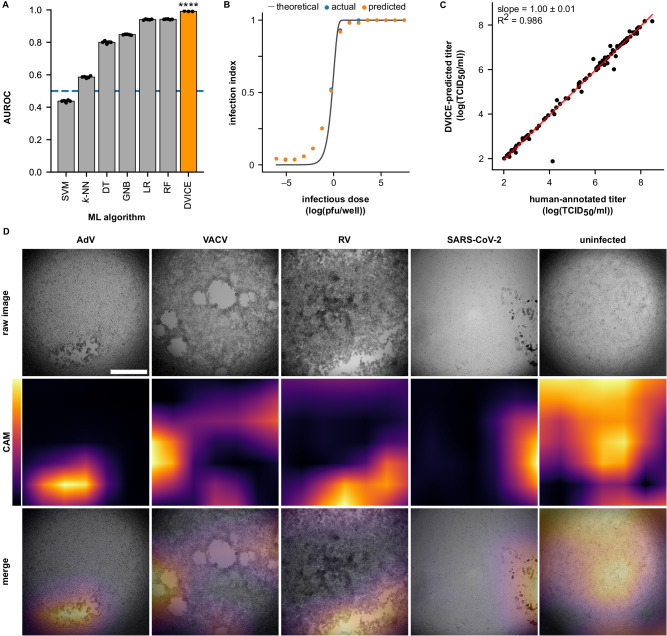
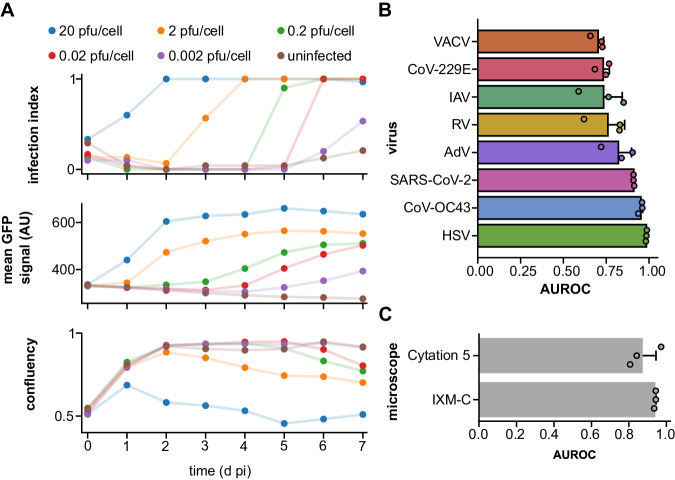
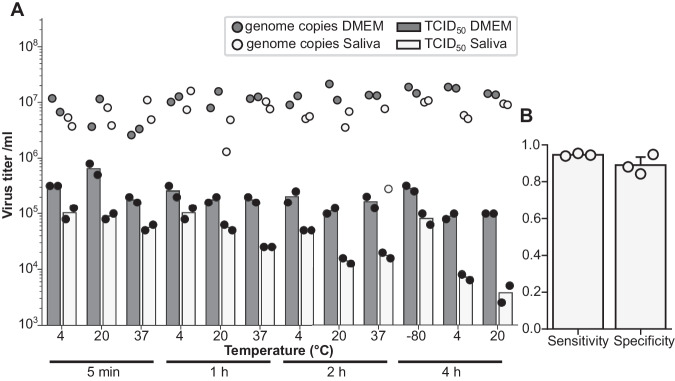
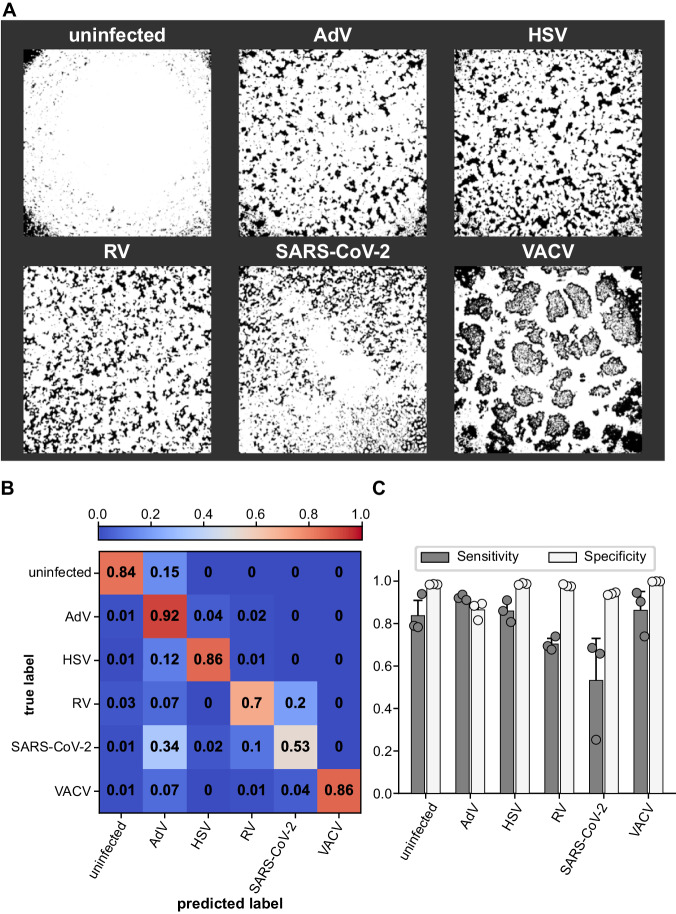
Virus infectivity is traditionally determined by endpoint titration in cell cultures, and requires complex processing steps and human annotation. Here we developed an artificial intelligence (AI)-powered automated framework for ready detection of virus-induced cytopathic effect (DVICE). DVICE uses the convolutional neural network EfficientNet-B0 and transmitted light microscopy images of infected cell cultures, including coronavirus, influenza virus, rhinovirus, herpes simplex virus, vaccinia virus, and adenovirus. DVICE robustly measures virus-induced cytopathic effects (CPE), as shown by class activation mapping. Leave-one-out cross-validation in different cell types demonstrates high accuracy for different viruses, including SARS-CoV-2 in human saliva. Strikingly, DVICE exhibits virus class specificity, as shown with adenovirus, herpesvirus, rhinovirus, vaccinia virus, and SARS-CoV-2. In sum, DVICE provides unbiased infectivity scores of infectious agents causing CPE, and can be adapted to laboratory diagnostics, drug screening, serum neutralization or clinical samples.
© 2024. The Author(s).
Conflict of interest statement
A.P., V.A., L.M., R.V., and U.F.G. filed a patent application, EP24168806.8, with the University of Zurich, entitled ‘Method for labeling an image of a plurality of cells as having or not having a virus-induced cytopathic effect’. The patent application includes training of computational models derived from ensembles of cells infected with different viruses and imaged under described modalities, involving equipment and laboratory settings, such that the models recognize virus type-specific infection features. Patent pending.
Figures
Similar articles
-
A web-based artificial intelligence system for label-free virus classification and detection of cytopathic effects.Sci Rep. 2025 Feb 18;15(1):5904. doi: 10.1038/s41598-025-89639-0. Sci Rep. 2025. PMID: 39966536 Free PMC article.
-
Median Tissue Culture Infectious Dose 50 (TCID50) Assay to Determine Infectivity of Cytopathic Viruses.Methods Mol Biol. 2024;2813:117-123. doi: 10.1007/978-1-0716-3890-3_8. Methods Mol Biol. 2024. PMID: 38888774
-
Label-Free Digital Holo-tomographic Microscopy Reveals Virus-Induced Cytopathic Effects in Live Cells.mSphere. 2018 Nov 21;3(6):e00599-18. doi: 10.1128/mSphereDirect.00599-18. mSphere. 2018. PMID: 30463927 Free PMC article.
-
Application of Artificial Intelligence to Address Issues Related to the COVID-19 Virus.SLAS Technol. 2021 Apr;26(2):123-126. doi: 10.1177/2472630320983813. Epub 2021 Jan 4. SLAS Technol. 2021. PMID: 33390088 Free PMC article. Review.
-
Machine learning for cross-scale microscopy of viruses.Cell Rep Methods. 2023 Sep 25;3(9):100557. doi: 10.1016/j.crmeth.2023.100557. Epub 2023 Aug 17. Cell Rep Methods. 2023. PMID: 37751685 Free PMC article. Review.
Cited by
-
Significance of Artificial Intelligence in the Study of Virus-Host Cell Interactions.Biomolecules. 2024 Jul 26;14(8):911. doi: 10.3390/biom14080911. Biomolecules. 2024. PMID: 39199298 Free PMC article. Review.
-
A web-based artificial intelligence system for label-free virus classification and detection of cytopathic effects.Sci Rep. 2025 Feb 18;15(1):5904. doi: 10.1038/s41598-025-89639-0. Sci Rep. 2025. PMID: 39966536 Free PMC article.
-
[Applications, challenges and a trustworthy use of artificial intelligence in public health].Bundesgesundheitsblatt Gesundheitsforschung Gesundheitsschutz. 2025 Aug;68(8):880-888. doi: 10.1007/s00103-025-04098-2. Epub 2025 Jul 2. Bundesgesundheitsblatt Gesundheitsforschung Gesundheitsschutz. 2025. PMID: 40600999 Free PMC article. Review. German.
-
A Benchmark for Virus Infection Reporter Virtual Staining in Fluorescence and Brightfield Microscopy.Sci Data. 2025 May 28;12(1):886. doi: 10.1038/s41597-025-05194-3. Sci Data. 2025. PMID: 40436865 Free PMC article.
References
MeSH terms
Grants and funding
LinkOut - more resources
Full Text Sources
Research Materials
Miscellaneous
