. 2024 Jun 15;14(1):13862.
doi: 10.1038/s41598-024-64586-4.

Disruption in glutathione metabolism and altered energy production in the liver and kidney after ischemic acute kidney injury in mice

Affiliations

Disruption in glutathione metabolism and altered energy production in the liver and kidney after ischemic acute kidney injury in mice

Peter R Baker 2nd et al. Sci Rep. .

Abstract

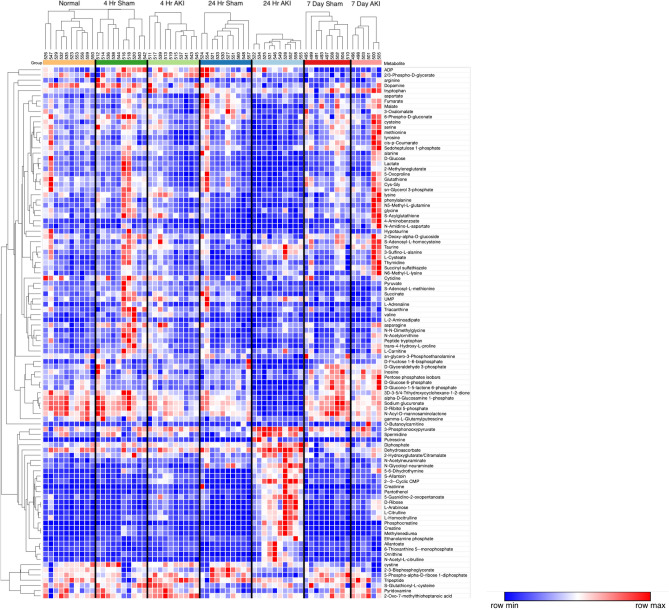
Acute kidney injury (AKI) is a systemic disease that affects energy metabolism in various remote organs in murine models of ischemic AKI. However, AKI-mediated effects in the liver have not been comprehensively assessed. After inducing ischemic AKI in 8-10-week-old, male C57BL/6 mice, mass spectrometry metabolomics revealed that the liver had the most distinct phenotype 24 h after AKI versus 4 h and 7 days. Follow up studies with in vivo [13C6]-glucose tracing on liver and kidney 24 h after AKI revealed 4 major findings: (1) increased flux through glycolysis and the tricarboxylic (TCA) cycle in both kidney and liver; (2) depleted hepatic glutathione levels and its intermediates despite unchanged level of reactive oxygen species, suggesting glutathione consumption exceeds production due to systemic oxidative stress after AKI; (3) hepatic ATP depletion despite unchanged rate of mitochondrial respiration, suggesting increased ATP consumption relative to production; (4) increased hepatic and renal urea cycle intermediates suggesting hypercatabolism and upregulation of the urea cycle independent of impaired renal clearance of nitrogenous waste. Taken together, this is the first study to describe the hepatic metabolome after ischemic AKI in a murine model and demonstrates that there is significant liver-kidney crosstalk after AKI.


Conflict of interest statement

The authors declare no competing interests.

Figures

Figure 1
Figure 1
Time course of AKI and hepatic effects after ischemic AKI. Wild type mice were examined 4 h, 24 h, and 7 days after sham surgery (Sham) and surgery to induce ischemic AKI (AKI). Normal mice were also studied. Renal function was assessed by (A) Serum creatinine and (B) Blood urea nitrogen (BUN) (The serum creatinine and BUN data from this cohort of mice have been previously published),. Hepatic effects were assessed by (C) Serum AST, (D) Serum ALT, (E) Liver glutathione (total) levels, and (F) Liver ATP. Data are mean ± SE; statistics by Student’s t-test comparing Sham versus AKI at each time point; n = 6–10 per group.
Figure 2
Figure 2
Liver MPO activity, histology, superoxide, and mitochondrial respiration after AKI. To assess whether AKI included liver inflammation, injury, elevated reactive oxygen species (ROS), or mitochondrial dysfunction, (A) liver MPO activity, (B, C) liver histology, (D) liver superoxide, and (E) mitochondrial respiration were assessed in the liver and were unchanged versus sham in all cases. In contrast, kidney mitochondrial superoxide increased, and kidney mitochondrial respiration was suppressed. Mitochondrial superoxide was assessed with electron paramagnetic resonance (EPR) spectroscopy. Mitochondrial function (O2 flux) was measured by the Oroboros O2K respirometer and the substrates added to the chamber are listed. Significant differences between mitochondrial oxygen consumption were found in the kidney using the substrates succinate, CCCP and rotenone, indicating a defect in complex II during AKI. Data are mean ± SE; statistics by Student’s t-test comparing Sham versus AKI at each time point; n = 6–10 per group, **p < 0.01.
Figure 3
Figure 3
Hierarchical clustering analysis (HCA) of liver metabolites. HCA with predefined sample clusters, was performed for the 102 metabolites that were significantly different among groups as judged by ANOVA (without post hoc testing) to determine trends for individual metabolites among experimental groups. Each column cluster represents an experimental cohort as labeled (Normal, 4-h sham, 4-h AKI, 24-h sham, 24-h AKI, 7-day sham and 7-day AKI), whereas each individual column represents an experimental mouse subject (Normal: n = 10, 2 4 h sham: n = 10, 4 h AKI: n = 10, 24 h sham: n = 10, 24 h AKI: n = 10, 7 day sham: n = 9, and 7 day AKI: n = 6). Each row represents a metabolite. To the right of each row is the corresponding metabolite name. Red represents increased metabolite level whereas blue represents decreased metabolite level. The correlation metric used was the Pearson (n-1) correlation with an average linkage method. The major effect observed is for the 24-h AKI group which is characterized by metabolites that are both relatively decreased versus other groups (in blue, upper 2/3 of heat map) as well as increased levels versus other groups (in red, lower 1/3 of heat map).
Figure 4
Figure 4
Pathway enrichment and flux analysis reveals that glycolysis, gluconeogenesis, and pentose phosphate pathway in the liver and kidney are impacted 24 h after AKI. (A) Pathway diagram including Glycolysis, Gluconeogenesis, and Pentose Phosphate Pathway, illustrating steady state and labeled carbon study results in liver. Metabolites higher (red) or lower (blue) in AKI versus Sham mouse livers at 24 h post-procedure. Analytes in gray were detectable but not significantly different in AKI versus Sham. Analytes in black were not detectable through metabolomic analysis. Differences found in labeled carbon studies are designated by §. (B) Labeled carbon study results for Glycolysis and Gluconeogenesis intermediates in liver and kidney. (C) Labeled carbon study results for Pentose Phosphate Pathway intermediates in liver and kidney. For (B) & (C), y-axes represent peak areas (arbitrary units). For both liver and kidney, n = 8 Sham, n = 8 AKI. P-value < 0.05 (*) in Sham vs AKI. Data can be found in Supplementary Tables S6 and S7, respectively.
Figure 4
Figure 4
Pathway enrichment and flux analysis reveals that glycolysis, gluconeogenesis, and pentose phosphate pathway in the liver and kidney are impacted 24 h after AKI. (A) Pathway diagram including Glycolysis, Gluconeogenesis, and Pentose Phosphate Pathway, illustrating steady state and labeled carbon study results in liver. Metabolites higher (red) or lower (blue) in AKI versus Sham mouse livers at 24 h post-procedure. Analytes in gray were detectable but not significantly different in AKI versus Sham. Analytes in black were not detectable through metabolomic analysis. Differences found in labeled carbon studies are designated by §. (B) Labeled carbon study results for Glycolysis and Gluconeogenesis intermediates in liver and kidney. (C) Labeled carbon study results for Pentose Phosphate Pathway intermediates in liver and kidney. For (B) & (C), y-axes represent peak areas (arbitrary units). For both liver and kidney, n = 8 Sham, n = 8 AKI. P-value < 0.05 (*) in Sham vs AKI. Data can be found in Supplementary Tables S6 and S7, respectively.
Figure 5
Figure 5
Pathway enrichment and flux analysis reveals that the TCA and urea cycles in the liver and kidney are impacted 24 h after AKI. (A) Pathway diagram including tricarboxylic acid (TCA) and urea cycles, illustrating steady state and labeled carbon study results in liver. Metabolites higher (red) or lower (blue) in AKI versus Sham mouse livers at 24 h post-procedure. Analytes in gray were detectable but not significantly different in AKI versus Sham. Analytes in black were not detectable through metabolomic analysis. Differences found in labeled carbon studies are designated by §. (B) Labeled carbon study results for TCA Intermediates in liver and kidney. (C) Labeled carbon study results for TCA-related Amino Acids in liver and kidney. For (B) and (C), y-axes represent peak areas (arbitrary units). For both liver and kidney, n = 8 Sham, n = 8 AKI. P-value < 0.05 (*) in Sham vs AKI. Data can be found in Supplementary Tables S6 and S7, respectively.
Figure 5
Figure 5
Pathway enrichment and flux analysis reveals that the TCA and urea cycles in the liver and kidney are impacted 24 h after AKI. (A) Pathway diagram including tricarboxylic acid (TCA) and urea cycles, illustrating steady state and labeled carbon study results in liver. Metabolites higher (red) or lower (blue) in AKI versus Sham mouse livers at 24 h post-procedure. Analytes in gray were detectable but not significantly different in AKI versus Sham. Analytes in black were not detectable through metabolomic analysis. Differences found in labeled carbon studies are designated by §. (B) Labeled carbon study results for TCA Intermediates in liver and kidney. (C) Labeled carbon study results for TCA-related Amino Acids in liver and kidney. For (B) and (C), y-axes represent peak areas (arbitrary units). For both liver and kidney, n = 8 Sham, n = 8 AKI. P-value < 0.05 (*) in Sham vs AKI. Data can be found in Supplementary Tables S6 and S7, respectively.
Figure 6
Figure 6
Glutathione is depleted in the liver and kidney 24 h after AKI, but the kidney has more glutathione intermediates available than the liver. (A) Pathway diagram including Cysteine and Glutathione Metabolism, illustrating steady state and labeled carbon study results in liver. Metabolites higher (red) or lower (blue) in AKI versus Sham mouse livers at 24 h post-procedure. Analytes in gray were detectable but not significantly different in AKI versus Sham. Analytes in black were not detectable through metabolomic analysis. Differences found in labeled carbon studies are designated by §. (B) Labeled carbon study results for Glutathione Intermediates, including Amino Acids and Dipeptides in liver and kidney. y-axes represent peak areas (arbitrary units). For both liver and kidney, n = 8 Sham, n = 8 AKI. P-value < 0.05 (*) in Sham vs AKI. Data can be found in Supplementary Tables S6 and S7, respectively.
Figure 6
Figure 6
Glutathione is depleted in the liver and kidney 24 h after AKI, but the kidney has more glutathione intermediates available than the liver. (A) Pathway diagram including Cysteine and Glutathione Metabolism, illustrating steady state and labeled carbon study results in liver. Metabolites higher (red) or lower (blue) in AKI versus Sham mouse livers at 24 h post-procedure. Analytes in gray were detectable but not significantly different in AKI versus Sham. Analytes in black were not detectable through metabolomic analysis. Differences found in labeled carbon studies are designated by §. (B) Labeled carbon study results for Glutathione Intermediates, including Amino Acids and Dipeptides in liver and kidney. y-axes represent peak areas (arbitrary units). For both liver and kidney, n = 8 Sham, n = 8 AKI. P-value < 0.05 (*) in Sham vs AKI. Data can be found in Supplementary Tables S6 and S7, respectively.
Figure 7
Figure 7
Comparison of affected metabolic pathways in the liver versus kidney 24 h after AKI. Venn diagram demonstrating similarities and differences in pathway enrichment in liver and kidney. Generally, enriched pathways demonstrated higher (red) or lower (blue) metabolite concentrations in AKI versus Sham at 24 h post-procedure.

References

    1. Uchino S, Bellomo R, Goldsmith D, Bates S, Ronco C. An assessment of the RIFLE criteria for acute renal failure in hospitalized patients. Crit. Care Med. 2006;34(7):1913–1917. doi: 10.1097/01.CCM.0000224227.70642.4F. - DOI - PubMed
    1. Faubel S, Shah PB. Immediate consequences of acute kidney injury: The impact of traditional and nontraditional complications on mortality in acute kidney injury. Adv. Chronic Kidney Dis. 2016;23(3):179–185. doi: 10.1053/j.ackd.2016.02.007. - DOI - PubMed
    1. Hassoun HT, et al. Ischemic acute kidney injury induces a distant organ functional and genomic response distinguishable from bilateral nephrectomy. Am. J. Physiol. Renal. Physiol. 2007;293(1):F30–40. doi: 10.1152/ajprenal.00023.2007. - DOI - PubMed
    1. Kramer AA, et al. Renal ischemia/reperfusion leads to macrophage-mediated increase in pulmonary vascular permeability. Kidney Int. 1999;55(6):2362–2367. doi: 10.1046/j.1523-1755.1999.00460.x. - DOI - PubMed
    1. Kelly KJ. Distant effects of experimental renal ischemia/reperfusion injury. J. Am. Soc. Nephrol. 2003;14(6):1549–1558. doi: 10.1097/01.ASN.0000064946.94590.46. - DOI - PubMed