. 2024 Oct;31(10):1349-1361.
doi: 10.1038/s41418-024-01325-2. Epub 2024 Jun 15.

Regulation of primary cilia disassembly through HUWE1-mediated TTBK2 degradation plays a crucial role in cerebellar development and medulloblastoma growth

Affiliations

Regulation of primary cilia disassembly through HUWE1-mediated TTBK2 degradation plays a crucial role in cerebellar development and medulloblastoma growth

I-Hsuan Lin et al. Cell Death Differ. 2024 Oct.

Abstract

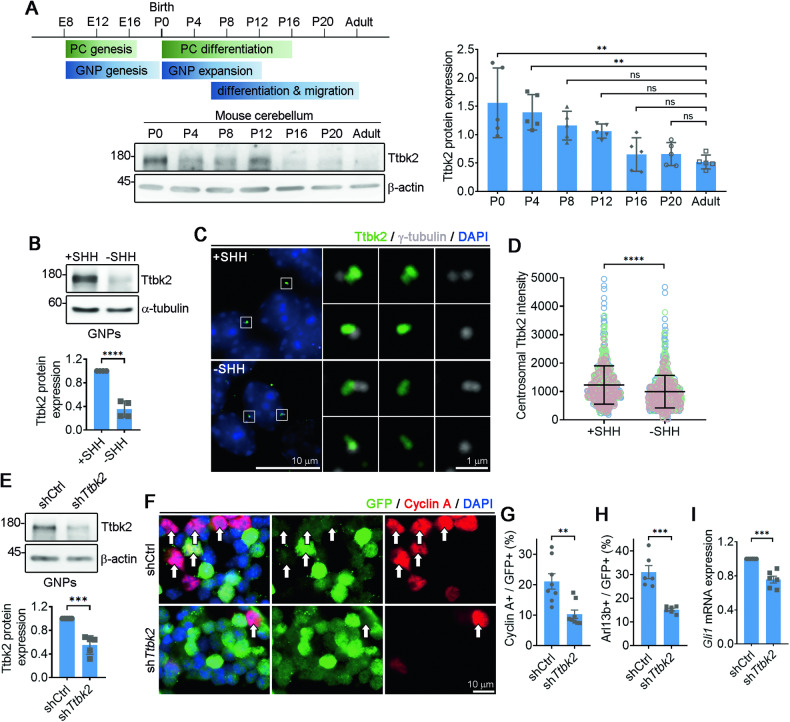
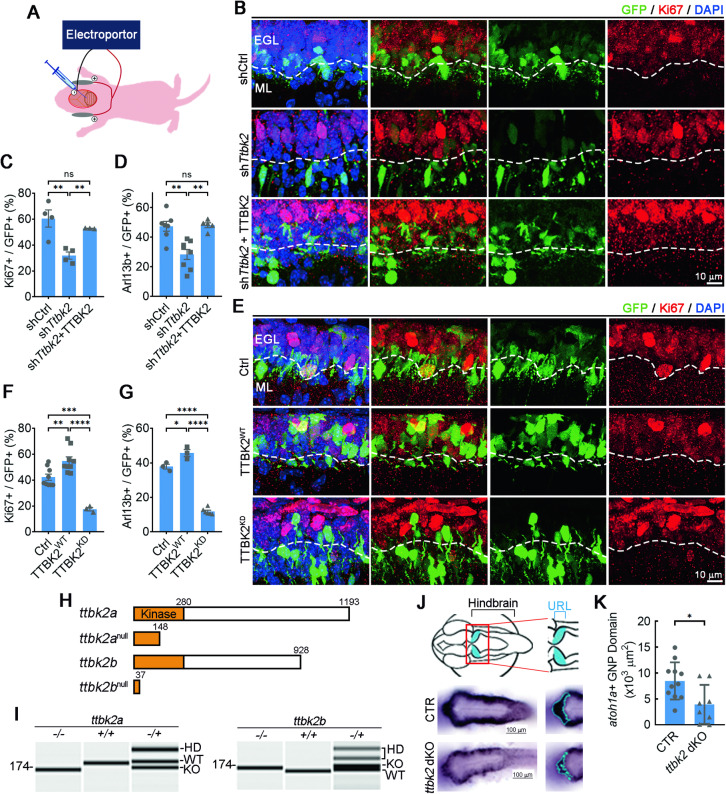
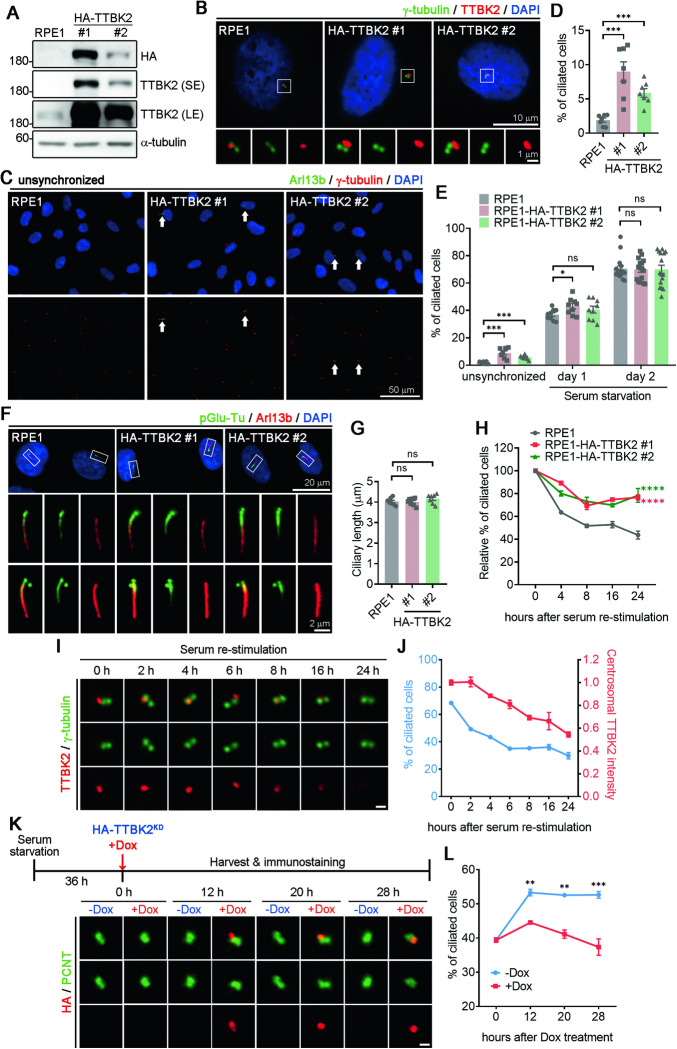
Development of the cerebellum requires precise regulation of granule neuron progenitor (GNP) proliferation. Although it is known that primary cilia are necessary to support GNP proliferation, the exact molecular mechanism governing primary cilia dynamics within GNPs remains elusive. Here, we establish the pivotal roles for the centrosomal kinase TTBK2 (Tau tubulin kinase-2) and the E3 ubiquitin ligase HUWE1 in GNP proliferation. We show that TTBK2 is highly expressed in proliferating GNPs under Sonic Hedgehog (SHH) signaling, coinciding with active GNP proliferation and the presence of primary cilia. TTBK2 stabilizes primary cilia by inhibiting their disassembly, thereby promoting GNP proliferation in response to SHH. Mechanistically, we identify HUWE1 as a novel centrosomal E3 ligase that facilitates primary cilia disassembly by targeting TTBK2 degradation. Disassembly of primary cilia serves as a trigger for GNP differentiation, allowing their migration from the external granule layer (EGL) of the cerebellum to the internal granule layer (IGL) for subsequent maturation. Moreover, we have established a link between TTBK2 and SHH-type medulloblastoma (SHH-MB), a tumor characterized by uncontrolled GNP proliferation. TTBK2 depletion inhibits SHH-MB proliferation, indicating that TTBK2 may be a potential therapeutic target for this cancer type. In summary, our findings reveal the mechanism governing cerebellar development and highlight a potential anti-cancer strategy for SHH-MB.


Conflict of interest statement

The authors declare no competing interests.

Figures

Fig. 1
Fig. 1. Ttbk2 expression maintains primary cilia in GNPs and promotes SHH-dependent GNP proliferation.
A Tissue lysates from cerebellum of postnatal mouse pups and adult mice were collected and immunoblotted using antibodies against Ttbk2 and β-actin. Ttbk2 levels were quantified by normalizing with β-actin. Data were collected from n = 5 independent experiments. Error bars represent the mean ± SD. ns, not significant, **p < 0.01 by one-way ANOVA with post-hoc test. B Purified P7 GNPs were cultured in the presence or absence of SHH for 3 days. Immunoblots were performed to examine Ttbk2 levels with α-tubulin serving as the loading control. The Ttbk2 levels were quantified by normalizing with α-tubulin. Data were collected from n = 4 independent experiments. Error bars represent the mean ± SD. ****p < 0.0001 by Student’s t test. C Purified P7 GNPs in the presence and absence of SHH for 3 days were stained with anti-Ttbk2 and anti-γ-tubulin antibodies. Nuclei were stained by DAPI (blue). Regions within the marked boxes were magnified and shown in the right. Scale bars are as indicated. D Ttbk2 intensity was quantified. The scatter plot graph showed the results from three experiments. Each color represents an independent experiment. More than 200 cells were counted per experiment. Error bars represent the mean ± SD. ****p < 0.0001 by nonparametric test. E Purified P7 GNPs were infected with lentivirus carrying shCtrl or shTtbk2 along with GFP for 3 days. Ttbk2 levels were examined by immunoblots with β-actin as the loading control. Data were collected from n = 5 independent experiments. Error bars represent the mean ± SD. ***p < 0.001 by Student’s t test. F Immunostaining was performed to label the proliferating GNPs (Cyclin A+, red) and infected cells (GFP+). Nuclei were stained by DAPI (blue). Arrows indicate cyclin A+/GFP+ cells. Scale bar, 10 μm. G The percentage of cyclin A+/GFP+ cells was quantified. 200 cells from n = 8 independent experiments were tested. Error bars represent the mean ± SEM. **p < 0.01 by Student’s t test. H The percentage of ciliated cells in each group from Fig. S1C was quantified. 200 cells from n = 6 independent experiments were tested. Error bars represent the mean ± SEM. ***p < 0.001 by Student’s t test. I Purified P7 GNPs were infected with lentivirus carrying shCtrl or shTtbk2 along with GFP for 3 days. The expression of Gli1 was analyzed by qPCR. Data were normalized to an internal control (18S) and plotted as fold change above shCtrl arbitrarily set as 1. Error bars represent the mean ± SEM from n = 6 independent experiments. ***p < 0.001 by Student’s t test.
Fig. 2
Fig. 2. Ttbk2 controls GNP pool expansion.
A The electroporation-based strategy for the delivery of plasmids into the EGL of P6 mice. B Either shCtrl, shTtbk2, or human TTBK2 expression construct along with shTtbk2 was electroporated into the EGL of P6 mice followed by a waiting period of 2 days. Dashed white line distinguishes EGL (upper) and ML (lower). Immunostaining was performed to label the proliferating GNPs (Ki67+, red) and electroporated cells (GFP+). Nuclei were stained by DAPI. Scale bar, 10 μm. C The percentage of Ki67+/GFP+ cells in EGL was quantified. 50–200 electroporated cells were counted (n = 4 for shCtrl and shTtbk2; n = 3 for shTtbk2 + TTBK2). Error bars represent the mean ± SEM. ns, not significant, **p < 0.01 by Student’s t test. D The percentage of Arl13b+/GFP+ cells in EGL from Fig. S2A was quantified. 50–200 electroporated cells were counted (n = 7 for shCtrl; n = 8 for shTtbk2; n = 5 for shTtbk2 + TTBK2). Error bars represent the mean ± SEM. ns, not significant, **p < 0.01 by Student’s t test. E TTBK2WT, TTBK2KD, or control (Ctrl) was electroporated into the EGL of P6 mice followed by a waiting period of 2 days. Dashed white line distinguishes EGL (upper) and ML (lower). Immunostaining was performed to label the proliferating GNPs (Ki67+, red) and electroporated cells (GFP+). Nuclei were stained by DAPI. Scale bar: 10 μm. F The percentage of Ki67+/GFP+ cells in EGL was quantified. 50–200 electroporated cells were counted (n = 9 for Ctrl and TTBK2WT; n = 3 for TTBK2KD). Error bars represent the mean ± SEM. **p < 0.01, ***p < 0.001, ****p < 0.0001 by Student’s t test. G The percentage of Arl13b + /GFP+ cells in EGL from Fig. S2B was quantified. 50–200 electroporated cells were counted (n = 3 for Ctrl and TTBK2WT; n = 6 for TTBK2KD). Error bars represent the mean ± SEM. *p < 0.05, ****p < 0.0001 by Student’s t test. H Schematic diagram shows wild-type, ttbk2a, and ttbk2b, and their truncated mutants. The kinase domain is colored in yellow. I Genotyping of wild-type (+/+), heterozygous (−/+), or homozygous (KO; −/−) ttbk2a and ttbk2b mutant fish by capillary electrophoresis. HD: Heteroduplex band of the + and – alleles. J The top diagram depicts the location of zebrafish hindbrain and its precursor called URL at 2 dpf. The lower pictures are the in situ hybridization results of atoh1a showing the granule cell progenitor in the CTR and ttbk2 dKO fish brain. The left picture is the whole brain, and the right picture is the cerebellar regions used for quantitation analysis. K Quantification of the granule progenitor domains as the area of atoh1a-positive domains was performed in URL of CTR and ttbk2 dKO. n = 11 for CTR; n = 8 for ttbk2 dKO. Error bars represent the mean ± SD. *p < 0.05 by Student’s t test.
Fig. 3
Fig. 3. The elevated TTBK2 expression stabilizes primary cilia.
A HA-TTBK2 was stably expressed in RPE1 cells. Two TTBK2-expressing cell lines (#1 and #2) were selected. TTBK2 levels were examined by immunoblots using antibodies as indicated. SE: short exposure. LE: long exposure. B Immunostaining was performed in the control and two TTBK2-overexpressing RPE1 cells using antibodies as indicated. Nuclei were stained by DAPI. Regions within the marked boxes were magnified and shown in the bottom. Scale bars are as indicated. C RPE1 cells cultured without SHH were fixed and stained with antibodies against Arl13b and γ-tubulin. Nuclei were stained by DAPI (blue). The arrows in the images highlight the presence of primary cilia. Scale bars are as indicated. D, E The percentage of ciliated cells was quantified in unsynchronized and serum-starved cells. More than 200 cells from at least 7 independent experiments were tested. Error bars represent the mean ± SEM. ns not significant, ***p < 0.001, *p < 0.05 by Student’s t test. F Immunostaining was conducted in cells that had been serum-starved for 2 days, using antibodies against glutamylated tubulin and Arl13b. Scale bars are as indicated. G Ciliary length was quantified by measuring more than 200 cells from at least 7 independent experiments. Error bars represent the mean ± SEM. ns, not significant by Student’s t test. H Cells were serum-starved for two days before adding serum to induce primary cilia disassembly. Ciliated frequency was determined using Arl13b staining. More than 200 cells from n = 3 independent experiments were tested. Error bars represent the mean ± SEM. ****p < 0.0001 by Two-way ANOVA. I Immunostaining was performed with antibodies against TTBK2 (red) and γ-tubulin (green). Scale bar, 1 μm. J The percentage of ciliated cells and TTBK2 intensity at the centrosomes were quantified. At least 200 cells from n = 3 independent experiments were tested. Error bars represent the mean ± SEM. K Experimental timeline schematic for assaying primary cilia in doxycycline-inducible HA-TTBK2KD RPE1 cells is shown. Immunostaining was performed with antibodies against HA (red) and PCNT (green). Representative images were shown. Scale bar, 1 μm. L The percentage of ciliated cells was quantified. More than 200 cells were analyzed for each independent experiment. Error bars represent mean ± SEM. n = 3. **p < 0.01, ***p < 0.001 by Student’s t test.
Fig. 4
Fig. 4. TTBK2 level in GNPs is controlled by ubiquitin-dependent proteolysis.
A Ttbk2 expression was examined by qPCR analysis in purified P7 GNPs cultured with or without SHH ligands for 3 days. Error bars represent mean ± SEM; n = 8. ns, not significant by Student’s t test. B Purified P7 GNPs were treated with or without SHH for 2 days. In the absence of SHH ligand for 36 h, GNPs were treated with MG132 (5 μM) for another 8 h. Immunoblots were performed and the Ttbk2 levels were quantified. Data were collected from three independent experiments. Error bars represent the mean ± SD. *p < 0.05, **p < 0.01 by Student’s t test. C Immunostaining of Ttbk2 (red), γ-tubulin (white), and DAPI (blue)  was performed in purified GNPs treated with or without MG132. D The scatter plot graph shows the result of Ttbk2 intensity at centrosomes from C from three independent experiments. Each color represents an individual experiment. Around 200 cells were counted per experiment. Error bars represent the mean ± SD. ****p < 0.0001 by nonparametric test. E Ubiquitination assay using lysate from 293T cells expressing Flag-TTBK2 and myc-Ub in the absence or presence of MG132. Immunoprecipitation of TTBK2 was performed followed by immunoblots with antibodies as indicated. F Ubiquitination assay was performed using lysates from 293T cells expressing Flag-tagged TTBK2 deletion mutants and myc-Ub in the absence or presence of MG132. Immunoprecipitation of TTBK2 was performed followed by WBs using antibodies as indicated. G The ability of each TTBK2 mutant to form the high-molecular-mass of poly-Ub molecules is shown.
Fig. 5
Fig. 5. HUWE1 controls cilia disassembly through degrading TTBK2.
A Workflow for searching candidate centrosomal E3 ligases involved in the regulation of TTBK2 degradation. B Flag-TTBK2 was ectopically expressed in 293 T cells. TTBK2 immunoprecipitation was performed followed by immunonblots with indicated antibodies. C RPE1 cells were stained with antibodies to against centrin and HUWE1. Nuclei were stained by DAPI. Regions within the marked boxes were magnified and shown in right. Scale bars are as indicated. D HUWE1 positive signals at centrioles were quantified. Data were collected from n = 4 independent experiments. Error bars represent the mean ± SEM. ****p < 0.0001 by Student’s t test. E RPE1 cells were stained with antibodies to against centrin and TTBK2. Nuclei were stained by DAPI. Regions within the marked boxes were magnified in right. Scale bars are as indicated. F TTBK2 positive signals at centrosome were quantified. Data were collected from n = 3 independent experiments. Error bars represent the mean ± SEM. ****p < 0.0001 by Student’s t test. G RPE1 cells were treated with BI8622 for 24 h. WB analysis was performed using antibodies as indicated with α-tubulin as the loading control. TTBK2 levels were quantified. Data were collected from n = 4 independent experiments. Error bars represent the mean ± SD. *p < 0.05 by Student’s t test. H Cells were treated with BI8622 for 24 h followed by immunostaining with anti-TTBK2 and anti-γ-tubulin antibodies. Nuclei were stained by DAPI. Regions within the marked boxes were magnified in the right. Scale bars are as indicated. I The TTBK2 intensity at the centrosome was quantified. The scatter plot graph showed the results from three experiments. Each color represents an individual experiment. More than 200 cells were counted per experiment. Error bars represent the mean ± SD. ****p < 0.0001 by nonparametric test. J Ubiquitination assay was carried out in 293 T cells that transfected with HA-TTBK2, Flag-HUWE1, and myc-Ub. Cells were treated with BI8622 for 24 h before harvesting to inhibit HUWE1 activity. Immunoprecipitation of TTBK2 was performed followed by immunoblots with antibodies as indicated. K RPE1 cells were treated with BI8622 for 24 h. The ciliated frequency was determined by Arl13b staining. Data were collected from n = 4 independent experiments. Error bars represent the mean ± SEM. **p < 0.01 by Student’s t test. L Cilia disassembly assay was performed. The ciliated frequency was quantified. More than 200 cells were analyzed for each independent experiment. Error bars represent mean ± SEM. n = 4. *p < 0.05, **p < 0.01 by Student’s t test.
Fig. 6
Fig. 6. Ttbk2 degradation promoted by Huwe1 in GNPs is Atoh1 independent.
A Purified P7 GNPs were treated with or without BI8622 for 24 h. Immunoblots were performed using antibodies as indicated. The levels of Ttbk2 and Atoh1 were quantified. Data were collected from n = 3 independent experiments. Error bars represent the mean ± SD. **p < 0.01 by Student’s t test. B Lentivirus carrying either shCtrl or shHuwe1 was used to infect purified P7 GNPs, which were then cultured for an additional 3 days. Immunoblots were performed using antibodies as indicated. Huwe1, Ttbk2 and Atoh1 levels were quantified. Data were collected from n = 4 independent experiments. Error bars represent the mean ± SD. ****p < 0.0001, ***p < 0.001, **p < 0.01 by Student’s t test. C Purified P7 GNPs were treated with or without BI8622 for 24 h. Immunostaining was performed using antibodies as indicated. Nuclei were stained by DAPI. Regions within the marked boxes were magnified and shown in the bottom. Scale bars are as indicated. D The Ttbk2 intensity around the centrosome was quantified. The scatter plot graph showed the results from n = 3. Each color represents an individual experiment. More than 200 cells were counted per experiment. Error bars represent the mean ± SD. ****p < 0.0001 by nonparametric test. E HA-Atoh1 was stably expressed in NIH3T3 cells (Atoh1- OE). Atoh1-ChIP-qPCR analysis was performed. The enrichment folds of Atoh1 at those genes were quantified. Error bars represent the mean ± SEM from at least three independent experiments. ns, not significant, **p < 0.01, *p < 0.05 by Student’s t test. F Purified GNPs were infected with lentivirus carrying shAtoh1. The levels of Atoh1, Ttbk2, and Gli2 were examined and quantified by western blot analysis. Error bars represent the mean ± SD from n = 3 independent experiments. ns, not significant, ****p < 0.0001, ***p < 0.001 by Student’s t test. G HA-Atoh1 was expressed in purified P7 GNPs. Cells were treated with or without BI8622 (10 μM) for 24 h. Immunoblots were performed using antibodies as indicated. The relative levels of Ttbk2 and Gli2 were quantified. Data were collected from n = 4 independent experiments. Error bars represent the mean ± SD. ns, not significant, **p  <  0.01. *p < 0.05 by Student’s t test. H Atoh1 expression construct along with shCtrl or shTtbk2 was electroporated into the EGL of P6 mice followed by a waiting period of 2 days. Dashed white line distinguishes EGL (upper) and ML (lower). Immunostaining was performed to label the proliferating GNPs (Ki67+, red) and electroporated cells (GFP+). Nuclei were stained by DAPI. Scale bar, 10 μm. I The percentage of Ki67+/GFP+ cells in EGL was quantified. 50–200 electroporated cells were counted (n = 3 for shCtrl, Atoh1 and Atoh1+shTTBK2, n = 2 for shTtbk2). Error bars represent the mean ± SEM. ns, not significant, *p < 0.05, **p < 0.01 by Student’s t test.
Fig. 7
Fig. 7. TTBK2 depletion inhibits cell proliferation of SHH-MB.
A The putative TTBK2 clusters with respect to its spatial positions in two orthotopic xenograft SHH-MBs (sample 1 and sample 2). B A heatmap illustrating the gene expression levels of the top 100 genes with significant changes in TTBK2-positive and TTB2-negative groups. C-E Violin plots depicting the activities of cilia (in C), SHH (in D), and cell cycle (in E) gene signatures, separated by TTBK2 positive and TTB2 negative clusters. ns, not significant, *p < 0.05, *** p < 0.001, ****p < 0.0001 by nonparametric test. F Immunoblots were performed in wild type and two TTBK2-/- Daoy cell lines (#1 and #2) with anti-TTBK2 and anti-α-tubulin antibodies. G Immunostaining was performed with antibodies as indicated. Scale bar, 1 μm. H Total RNAs in wild-type and TTBK2 knockout Daoy cells were isolated for RNA-seq analysis (n = 2). The row z-score-normalized heatmap shows the down-regulated genes associated with hedgehog signaling. I The expression of SHH target genes was analyzed by qPCR. Data were normalized to the internal control (18S). Data were from n = 3 independent experiments. Error bars represent the mean ± SEM. ***p < 0.001, **p < 0.01 by Student’s t test. J The row z-score-normalized heatmap shows the altered genes associated with cell cycle. K Cell proliferation assay was performed in wild type and two TTBK2-/- Daoy cell lines. Data were collected from n = 3 independent experiments. Error bars represent the mean ± SEM. ****p < 0.0001 by Two-way ANOVA. L The soft agar assays were performed on wild type and two TTBK2-/- Daoy cells. The resulting colonies were observed under phase-contrast microscopy. Scale bars as indicated. M The number of colonies per field (2.3 cm2) was quantified. Data were collected from n = 3 experiments. Error bars represent the mean ± SD. ***p < 0.001, **p < 0.01 by Student’s t test. N Colony diameters were measured. More than 50 colonies were counted per experiment. Data were collected from n = 3 experiments. Error bars represent the mean ± SD. ****p < 0.0001 by Student’s t test.
Fig. 8
Fig. 8. Proposed model for HUWE1-dependent TTBK2 degradation in the regulation of cerebellar development and SHH-MB growth.
Our findings reveal the crucial role of SHH signaling in preventing TTBK2 degradation, which in turn stabilizes primary cilia on GNP surfaces and supports GNP proliferation. Additionally, our results suggest that TTBK2 inhibition is a potential therapeutic strategy for SHH-MB.

References

    1. Butts T, Green MJ, Wingate RJ. Development of the cerebellum: simple steps to make a ‘little brain. Development. 2014;141:4031–41. - PubMed
    1. Adamaszek M, D’Agata F, Ferrucci R, Habas C, Keulen S, Kirkby KC, et al. Consensus paper: cerebellum and emotion. Cerebellum. 2017;16:552–76. - PubMed
    1. Wallace VA. Purkinje-cell-derived Sonic hedgehog regulates granule neuron precursor cell proliferation in the developing mouse cerebellum. Curr Biol. 1999;9:445–8. - PubMed
    1. Wechsler-Reya RJ, Scott MP. Control of neuronal precursor proliferation in the cerebellum by Sonic hedgehog. Neuron. 1999;22:103–14. - PubMed
    1. Marzban H, Del Bigio MR, Alizadeh J, Ghavami S, Zachariah RM, Rastegar M. Cellular commitment in the developing cerebellum. Front Cell Neurosci. 2015;8:450. - PMC - PubMed

MeSH terms