Depression at the intersection of race/ethnicity, sex/gender, and sexual orientation in a nationally representative sample of US adults: a design-weighted intersectional MAIHDA
- PMID: 38879739
- PMCID: PMC11637511
- DOI: 10.1093/aje/kwae121
Depression at the intersection of race/ethnicity, sex/gender, and sexual orientation in a nationally representative sample of US adults: a design-weighted intersectional MAIHDA
Abstract
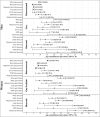
This study examined how race/ethnicity, sex/gender, and sexual orientation intersect under interlocking systems of oppression to socially pattern depression among US adults. With cross-sectional data from the 2015-2020 National Survey on Drug Use and Health (n = 234 722), we conducted a design-weighted, multilevel analysis of individual heterogeneity and discriminatory accuracy (MAIHDA) under an intersectional framework to predict past-year and lifetime major depressive episodes (MDEs). With 42 intersectional groups constructed from 7 race/ethnicity, 2 sex/gender, and 3 sexual orientation categories, we estimated age-standardized prevalence and excess or reduced prevalence attributable to 2-way or higher interaction effects. Models revealed heterogeneity across groups, with prevalence ranging from 1.9% to 19.7% (past-year) and 4.5% to 36.5% (lifetime). Approximately 12.7% (past year) and 12.5% (lifetime) of total individual variance was attributable to between-group differences, indicating key relevance of intersectional groups in describing the population distribution of depression. Main effects indicated, on average, that people who were White, women, gay/lesbian, or bisexual had greater odds of MDE. Main effects explained most between-group variance. Interaction effects (past year: 10.1%; lifetime: 16.5%) indicated another source of heterogeneity around main effects average values, with some groups experiencing excess or reduced prevalence compared with main effects expectations. We extend the MAIHDA framework to calculate nationally representative estimates from complex sample survey data using design-weighted, Bayesian methods. This article is part of a Special Collection on Mental Health.
Keywords: Bayesian analysis; United States; adult; depression; gender; health surveys; intersectional framework; multilevel analysis; prevalence; probability sampling; race; sex; sexual minorities; sexual orientation.
© The Author(s) 2024. Published by Oxford University Press on behalf of the Johns Hopkins Bloomberg School of Public Health. All rights reserved. For permissions, please e-mail: journals.permissions@oup.com.
Conflict of interest statement
The authors have no conflicts of interest to report.
Figures


Update of
-
Depression at the intersection of race/ethnicity, sex/gender, and sexual orientation in a nationally representative sample of US adults: A design-weighted MAIHDA.medRxiv [Preprint]. 2023 Apr 17:2023.04.13.23288529. doi: 10.1101/2023.04.13.23288529. medRxiv. 2023. Update in: Am J Epidemiol. 2024 Dec 2;193(12):1662-1674. doi: 10.1093/aje/kwae121. PMID: 37131598 Free PMC article. Updated. Preprint.
Similar articles
-
Depression at the intersection of race/ethnicity, sex/gender, and sexual orientation in a nationally representative sample of US adults: A design-weighted MAIHDA.medRxiv [Preprint]. 2023 Apr 17:2023.04.13.23288529. doi: 10.1101/2023.04.13.23288529. medRxiv. 2023. Update in: Am J Epidemiol. 2024 Dec 2;193(12):1662-1674. doi: 10.1093/aje/kwae121. PMID: 37131598 Free PMC article. Updated. Preprint.
-
Human papillomavirus vaccination disparities among U.S. college students: An intersectional Multilevel Analysis of Individual Heterogeneity and Discriminatory Accuracy (MAIHDA).Soc Sci Med. 2022 May;301:114871. doi: 10.1016/j.socscimed.2022.114871. Epub 2022 Mar 15. Soc Sci Med. 2022. PMID: 35344774
-
Complicating Narratives of Sexual Minority Mental Health: An Intersectional Analysis of Frequent Mental Distress at the Intersection of Sexual Orientation, Gender Identity, and Race/Ethnicity.LGBT Health. 2022 Apr;9(3):161-168. doi: 10.1089/lgbt.2021.0099. Epub 2022 Feb 17. LGBT Health. 2022. PMID: 35180360
-
Health and healthcare disparities among U.S. women and men at the intersection of sexual orientation and race/ethnicity: a nationally representative cross-sectional study.BMC Public Health. 2017 Dec 19;17(1):964. doi: 10.1186/s12889-017-4937-9. BMC Public Health. 2017. PMID: 29258470 Free PMC article.
-
Intersectional Prevalence of Suicide Ideation, Plan, and Attempt Based on Gender, Sexual Orientation, Race and Ethnicity, and Rurality.JAMA Psychiatry. 2023 Oct 1;80(10):1037-1046. doi: 10.1001/jamapsychiatry.2023.2295. JAMA Psychiatry. 2023. PMID: 37466933 Free PMC article.
Cited by
-
Do coping strategies mediate the effects of childhood adversities and traumata on clinical high-risk of psychosis, depression, and social phobia? A cross-sectional study on patients of an early detection service.BMC Psychiatry. 2025 Jan 7;25(1):21. doi: 10.1186/s12888-024-06435-2. BMC Psychiatry. 2025. PMID: 39773428 Free PMC article.
-
Mental Health at the Margins: The Need for an Intersectional Approach for Inclusive Mental Health Care in India.Indian J Psychol Med. 2025 Apr 21:02537176251332006. doi: 10.1177/02537176251332006. Online ahead of print. Indian J Psychol Med. 2025. PMID: 40276586 Free PMC article. No abstract available.
-
Suicidality at the intersection of sex, sexual orientation, and gender expression among secondary school students in Hong Kong: a population-based study.Lancet Reg Health West Pac. 2024 Dec 5;53:101252. doi: 10.1016/j.lanwpc.2024.101252. eCollection 2024 Dec. Lancet Reg Health West Pac. 2024. PMID: 39717022 Free PMC article.
References
MeSH terms
Grants and funding
LinkOut - more resources
Full Text Sources
Miscellaneous

