Visual periodicity reveals distinct attentional signatures for face and non-face categories
- PMID: 38879816
- PMCID: PMC11180377
- DOI: 10.1093/cercor/bhae228
Visual periodicity reveals distinct attentional signatures for face and non-face categories
Abstract
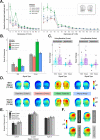
Observers can selectively deploy attention to regions of space, moments in time, specific visual features, individual objects, and even specific high-level categories-for example, when keeping an eye out for dogs while jogging. Here, we exploited visual periodicity to examine how category-based attention differentially modulates selective neural processing of face and non-face categories. We combined electroencephalography with a novel frequency-tagging paradigm capable of capturing selective neural responses for multiple visual categories contained within the same rapid image stream (faces/birds in Exp 1; houses/birds in Exp 2). We found that the pattern of attentional enhancement and suppression for face-selective processing is unique compared to other object categories: Where attending to non-face objects strongly enhances their selective neural signals during a later stage of processing (300-500 ms), attentional enhancement of face-selective processing is both earlier and comparatively more modest. Moreover, only the selective neural response for faces appears to be actively suppressed by attending towards an alternate visual category. These results underscore the special status that faces hold within the human visual system, and highlight the utility of visual periodicity as a powerful tool for indexing selective neural processing of multiple visual categories contained within the same image sequence.
Keywords: EEG; face perception; frequency tagging; object recognition; selective attention.
© The Author(s) 2024. Published by Oxford University Press.
Conflict of interest statement
The authors declare no competing interest.
Figures


Similar articles
-
Selective Attention to Faces in a Rapid Visual Stream: Hemispheric Differences in Enhancement and Suppression of Category-selective Neural Activity.J Cogn Neurosci. 2018 Mar;30(3):393-410. doi: 10.1162/jocn_a_01220. Epub 2017 Dec 19. J Cogn Neurosci. 2018. PMID: 29257716
-
A single glance at natural face images generate larger and qualitatively different category-selective spatio-temporal signatures than other ecologically-relevant categories in the human brain.Neuroimage. 2016 Aug 15;137:21-33. doi: 10.1016/j.neuroimage.2016.04.045. Epub 2016 Apr 30. Neuroimage. 2016. PMID: 27138205
-
Examining the neural correlates of within-category discrimination in face and non-face expert recognition.Neuropsychologia. 2019 Feb 18;124:44-54. doi: 10.1016/j.neuropsychologia.2019.01.005. Epub 2019 Jan 17. Neuropsychologia. 2019. PMID: 30659863
-
Tuning Attention to Object Categories: Spatially Global Effects of Attention to Faces in Visual Processing.J Cogn Neurosci. 2019 Jul;31(7):937-947. doi: 10.1162/jocn_a_01400. Epub 2019 Mar 26. J Cogn Neurosci. 2019. PMID: 30912729
-
Dynamics of neural representations when searching for exemplars and categories of human and non-human faces.Sci Rep. 2018 Sep 5;8(1):13277. doi: 10.1038/s41598-018-31526-y. Sci Rep. 2018. PMID: 30185919 Free PMC article.
References
-
- Allport A. Selection for action: some behavioral and neurophysiological considerations of attention and action. Perspectives on perception and action. 1987:15:395–419.
-
- Battistoni E, Kaiser D, Hickey C, Peelen MV. Spatial attention follows category-based attention during naturalistic visual search: evidence from MEG decoding. 2018: bioRxiv.390807. - PubMed
Publication types
MeSH terms
Grants and funding
LinkOut - more resources
Full Text Sources

