Comparative Study
. 2024 Sep;27(3):621-634.
doi: 10.1007/s40477-024-00906-8. Epub 2024 Jun 16.

Ultrasound imaging and shear wave elastography for the differential diagnosis of heel pain: a comparative cross-sectional study

Affiliations
Comparative Study

Ultrasound imaging and shear wave elastography for the differential diagnosis of heel pain: a comparative cross-sectional study

Nour Mohamed Kandil et al. J Ultrasound. 2024 Sep.

Abstract

Purpose: In correlation with magnetic resonance imaging (MRI), this study attempts to assess the effectiveness of the diagnostic of ultrasonography (US) features and shear wave elastography (SWE) in determining the different causes of heel pain.

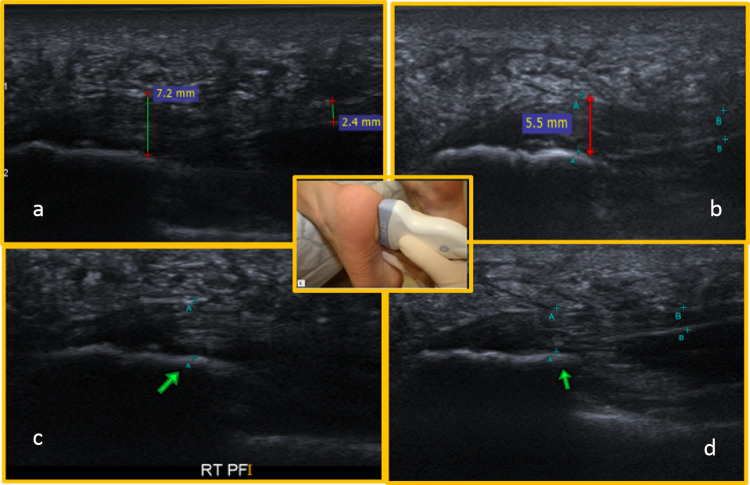
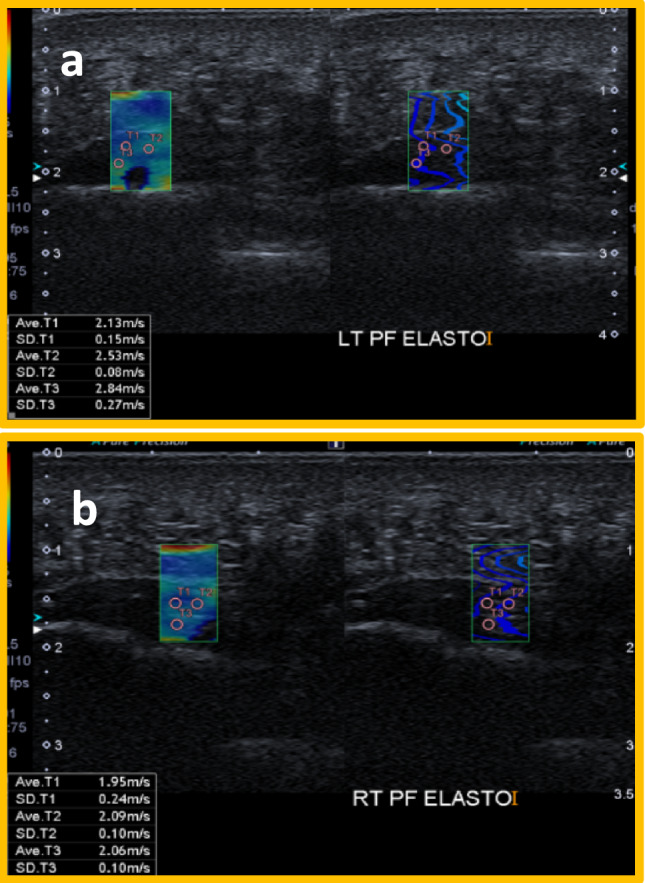
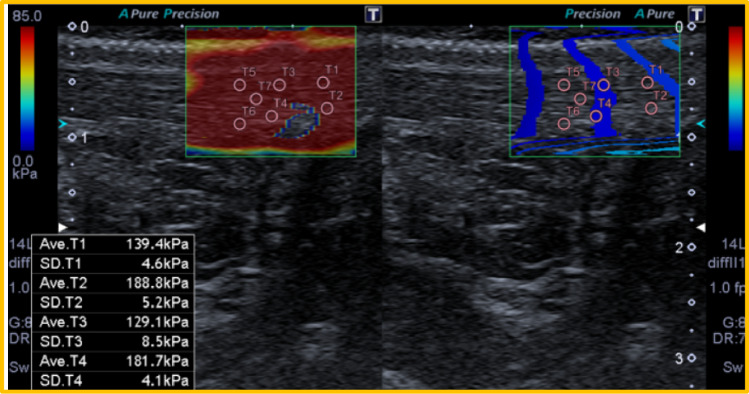
Materials and methods: 55 heels with a mean age of 38.33 ± 10.8 were included in the study (10 control cases and 41 cases, 4 of which had bilateral heel pain). There were 23 female cases (56.1%) and 18 male cases (43.95%). Examinations using shear wave elastography (SWE) and ultrasound (US) were done in different positions. MRI and the obtained data were correlated.

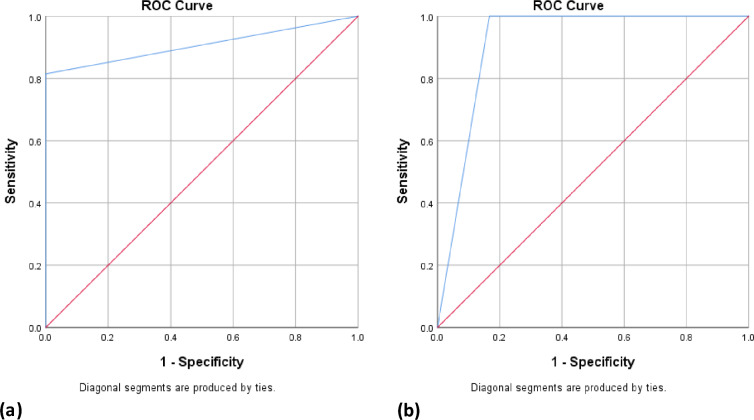
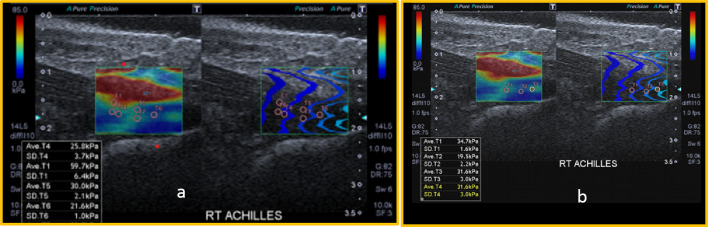
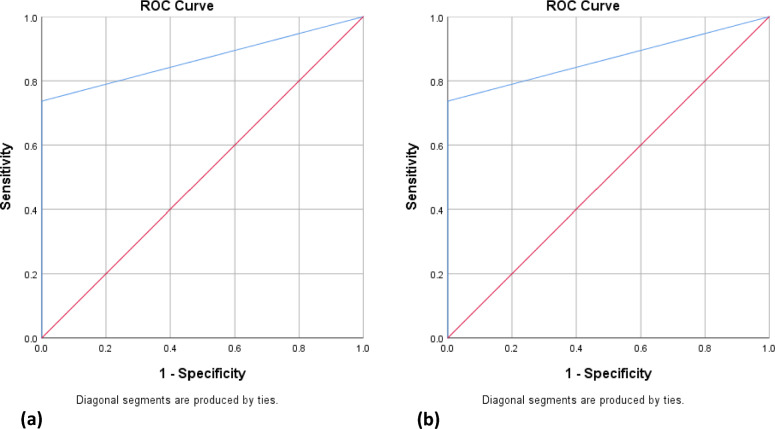
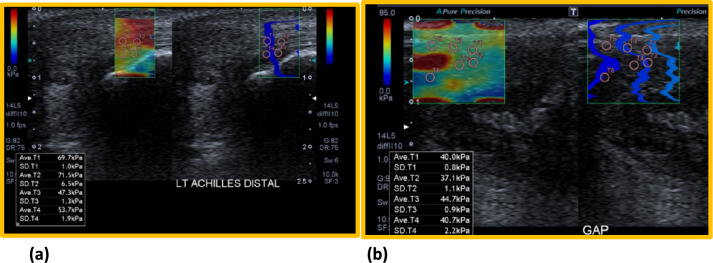
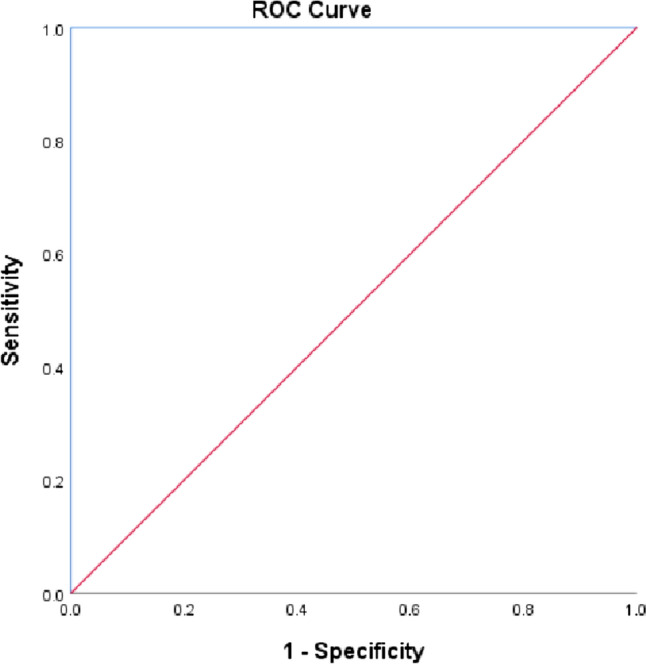
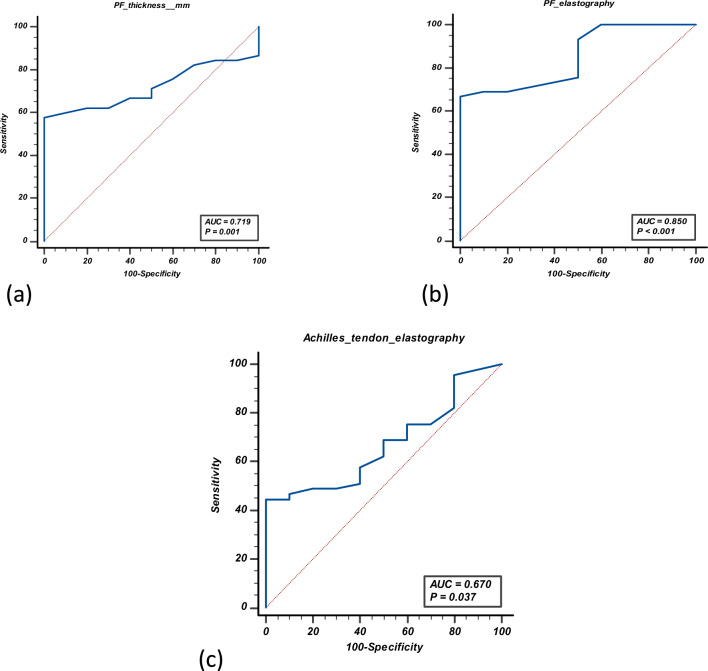
Results: When used to diagnose different heel pain causes, ultrasound demonstrated great sensitivity and specificity. SWE demonstrated a good correlation with MRI findings and enhanced the ultrasound's diagnostic precision in identifying plantar fasciitis early on (increased accuracy from 88.9 to 93.33% with 100% sensitivity and 83.3% specificity) and Achilles tendinopathy (increased accuracy from 88.9 to 97.8 with 94.7% sensitivity and 100% specificity).

Conclusion: In summary, we concluded that heel pain can be efficiently examined by both ultrasound (US) and shear wave elastography (SWE) with the former being used as the primary effective tool and the latter being done to increase diagnostic accuracy. We also concluded that SWE improved the ultrasound's diagnostic precision in identifying patients with early plantar fasciitis and Achilles tendinopathy and showed a robust relationship with clinical outcomes, enhancing patient evaluation and follow-up.

Keywords: Achilles tendon; Heel pain; MRI; Plantar fasciitis; Shear wave elastography; Ultrasonography.


Conflict of interest statement

The authors have no relevant financial or non-financial interests to disclose.

Figures

Fig. 1
Fig. 1
50-year-old- female patient complaining of bilateral plantar heel pain for 1 year. a and d B-mode assessment of the left plantar fascia in LS revealed thickened hypoechoic plantar fascia measuring about 7.2 mm, b and c B mode assessment of the right plantar fascia in LS revealed thickened hypoechoic plantar fascia measuring about 5.5 mm. The inset shows the transducer's position. Green arrow: calcaneus bone. LS: Longitudinal section. (McNally E (2014) [9]
Fig. 2
Fig. 2
50-year-old- female patient complaining of bilateral plantar heel pain for 1 year; same patient in Fig. 1. a The right image is the strain elastography, and the left image measures the elasticity of the left plantar fascia with a colour-coded box, circular ROI for quantitative measurements and a colour code scale at the top side of the image. SWV revealed an average value of 2.5 m/sec (18.75 kpa) and b the right image is the strain elastography, the left image measures the elasticity of the right plantar fascia with a colour-coded box, circular ROI for quantitative measurements and a colour code scale at the top side of the image. SWV revealed an average value of 2.03 m/sec (12.4 kpa)
Fig. 3
Fig. 3
a ROC curve of Ultrasonography in the detection of plantar fasciitis. b ROC curve of SWE in the detection of plantar fasciitis
Fig. 4
Fig. 4
ROC curve of Ultrasonography in the detection of plantar calcaneal spur
Fig. 5
Fig. 5
32-year-old- female patient complaining of right posterior and medial heel pain for 11 months. a, b LS Showing relatively thickened hypoechoic right Achilles tendon at its insertion measuring about 7.4 mm. Hypervascularization can be observed inside the deep fibres of the Achilles tendon, the synovial tissue of the retrocalcaneal bursa, and the distal portion of the Kager fat pad and c retrocalcaneal bursitis (white arrow). The inset shows the transducer’s position. LS: Longitudinal section. McNally E (2014) [9]
Fig. 6
Fig. 6
The right image is the strain elastography and the left image measures the elasticity of the normal right Achilles tendon with a colour-coded box, circular ROI for quantitative measurements and a colour-code scale at the top side of the image. SWE revealed an average value of 7.3m/sec (159.8 kpa)
Fig. 7
Fig. 7
32-year-old- female patient complaining of right posterior and medial heel pain for 11 months; same patient as Fig. 6. a The right image is the strain elastography, and the left image measures the elasticity of the right Achilles tendon at its distal end with a colour-coded box, circular ROI for quantitative measurements and a colour code scale at the top side of the image. SWE revealed an average value of 34.27 kpa and b Repeated measurement after two hours; The right image is the strain elastography, and the left image measures the elasticity of the right Achilles tendon at its distal end with a colour-coded box, circular ROI for quantitative measurements and a colour code scale at the top side of the image. SWE revealed an average value of 29.35 kpa
Fig. 8
Fig. 8
a ROC curve of SWE in the detection of Achilles tendinopathy. b ROC curve of Ultrasonography in the detection of Achilles tear
Fig. 9
Fig. 9
18-year-old male patient with a known history of trauma, suspecting left Achilles tear and complaining of left posterior heel pain. a The right image is the strain elastography, and the left image measures the elasticity of the left Achilles tendon at its distal end with a colour-coded box, circular ROI for quantitative measurements and a colour-code scale at the top side of the image. SWE revealed an average value of 4.5 m/sec (60.5 Kpa) and b The right image is the strain elastography and the left image measures the elasticity of the left Achilles tendon at the gap with a colour-coded box, circular ROI for quantitative measurements and a colour code scale at the top side of the image. SWE revealed an average value of 3.7 m/sec (40.6Kpa)
Fig. 10
Fig. 10
ROC curve of Ultrasonography in the detection of bursitis
Fig. 11
Fig. 11
a ROC curve of plantar fascia thickness in the prediction of heel pain. b ROC curve of plantar fascia elastography in the prediction of heel pain. c ROC curve of Achilles tendon elastography in the prediction of heel pain

References

    1. Kim JR, Suh CH, Yoon HM, Lee JS, Cho YA, Jung AY (2018) The diagnostic performance of shear-wave elastography for liver fibrosis in children and adolescents: A systematic review and diagnostic meta-analysis. Eur Radiol 28:1175–1186 10.1007/s00330-017-5078-3 - DOI - PubMed
    1. Chang CD, Wu JS (2017) MR imaging findings in heel pain. Magn Reson Imaging Clin 25(1):79–93 10.1016/j.mric.2016.08.011 - DOI - PubMed
    1. Weerakkody Y, Sharma R, Ibrahem H et al (2024) Achilles tendinopathy. Radiopaedia.org. 10.53347/rID-40410
    1. Kim YH, Chai JW, Kim DH, Kim HJ, Seo J (2022) A problem-based approach in musculoskeletal ultrasonography: heel pain in adults. Ultrasonography 41(1):34 10.14366/usg.21069 - DOI - PMC - PubMed
    1. Pirri C, Stecco C, Güvener O et al (2024) EURO-MUSCULUS: European Musculoskeletal Ultrasound Study Group in Physical and Rehabilitation Medicine. EURO-MUSCULUS/USPRM Dynamic Ultrasound Protocols for Ankle/Foot. Am J Phys Med Rehabil 103(3):e29–e34. 10.1097/PHM.0000000000002349 10.1097/PHM.0000000000002349 - DOI - PubMed

Publication types

LinkOut - more resources