

Lipidomic signatures in patients with early-onset and late-onset Preeclampsia
- PMID: 38879866
- PMCID: PMC11180640
- DOI: 10.1007/s11306-024-02134-x
Lipidomic signatures in patients with early-onset and late-onset Preeclampsia
Abstract
Background: Preeclampsia is a pregnancy-specific clinical syndrome and can be subdivided into early-onset preeclampsia (EOPE) and late-onset preeclampsia (LOPE) according to the gestational age of delivery. Patients with preeclampsia have aberrant lipid metabolism. This study aims to compare serum lipid profiles of normal pregnant women with EOPE or LOPE and screening potential biomarkers to diagnose EOPE or LOPE.
Methods: Twenty normal pregnant controls (NC), 19 EOPE, and 19 LOPE were recruited in this study. Untargeted lipidomics based on ultra-performance liquid chromatography-tandem mass spectrometry (UPLC-MS/MS) was used to compare their serum lipid profiles.
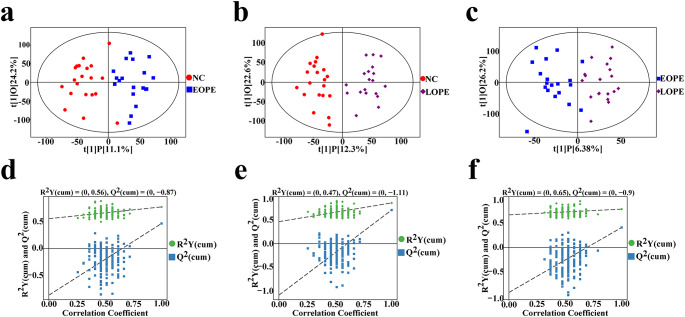
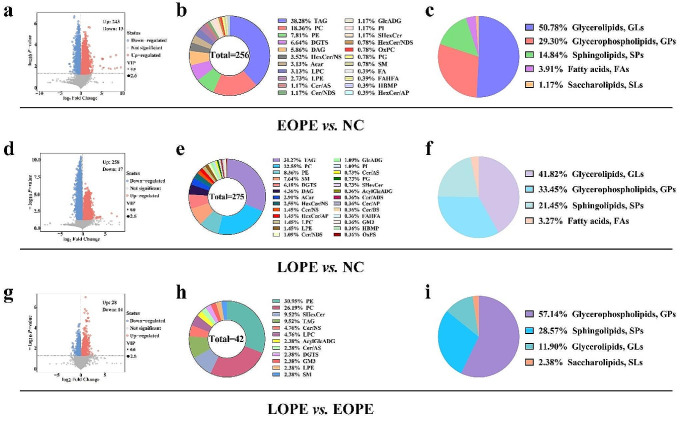
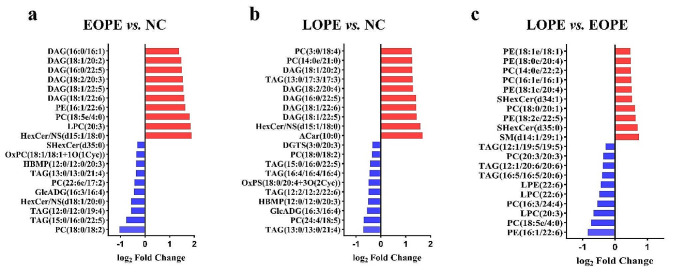
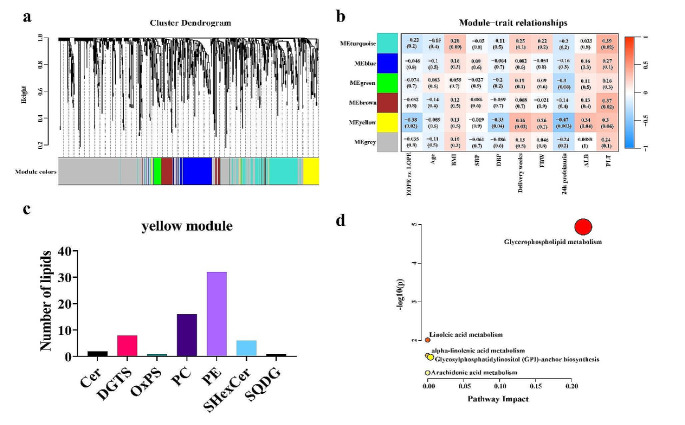
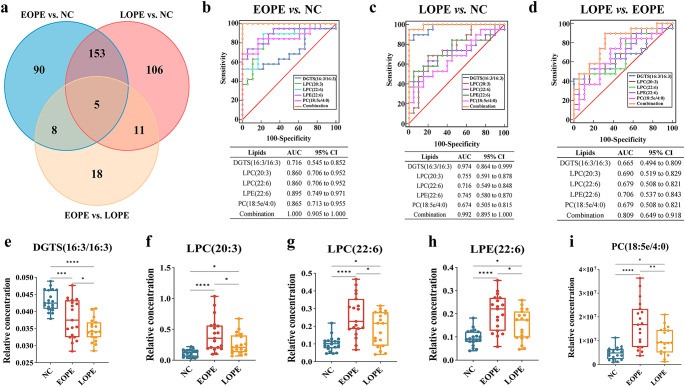
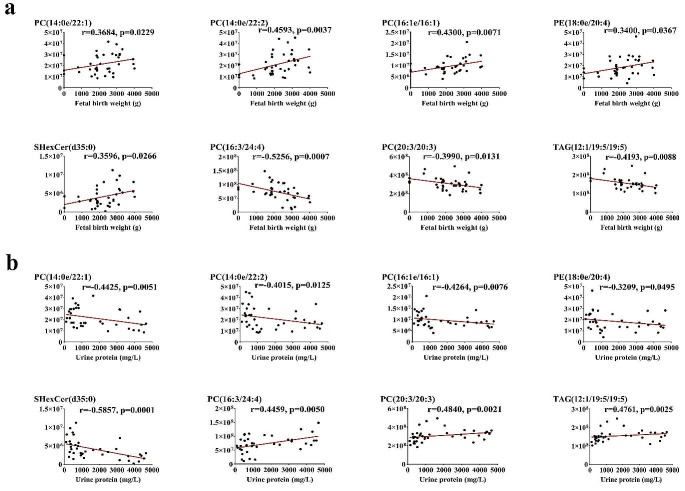
Results: The lipid metabolism profiles significantly differ among the NC, EOPE, and LOPE. Compared to the NC, there were 256 and 275 distinct lipids in the EOPE and LOPE, respectively. Furthermore, there were 42 different lipids between the LOPE and EOPE, of which eight were significantly associated with fetal birth weight and maternal urine protein. The five lipids that both differed in the EOPE and LOPE were DGTS (16:3/16:3), LPC (20:3), LPC (22:6), LPE (22:6), PC (18:5e/4:0), and a combination of them were a potential biomarker for predicting EOPE or LOPE. The receiver operating characteristic analysis revealed that the diagnostic power of the combination for distinguishing the EOPE from the NC and for distinguishing the LOPE from the NC can reach 1.000 and 0.992, respectively. The association between the lipid modules and clinical characteristics of EOPE and LOPE was investigated by the weighted gene co-expression network analysis (WGCNA). The results demonstrated that the main different metabolism pathway between the EOPE and LOPE was enriched in glycerophospholipid metabolism.
Conclusions: Lipid metabolism disorders may be a potential mechanism of the pathogenesis of preeclampsia. Lipid metabolites have the potential to serve as biomarkers in patients with EOPE or LOPE. Furthermore, lipid metabolites correlate with clinical severity indicators for patients with EOPE and LOPE, including fetal birth weight and maternal urine protein levels.
Keywords: Biomarkers; Early-onset preeclampsia; Late-onset preeclampsia; Lipidomics; Preeclampsia.
© 2024. The Author(s).
Conflict of interest statement
The authors declare no competing interests.
Figures
Similar articles
-
LC-MS/MS based untargeted lipidomics uncovers lipid signatures of late-onset preeclampsia.Biochimie. 2023 May;208:46-55. doi: 10.1016/j.biochi.2022.12.002. Epub 2022 Dec 7. Biochimie. 2023. PMID: 36496182
-
Serum proteins differentially expressed in early- and late-onset preeclampsia assessed using iTRAQ proteomics and bioinformatics analyses.PeerJ. 2020 Sep 1;8:e9753. doi: 10.7717/peerj.9753. eCollection 2020. PeerJ. 2020. PMID: 32953262 Free PMC article.
-
Predicting preeclampsia in early pregnancy using clinical and laboratory data via machine learning model.BMC Med Inform Decis Mak. 2025 May 1;25(1):178. doi: 10.1186/s12911-025-02999-5. BMC Med Inform Decis Mak. 2025. PMID: 40312361 Free PMC article.
-
Oxidative stress and mitochondrial dysfunction in early-onset and late-onset preeclampsia.Biochim Biophys Acta Mol Basis Dis. 2020 Dec 1;1866(12):165961. doi: 10.1016/j.bbadis.2020.165961. Epub 2020 Sep 8. Biochim Biophys Acta Mol Basis Dis. 2020. PMID: 32916282 Review.
-
Mechanisms of Key Innate Immune Cells in Early- and Late-Onset Preeclampsia.Front Immunol. 2020 Aug 18;11:1864. doi: 10.3389/fimmu.2020.01864. eCollection 2020. Front Immunol. 2020. PMID: 33013837 Free PMC article. Review.
Cited by
-
Lipidomic and transcriptomic profiling reveal alterations in the coexistence of gestational diabetes mellitus and preeclampsia impacting maternal and neonatal outcomes.Sci Rep. 2025 Jul 25;15(1):27102. doi: 10.1038/s41598-025-12077-5. Sci Rep. 2025. PMID: 40715462 Free PMC article.
-
Non-invasive prediction of fetal growth restriction in pre-eclampsia: integrating peripheral blood endothelial progenitor cell count with uterine artery Doppler velocimetry.Arch Gynecol Obstet. 2025 Jul 18. doi: 10.1007/s00404-025-08123-2. Online ahead of print. Arch Gynecol Obstet. 2025. PMID: 40681743
-
Fatty Acid Metabolism Disruptions: A Subtle yet Critical Factor in Adverse Pregnancy Outcomes.Int J Biol Sci. 2024 Nov 4;20(15):6018-6037. doi: 10.7150/ijbs.103404. eCollection 2024. Int J Biol Sci. 2024. PMID: 39664564 Free PMC article. Review.
References
-
- Ansbacher-Feldman, Z., Syngelaki, A., Meiri, H., Cirkin, R., Nicolaides, K. H., & Louzoun, Y. (2022). Machine-learning-based prediction of pre-eclampsia using first-trimester maternal characteristics and biomarkers. Ultrasound in Obstetrics and Gynecology, 60, 739–745. 10.1002/uog.26105. 10.1002/uog.26105 - DOI - PubMed
MeSH terms
Substances
Grants and funding
- 82071672/The National Natural Science Foundation of China
- 82071672/The National Natural Science Foundation of China
- 82071672/The National Natural Science Foundation of China
- 82071672/The National Natural Science Foundation of China
- 82071672/The National Natural Science Foundation of China
- 82071672/The National Natural Science Foundation of China
- 82071672/The National Natural Science Foundation of China
- 82071672/The National Natural Science Foundation of China
- 82071672/The National Natural Science Foundation of China
- 82071672/The National Natural Science Foundation of China
- BK20201122/The Natural Science Foundation of Jiangsu Province
- BK20201122/The Natural Science Foundation of Jiangsu Province
- BK20201122/The Natural Science Foundation of Jiangsu Province
- BK20201122/The Natural Science Foundation of Jiangsu Province
- BK20201122/The Natural Science Foundation of Jiangsu Province
- BK20201122/The Natural Science Foundation of Jiangsu Province
- BK20201122/The Natural Science Foundation of Jiangsu Province
- BK20201122/The Natural Science Foundation of Jiangsu Province
- BK20201122/The Natural Science Foundation of Jiangsu Province
- BK20201122/The Natural Science Foundation of Jiangsu Province
- YY-112/The Six Talent Peaks Project of Jiangsu Province
- YY-112/The Six Talent Peaks Project of Jiangsu Province
- YY-112/The Six Talent Peaks Project of Jiangsu Province
- YY-112/The Six Talent Peaks Project of Jiangsu Province
- YY-112/The Six Talent Peaks Project of Jiangsu Province
- YY-112/The Six Talent Peaks Project of Jiangsu Province
- YY-112/The Six Talent Peaks Project of Jiangsu Province
- YY-112/The Six Talent Peaks Project of Jiangsu Province
- YY-112/The Six Talent Peaks Project of Jiangsu Province
- YY-112/The Six Talent Peaks Project of Jiangsu Province
- QNRC2016111/Jiangsu Provincial Medical Youth Talent
- QNRC2016111/Jiangsu Provincial Medical Youth Talent
- QNRC2016111/Jiangsu Provincial Medical Youth Talent
- QNRC2016111/Jiangsu Provincial Medical Youth Talent
- QNRC2016111/Jiangsu Provincial Medical Youth Talent
- QNRC2016111/Jiangsu Provincial Medical Youth Talent
- QNRC2016111/Jiangsu Provincial Medical Youth Talent
- QNRC2016111/Jiangsu Provincial Medical Youth Talent
- QNRC2016111/Jiangsu Provincial Medical Youth Talent
- QNRC2016111/Jiangsu Provincial Medical Youth Talent
LinkOut - more resources
Full Text Sources