. 2024 Jul 3;41(7):msae119.
doi: 10.1093/molbev/msae119.

Evolutionary Dynamics of Accelerated Antiviral Resistance Development in Hypermutator Herpesvirus

Affiliations

Evolutionary Dynamics of Accelerated Antiviral Resistance Development in Hypermutator Herpesvirus

Thomas Höfler et al. Mol Biol Evol. .

Abstract

Antiviral therapy is constantly challenged by the emergence of resistant pathogens. At the same time, experimental approaches to understand and predict resistance are limited by long periods required for evolutionary processes. Here, we present a herpes simplex virus 1 mutant with impaired proofreading capacity and consequently elevated mutation rates. Comparing this hypermutator to parental wild type virus, we study the evolution of antiviral drug resistance in vitro. We model resistance development and elucidate underlying genetic changes against three antiviral substances. Our analyzes reveal no principle difference in the evolutionary behavior of both viruses, adaptive processes are overall similar, however significantly accelerated for the hypermutator. We conclude that hypermutator viruses are useful for modeling adaptation to antiviral therapy. They offer the benefit of expedited adaptation without introducing apparent bias and can therefore serve as an accelerator to predict natural evolution.

Keywords: HSV-1; accelerated; antiviral resistance; experimental evolution; hypermutation.


Conflict of interest statement

Conflict of Interest The authors declare no conflict of interest.

Figures

Graphical abstract
Graphical abstract
Fig. 1.
Fig. 1.
Differences in growth and resistance between wt and YS. a) Plaque size assay for wt and YS on Vero cells. To wt normalized plaque diameters of 30 plaques as well as median and interquartile range are displayed. No significant differences are observed (unpaired t-test, P > 0.05). Growth kinetics for wt and YS with a starting MOI of 0.001 (multi-step, b) and MOI of 10 (single-step, c) on Vero cells. Curves present geometric mean and 95% confidence interval of three replicates per viral stock. *indicates significant difference (P < 0.05) between wt and YS at the given timepoint determined by 2-way ANOVA followed by Šidák's multiple comparisons test. IC50 values calculated from plaque reduction assays for d) ACV, e) FOS and f) GCV. Individual datapoints from six independent biological replicates as well as median and interquartile range are displayed, dotted lines indicate chosen selection levels. *indicates significant difference (P < 0.05) between wt and YS determined by unpaired t-test. g) Competition assays between mCherry labeled wt and GFP labeled YS viruses under nonselective and selective conditions. Log2 transformed competition coefficients (number of wt plaques/number of YS plaques) are shown for six independent competitions. *indicates significant differences (P < 0.05) determined by 1-way ANOVA followed by Tukey's multiple comparisons test.
Fig. 2.
Fig. 2.
Faster adaptation to cell culture and antiviral conditions in YS populations. a) Experimental setup for in vitro evolution. Viral stocks were collected every five passages and subjected to genotypic and phenotypic evaluation. b) Endpoint titers for viral stocks measured by plaque assay. No significant differences could be detected using 1-way ANOVA followed by Tukey's multiple comparisons test. Growth curves for wt and YS H2O p30 populations infected c) at MOI 0.001 (multi-step) and d) at MOI 10 (single-step). Curves present geometric mean and 95% confidence interval of three technical replicates per replicate virus population. *indicates significant difference (P < 0.05) between wt and YS at the given timepoint determined by 2-way ANOVA followed by Šidák's multiple comparisons test. Differences in the growth rate (multi-step; c) as well as lag time and burst size (single-step; d) are shown on the right. *indicates significant difference (P < 0.05) between wt and YS measured by unpaired t-test. Resistance measured by plaque reduction assays against e) ACV, f) FOS and g) GCV over the course of passaging. Single IC50 values of two independent measurements per replicate as well as median and interquartile range are shown. Dotted lines show respective levels of drug selection *indicates significant differences (P < 0.05) against YS H2O at the given passage measured by 2-way ANOVA followed by Dunnett's multiple comparisons test. h) Competition assays between indicated wt and YS populations under selective and nonselective conditions on Vero cells. Log2 transformed competition coefficient (number of wt genomes/number of YS genomes) is shown for the nine respective competitions measured in duplicates via qPCR. *indicates significant differences (P < 0.05) against p0 competition as determined by 1-way ANOVA followed by Dunnett's multiple comparisons test.
Fig. 3.
Fig. 3.
Higher mutation frequency of YS populations facilitates faster movement in genetic space. a) Population SNP count including allele frequencies of at least 0.05 for individual lineages over time. b) Pooled SNP counts from (a) at p5 and p30 for wt and YS populations respectively. *indicates significant differences (P < 0.05) at given passage as determined by 2-way ANOVA followed by Šidák's multiple comparisons test. c) Base substitutions (allele frequency > 0.5) per clonal genome from plaque purified clones of two p30 populations each. *indicates significant difference (P < 0.05) determined by unpaired t-test. d) 2-dimensional principal component analysis of nonsynonymous to synonymous per nucleotide site substitution rates (dN/dS) for p5 and p30 samples. The full figure (d, left) was zoomed into (d, right) to highlight less diverse populations. The inset on the left panel shows differences in their respective distance from the origin. *indicates significant differences (P < 0.05) at given passage determined by 2-way ANOVA followed by Šidák's multiple comparisons test. Diversity in distance (σ2) for p5 and p30 populations are given on the right. e) All SNPs that occur at least once throughout the passaging experiment (at allele frequency > 0.05), depicted according to their loci and normalized by gene length. NONC stands for non-coding regions. f) dN/dS ratios for all genes and g) for UL23 and UL30 specifically. If at least 2 out of the 3 replicate populations displayed dN/dS ratios above 2, the gene was considered under positive selection.
Fig. 4.
Fig. 4.
UL23 and UL30 mutations detected in evolved populations: All mutations in a) UL23 (TK) and d) UL30 (Pol) that could be detected (allele frequency > 0.05) at p30 plotted according to their location within the respective gene. SNP allele frequencies for b) UL23 and e) UL30 plotted over time for individual populations, dotted lines show limit of detection (allele frequency of 0.05). SNPs that reach fixation are depicted as bold and underlined (a, b, d, e). c) Genomic position and orientation of recombination junctions in UL23 determined by ViReMa. Occurrence of recombination junctions was overlayed with coverage data. Orange boxes mark functional regions of the gene. f) Haplotypes (allele frequency > 0.1) called for UL23 (left) and UL30 (right) in p30 populations by VILOCA and ShoRAH.
Fig. 5.
Fig. 5.
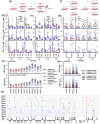
Tymidine kinase and DNA-polymerase alterations lead to antiviral resistance without fitness costs in vitro. a) SIFT predictions for all possible amino acid changes in the TK (left) and Pol (right). Scores below 0.05 (white) are considered to impact molecular function. Resistance measured by plaque reduction assays and displayed as IC50 values for six independent replicates (median + interquartile range) against b) ACV, c) FOS and d) GCV for UL23 deletion mutants as well as against f) ACV, g) FOS and h) GCV for Pol amino acid substitutions. * (red, wt; blue, YS) indicates significant differences (P < 0.05) determined by 1-way ANOVA followed by Tukey's or Dunnett's multiple comparisons test for TK and Pol changes, respectively. Competition assays between e) UL23 deletion mutants and their respective parental virus as well as between i) Pol mutants and wt virus on Vero, HFF, and MRC-5 cells. Log2 transformed competition coefficients (number of mutant plaques/number of control plaques) are shown for six independent replicates. Circled values identify competitions at which no parental virus could be detected. *indicates significant differences (P < 0.05) against the respective nonselective condition as determined by 1-way ANOVA followed by Tukey's multiple comparisons test for UL23 deletion. For Pol mutants, *indicates significant differences observed for wt (red) and YS (blue) mutants, measured against wt/wt competition as determined by 1-way ANOVA and Dunnett's multiple comparisons test. i) Venn diagram showing mutations observed in either wt or YS background (upper panel) and following specific selection (lower panel). Amino acid changes in bold font indicate changes already associated with increased resistance.
Fig. 6.
Fig. 6.
Pheno- and genotypic responses to selection changes in already diversified populations. Passaging schemes for a) populations already selected on antivirals and f) H2O control populations. Antiviral resistance for b) early (originated from passage 15), c) late (originated from passage 30) on antivirals preselected populations as well as g) early and late H2O control populations selected on antivirals. Bordered dots in b and c represent populations under nonselective conditions (relaxed selection). Red and blue *indicates significant differences (P < 0.05) as determined for wt and YS populations respectively, calculated by 2-way ANOVA followed by Šidák's multiple comparisons test for b and c and Tukey's multiple comparisons test for g. Mutations detected in early and late populations 15 passages after the respective change in selection was applied for d) preselected antiviral and h) H2O control populations. SNPs were categorized according to whether they were first observed after selection change (de novo mutations in higher, relaxed, ACV, FOS or GCV selection) or when already present in originating populations, if they increase (>1.2 times) in allele frequency relatively to the paired populations (for higher and relaxed selections) or to the originating population (for H2O controls). Variants in d labeled as constant did not differ between higher and relaxed selection pairs. e) Genomic locations of standing genetic diversity in preselected populations. Colored lines indicate SNPs with higher frequency after increased antiviral pressure, gray lines show SNPs selected under relaxed conditions.
Fig. 7.
Fig. 7.
Single clone analysis elucidates phenotypic and genotypic diversity upon in vitro evolution. a) Plaque size assay for 20 single clones per population as well as the population itself. Median and interquartile range are provided as well as individual sizes of 10 plaques per clone/population. Variance (σ2) was calculated using the mean plaque sizes of all 20 clones per population. *indicates significant differences (P < 0.05) against population value as determined by 1-way ANOVA followed by Dunnett's multiple comparisons test. Antiviral resistance measured via plaque reduction assays and plotted against one another for b) wt and YS GCV clones as well as c) wt and YS H2O clones. Bordered values indicate resistance measurements for populations. *indicates significant correlation and linear regression (P < 0.05) determined by Pearson's correlation test and simple linear regression. d) Phylogenetic trees of individual populations calculated and visualized with SplitsTree. Lineage selection is indicated by colored branches. e) Pairwise sequence identity scores for genomes from d. Dotted line indicates 100% identity. f) Heterozygosity, a measure to describe genetic variability within populations, for all genes in unique regions was calculated using a custom python script.

Similar articles

Cited by

References

    1. Andrei G, De Clercq E, Snoeck R. Drug targets in cytomegalovirus infection. Infect Disord Drug Targets. 2009:9(2):201–222. 10.2174/187152609787847758. - DOI - PubMed
    1. Arber W. Elements in microbial evolution. J Mol Evol. 1991:33(1):4–12. 10.1007/BF02100190. - DOI - PubMed
    1. Bennett L, Melchers B, Proppe B. Curta: a general-purpose high-performance computer at ZEDAT, Freie Universität Berlin. 2020. 10.17169/refubium-26754. - DOI
    1. Bolger AM, Lohse M, Usadel B. Trimmomatic: a flexible trimmer for Illumina sequence data. Bioinformatics. 2014:30(15):2114–2120. 10.1093/bioinformatics/btu170. - DOI - PMC - PubMed
    1. Borchers K, Ludwig H. Simian agent 8–a herpes simplex-like monkey virus. Comp Immunol Microbiol Infect Dis. 1991:14(2):125–132. 10.1016/0147-9571(91)90126-X. - DOI - PubMed

Substances

Grants and funding

LinkOut - more resources